NQ Year End Range (11-17-25)Recent price action is looking like what we saw late 2024 into 2025, prior to 26% drop (Feb,25). You can view the Post here:
The lift back up from the 26% drop has been a 60% run up on low volume, including the 10 minute 12% pop from Wash ST. "time to buy" Tweet. NAZ under long term TL (Orange trendline), needs to get above. Yellow line is drop trade and white is drop/pop trade. 294,910 - 25,910 is the Churn Range and look for a breakout. Below 24,910 is drop testing and looking for bounce back up, any lift near 25,910 (during the Overnight) should drop back inside Churn Zone.
Trade ideas

BTD ChallengeThree Step Challenge.
Day Trading Nasdaq-100 Futures.
I "Bachelor's"
II "Master's"
III "Phd"
I "Bachelor's"
A. Workshop: five tabs plus a reliable business news service
*1. www.marketwatch.com
*2. 4 Hour chart
***a. Session Volume Profile
***b. volume bars
*3. Daily chart
***a. volume bars
***b. 50-d simple moving average
***c. 200-d simple moving average
*4. 1 Hour chart
***a. Visible Range Volume Profile
***b. volume bars
*5. 5-minute chart
***a. volume bars
*6. Business news Fox, MSNBC, Bloomberg etc
Yesterday's chart was all about an outstanding, high probability win rate Buy the Dip plan. Now we shall earn a B.D. in BTD trades for the Nasdaq-100 futures. This will be applicable to the Dow, S&P 500 and the Russ 2000 futures. We shall go on to earn a Master's and then a Ph.D.. At the end you will be one of the best Buy the Dip traders on the planet.
The old ladies taught this trader how to outline in the fourth grade. He doesn't represent this as their best teaching but as his best (poor) remembrance.
He will stumble and bumble, but we'll get to the end. Let's call step 1 a Bachelor of Buying the Dip Degree - B.BTD.
Above is a rough outline of his workshop. If you like it use it. You are a unique individual. Do what works for you.
Expect additions, subtractions, revisions, anecdotes and, hopefully, facts.
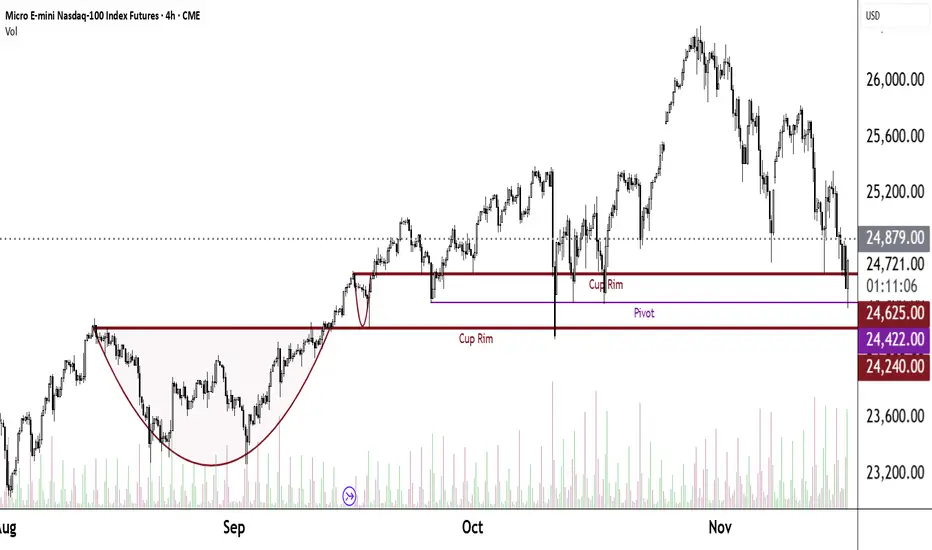
NQ Targets (11-24-25)The downtrend is on and will play inside the Diablo's (red diagonal lines) until breakout. 24,600 to 24,056 is Churn Zone and 24,708 and 24,226 are KL's to watch for opposite direction trades 1st and follow through 2nd. NAZ did come close to -10% level in the overnight, popped back up on a Friday (typical). The original Short call was aiming at all the O/N gaps up from prior Rig lift (from O/N), these have been cleaned out. The NDX chart will show these that started on 10/24 through 10/29. Note, from here the math gets interesting and can be illustrated on the NDX chart. We may see heavier selling in the O/N as 11/20 was an outside day reversal close. Notice on the NDX chart that the recent 58% lift can erased will only a 37% drop and the YTD 24% high is erased will only a 19% drop. Heavy volume lower after light volume (off session) lift. Keep in mind that the O/N has a new limit down of -7% (old was -5%). Keep in mind the drawdown math effect = pain. Unless we see a retest that can get above NDX Danger Zone and get back above the Upper TZ or long term trendline (orange, 25,095). NDX 25,095 - 23,233 is Churn Zone until breakout. NQ - NDX differential is about 200 points.
NDX Chart

If Nasdaq can crack the pressure line then...🔱 We have a Hagopian on the down-move. 🔱
Price was (so far) not able to reach the L-MLH of the red fork.
If buyers can eat through the pressure cheese, then the Long-Play is on.
Most often we see price breaking the pressure line and then coming back to it, scaring out the early longs, just to rush upwards again. So don’t panic if this happens. Place a proper stop and you're good.
As for targets, there is the red Centerline and the white Centerline.
On a break of the red CL, we have a high chance to see the same scenario as with the pressure line: UP-Down-MoreUp.
First snow in Switzerland arrived and Santa is preparing the reindeer to bring us some dough ;-)
Wish you all a profitable Friday.

NASDAQ 100 (NQ1!): Time To Buy This Dip? Oh Yeah!Welcome back to the Weekly Forex Forecast for the week of Nov. 10-14th.
In this video, we will analyze the following FX market: NASDAQ (NQ1!) NAS100
The NASDAQ pulled back after rallying for weeks! We patiently waited for a dip buying opportunity to form. Well, Friday might have given us the indication of an end to the pullback... and the opportunity to buy the dip may be upon us!
Wait for the shift in the market structure from bearish to bullish to form... then look for your
valid long setups.
Enjoy!
May profits be upon you.
Leave any questions or comments in the comment section.
I appreciate any feedback from my viewers!
Like and/or subscribe if you want more accurate analysis.
Thank you so much!
Disclaimer:
I do not provide personal investment advice and I am not a qualified licensed investment advisor.
All information found here, including any ideas, opinions, views, predictions, forecasts, commentaries, suggestions, expressed or implied herein, are for informational, entertainment or educational purposes only and should not be construed as personal investment advice. While the information provided is believed to be accurate, it may include errors or inaccuracies.
I will not and cannot be held liable for any actions you take as a result of anything you read here.
Conduct your own due diligence, or consult a licensed financial advisor or broker before making any and all investment decisions. Any investments, trades, speculations, or decisions made on the basis of any information found on this channel, expressed or implied herein, are committed at your own risk, financial or otherwise.

NASDAQ 100 (NQ1!): Wait For Price To Reach -FVG!Welcome back to the Weekly Forex Forecast for the week of Nov. 17-21st.
In this video, we will analyze the following FX market: NASDAQ (NQ1!) NAS100
The NASDAQ gave some bearish-neutral price action last week. It ended in a doji candle, not giving us much in the way of directioin. But, there is a bearish FVG on the Daily TF formed. The reaction to it will provide all the insight we need regarding the directional bias of this market for this coming week.
If the -FVG holds, sell it. If it is disrespected, buy it.
Simple.
Enjoy!
May profits be upon you.
Leave any questions or comments in the comment section.
I appreciate any feedback from my viewers!
Like and/or subscribe if you want more accurate analysis.
Thank you so much!
Disclaimer:
I do not provide personal investment advice and I am not a qualified licensed investment advisor.
All information found here, including any ideas, opinions, views, predictions, forecasts, commentaries, suggestions, expressed or implied herein, are for informational, entertainment or educational purposes only and should not be construed as personal investment advice. While the information provided is believed to be accurate, it may include errors or inaccuracies.
I will not and cannot be held liable for any actions you take as a result of anything you read here.
Conduct your own due diligence, or consult a licensed financial advisor or broker before making any and all investment decisions. Any investments, trades, speculations, or decisions made on the basis of any information found on this channel, expressed or implied herein, are committed at your own risk, financial or otherwise.

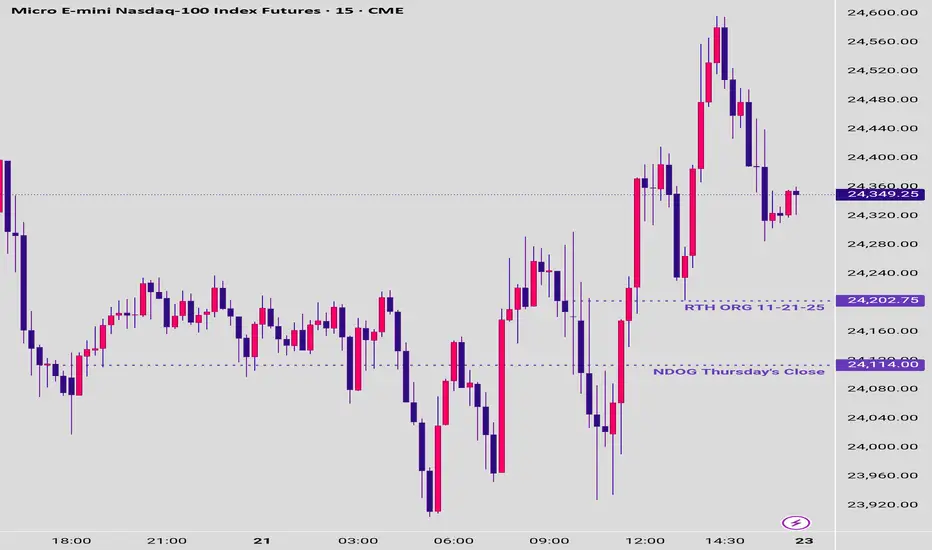
1:11 Trade idea;Nasdaq
A good zone for big trades
Its an instituional level, a lot of agressive buyers

Nasdaq Big crash is started from november 2025 month. Good luck.Technically on charts, Nasdaq has completed its viscous fed liquidity supported; all 5 elliot waves starting from 2001 dot com low 797 to present year high 26399. Today is 20.11.2025. Pic is attached for your reference. Will see this chart again after a year or may become obsolelte if nasdaq again crosses 26399 and stays above it for a month. Lets see.

4HR NQ – Attempting a New Direction4HR NQ – Attempting a New Direction (For Educational Purposes Only)
This analysis is shared strictly for educational purposes and is not financial advice. It is intended to illustrate chart-reading techniques, structure mapping, and scenario planning.
Bullish Scenario – Potential Uptrend Zone
The chart outlines a clearly defined uptrend continuation area:
A green expansion zone highlights the upside target region toward 25,891.50.
A –1% risk bubble shows the approximate drawdown tolerance for a long bias.
A break and sustained move above 25,591.50 (white dotted line) would strengthen bullish momentum.
The yellow dashed line above represents a major resistance area that the market must reclaim to shift direction convincingly.
Bearish Scenario – Potential Downtrend Zone
The lower side of the chart maps the downside continuation possibility:
A red zone defines the bearish target area toward 24,704.75.
A –1% risk bubble marks the downside tolerance for a bearish setup.
Losing the central grey zone opens the path toward the deeper support band, signaling continuation of downward pressure.
Pattern & Symmetry Structure (Educational Highlight)
On the left side, the chart features a harmonic/symmetry-based analytical framework used for pattern recognition:
A boxed structure spans 22 bars, with two vertical 8-bar segments forming time symmetry.
Two 2.14% price swings mark the upper and lower rotational boundaries.
Curved arcs and diagonals are used to visualize price rotation, volatility compression, and potential reversal points.
This section is included to demonstrate how symmetry and measured movements can support probabilistic forecasting in technical analysis.
Neutral Decision Zone (Market Pivot Area)
The central grey band represents the equilibrium zone, where buyers and sellers are in temporary balance.
Price is currently interacting with this zone, making it the key decision point.
Orange blocks above and below may indicate smaller supply/demand pockets or micro-imbalances.
A directional break from this zone typically sets the next short-term trend.
Summary Market at a Critical Turning Point
Above the grey zone → momentum favors the green uptrend zone.
Below the grey zone → momentum favors the red downtrend zone.

NQ1! 4HR Setup – EMA 100 + Divergence Structure📊 NASDAQ 100 Futures (NQ1!) – 4HR Chart
- Entry: 24,893
- Stop: 25,398
- Target: 24,403
🧩 Structure:
- Descending channel breakout potential
- EMA 20 touch + divergence structure
- Hidden divergence confirmation on stochastic

NQ Daily Outlook | November 19, 20251H timeframe — using the 50 EMA (black) for trend + 5/10 EMAs (white) for momentum/BOS.
Quick read: We’re still under the 50 EMA, and the whites are curled down. Structure is still making lower-highs and lower-lows, so momentum stays bearish for now.
Bearish idea (favored)
If we stay under the 5/10 EMAs and reject the 50 again, I’m looking for a BOS down and continuation into the lows.
Bullish idea
If we reclaim the whites, break a lower-high, and hold above the 50 EMA, then I’ll flip long and look for a clean BOS up.
Bias: Bearish until price breaks structure to the upside and holds above the 50 EMA.

NQ Short setup on 1HR Bearish DivergenceNQ Short setup on 1HR Bearish Divergence
Entry: 25447
SL: 25835
TP: 24282
RR: 1:3

Next week NQ BearishNext week’s price outlook appears bearish.
Market structure shows a clear downtrend following the confirmed break of the previous swing low.
Price is expected to retrace into the iFVG before continuing lower toward the downside order block.
The iFVG aligns precisely with the lowest tick of the highest candle of the prior move and sits in the correct position relative to the previous supply zone.
The order block below is a high-probability area, as five liquidity lows are positioned directly above it.

Bullish Continuation After Strong Rebound From FVG DemandCME_MINI:NQ1! has successfully rebounded from the Fair Value Gap (FVG) demand zone at 25,150–25,220, confirming this area as a strong short-term base for buyers. The earlier sweep of multiple SSS (sell-side liquidity) levels around 24,850–24,900 seems to have cleared out weak hands, allowing the market to rebuild a bullish structure.
With the FVG now acting as a defended demand zone, bullish momentum is beginning to form. The recent rejection from the lows and the shift back above short-term structure indicate that buyers are reclaiming control.
As long as NQ holds above the FVG demand, price is well-positioned to extend higher toward:
25,450 (first reaction point)
25,600 (continuation target)
25,750–25,820 (major supply zone + previous rejection area)
A higher low above the FVG would further strengthen the bullish outlook and signal continuation toward the upper supply. Current flow favors a sustained push upward as long as demand continues to hold.

Emini Nasdaq 100. Important Areas to look for and Weekly outlookCME_MINI:NQ1!
Highlighted the important levels. what to look for how we can approach the next week in terms of higher timeframe reference points

AI Valuation TechnicallyThese are the three largest market-cap listed companies on the Nasdaq.
If we are concerned about an AI bubble, I’m going to show you how I perform a quick glance at some top companies and their index to determine the likelihood of an upcoming short-, mid-, or long-term correction.
In 2017, Microsoft’s P/E reached its highest at 45 — and it continued to rise after that.
In 2023, Nvidia’s P/E reached its highest at 147 — and it continued to rise after that.
In 2024, Apple’s P/E reached its highest at 40 — and it continued to rise after that.
Video version:
Micro E-mini Nasdaq-100 Index
Ticker: MNQ
Minimum fluctuation:
0.25 index points = $0.50
Disclaimer:
• What presented here is not a recommendation, please consult your licensed broker.
• Our mission is to create lateral thinking skills for every investor and trader, knowing when to take a calculated risk with market uncertainty and a bolder risk when opportunity arises.
CME Real-time Market Data help identify trading set-ups in real-time and express my market views. If you have futures in your trading portfolio, you can check out on CME Group data plans available that suit your trading needs tradingview.com/cme/

NQ Targets (09-29-25)Moving into October, 7 week range forecast. Basically, 23,050 is 50% retracement of YTD lift. Looking for a retest of that, no hold and keep going to the YTD Open or circle below (yellow arrow path). White arrow path has two targets, these are potential drop/rejection zones (to yellow arrow path). KL 24,950 is ML of TZ, we have played in lower half and may see some play in upper half. Sideways to lower during this 7 week period is the idea.

NQ Long Setup at 24,765: Strong Buyer ZoneNQ created a strong support at 24,765 after a sharp rejection of lower prices. A heavy volume cluster formed right where buyers stepped in, and a wide fair value gap confirms strong buying aggression. The beginning of this FVG marks the key reaction level. Waiting for a pullback into 24,765 offers a clean long setup with solid confluence.

Monitoring AI Valuation - Precision on Upcoming CorrectionThese are the three largest market-cap listed companies on the Nasdaq.
If we are concerned about an AI bubble, I’m going to show you how I perform a quick glance at some top companies and their index to determine the likelihood of an upcoming short-, mid-, or long-term correction.
In 2017, Microsoft’s P/E reached its highest at 45 — and it continued to rise after that.
In 2023, Nvidia’s P/E reached its highest at 147 — and it continued to rise after that.
In 2024, Apple’s P/E reached its highest at 40 — and it continued to rise after that.
Micro E-mini Nasdaq-100 Index
Ticker: MNQ
Minimum fluctuation:
0.25 index points = $0.50
Disclaimer:
• What presented here is not a recommendation, please consult your licensed broker.
• Our mission is to create lateral thinking skills for every investor and trader, knowing when to take a calculated risk with market uncertainty and a bolder risk when opportunity arises.
CME Real-time Market Data help identify trading set-ups in real-time and express my market views. If you have futures in your trading portfolio, you can check out on CME Group data plans available that suit your trading needs www.tradingview.com

NQ UpdateClosed out most of my puts, but did not go long. NQ hasn't hit oversold yet, look at the MFI.
Gap direction will depend on FDAX which is oversold and at support. If it breaks support, indicators won't mean much.
NVDA earnings Wed AH, jobs report THU premarket, Fed minutes Thu.

NQ UpdatePretty much the same as ES.
Since I didn't buy any calls this afternoon, I'm probably just staying out for now. No point in chasing a 1.5% futures pump.

NDX - DONT HURT ME NO MORE!Good Morning,
Hope all is well. NDX !!! Don't hurt me no more. Nope! We saw this coming from quite a distance away. I first observed a pull-back coming into effect on a shorter time frame and have since charted it on longer time frames.
Lets get down to basics. The markets had a phenomenal run this year, there can only be so much confidence in something before people start to get weary. That is exactly what we have here. Currently are we finished the pull-back? No - Are we going to dive into a reversal?, unlikely. There is still a very long way to go until we hit that point.
My TFSA has been limited at this point, I am not buying much and am holding a 75% cash reserve. My other two accounts are swing and day trade accounts so I do not bother and instead play the positions when opportunity arises.
Trade Safely!
Enjoy!
