NQ Daily Outlook | November 20, 20251H timeframe — 50 EMA (black) for trend + 5/10 EMAs (white) for momentum/BOS.
Quick read: Price broke above the 5/10 EMAs and cleared the 50 EMA with a strong impulse. All EMAs are now below price, so we’re in a bullish state for the first time in a while.
Bullish idea (favored)
Now that we’re above all EMAs, I’m looking for:
A small pullback into the whites
A bullish BOS
Then continuation higher
As long as we stay above the 50 EMA, momentum stays bullish.
Bearish idea
Only shifts bearish again if:
We drop back under the 5/10 EMAs
Lose the 50 EMA
Print a BOS down
Until that happens, shorts are lower probability.
Bias: Bullish — EMAs reclaimed + impulse confirms momentum. I’m looking for continuation up unless we lose the whites and fall back under the 50 EMA.
Trade ideas

Derivatives & Options Trading Trends1. Rising Retail Participation and Democratization of Derivatives
One of the most significant trends is the rapid increase in retail participation, especially in markets like India, the U.S., and parts of Asia. Platforms such as Robinhood, Zerodha, Upstox, and Interactive Brokers have made derivatives trading more accessible by offering low-cost or zero-brokerage models, simplified interfaces, and educational tools.
In India, index options volumes on NSE have surged to record highs, driven by weekly and even daily options expiries. Retail traders now actively participate in directional and non-directional strategies including spreads, straddles, strangles, and intraday scalping. Because of lower margin requirements and high leverage, derivatives have become an attractive entry point for younger traders.
This democratization comes with both opportunities and risks. While broader participation enhances market depth and liquidity, it also increases systemic concerns around over-leverage, herd behaviour, and inadequate understanding of derivatives mechanics.
2. Explosive Growth of Weekly and Short-Dated Options
Short-tenor options—weekly, daily, and even zero-day options (0DTE)—have become a global phenomenon. The U.S. S&P 500 Index (SPX) now sees major volumes in 0DTE options, favoured by traders for intraday speculation, gamma exposure, and event-driven strategies.
Similarly, in India, weekly Bank Nifty and Nifty expiries have turned into some of the most traded options worldwide. Traders prefer these contracts for:
Lower premiums
Quick payoff realization
High volatility leading to strong intraday movements
Flexibility to align with macro events (Fed decisions, CPI data, RBI policy, earnings, etc.)
Short-dated options have reshaped intraday volatility patterns, with large swings near expiry due to gamma effects and dealer hedging flows.
3. The Era of Algorithmic and Quantitative Trading in Derivatives
Quantitative models and algorithmic trading systems now dominate global derivatives markets. Hedge funds, proprietary desks, and even retail quants increasingly use:
Market-neutral strategies
Volatility arbitrage
High-frequency scalping
Options-based hedging
Gamma and vega-weighted portfolios
Machine-learning-driven directional trades
In India, algo penetration in derivatives has increased dramatically after regulatory approvals for API-based trading. Low-latency systems allow quants to execute thousands of trades per second, exploiting micro-imbalances, liquidity pockets, and implied-volatility mispricings.
Algo trading is particularly influential in options markets, where pricing inefficiencies emerge frequently due to time decay and volatility shifts.
4. Surge in Volatility Trading and Volatility Derivatives
A major global trend is the rise of volatility as an asset class. Traders now actively trade volatility, not just price direction, through:
VIX futures and options
Implied volatility strategies (IV crush, IV expansion)
Calendar spreads
Vega-neutral portfolios
Volatility arbitrage between indices and individual stocks
During major macro events—geopolitical shocks, central bank decisions, inflation releases—volatility spikes create large opportunities for professional traders.
The global appetite for volatility exposure reflects increasing macro uncertainty in markets shaped by inflation cycles, geopolitical risks, and policy unpredictability.
5. Growing Popularity of Exotic Options and Structured Derivatives
Beyond standard call and put options, demand is rising for exotic derivatives, especially among institutions. These include:
Barrier options
Asian options
Binary options
Lookback options
Range accrual derivatives
Digital payoff structures
Structured product desks in banks use these derivatives to offer tailored risk-return solutions to corporate treasuries, high-net-worth individuals, and offshore investors.
In equity derivatives, structured notes like autocallables are gaining traction globally, especially in European and East Asian markets.
6. Commodities and Currency Derivatives: A Renewed Focus
Commodity and currency derivatives have seen renewed interest due to global supply chain disruptions, geopolitical instability, and inflation pressures.
Key Drivers:
Oil price volatility due to Middle East conflicts
Agricultural supply shocks
Currency fluctuations driven by monetary policy divergence
Rising importance of hedging for import- and export-dependent industries
In India, the launch of new currency derivatives and increased retail interest in crude oil and natural gas options have broadened the market.
7. Interest Rate Derivatives and the Post-Rate-Hike World
As central banks oscillate between tightening and easing cycles, interest rate derivatives (IRDs) such as swaps, futures, and swaptions have gained remarkable importance.
Key themes include:
Hedging long-term debt exposure
Speculation on rate paths
Positioning around government bond yield movements
Managing duration risk for institutional investors
The pricing of interest rate options is now heavily influenced by inflation expectations, forward guidance, and global economic conditions.
8. Regulation, Risk Control & Margining Reforms
Global regulators have tightened rules around derivative trading to ensure transparency and reduce systemic risk. Major reforms include:
Mandatory margining for futures and options
Upfront collection of SPAN + Exposure margin
Position limits for retail participants
Greater disclosures for brokers and exchanges
Risk-based levies on high-frequency trading
Banning of certain high-risk derivatives for retail in some regions
In India, peak margin rules and tightened risk controls have significantly changed intraday derivatives strategies, reducing excessive leverage.
9. Rise of Data-Driven Decision Making
Modern derivatives traders rely heavily on:
Real-time order book analytics
Option Greeks monitoring systems
Volatility surface modelling
Big-data sentiment indicators
AI-driven predictive models
Access to sophisticated analytics platforms—Sensibull, Opstra, TradingView, Bloomberg, Reuters, and broker-provided tools—helps even retail traders adopt institution-grade analysis.
10. Shift Toward Multi-Asset Derivative Strategies
Markets are becoming increasingly interconnected. Traders now prefer multi-asset strategies that combine:
Equity + Currency
Equity + Commodity
Interest Rate + Currency
Options + Futures
Cross-country derivatives
These hybrid strategies help hedge correlated risks and exploit arbitrage opportunities across markets.
Conclusion
Derivatives and options trading are undergoing a profound transformation driven by retail participation, technological advancement, algorithmic dominance, volatility-focused strategies, and regulatory shifts. Markets are faster, more interconnected, and more complex than ever before. Whether used for hedging, speculation, arbitrage, or portfolio diversification, derivatives remain a cornerstone of modern financial markets.
As the global environment becomes more uncertain, derivatives will continue to play a crucial role in risk management and trading innovation—shaping the next era of financial markets.
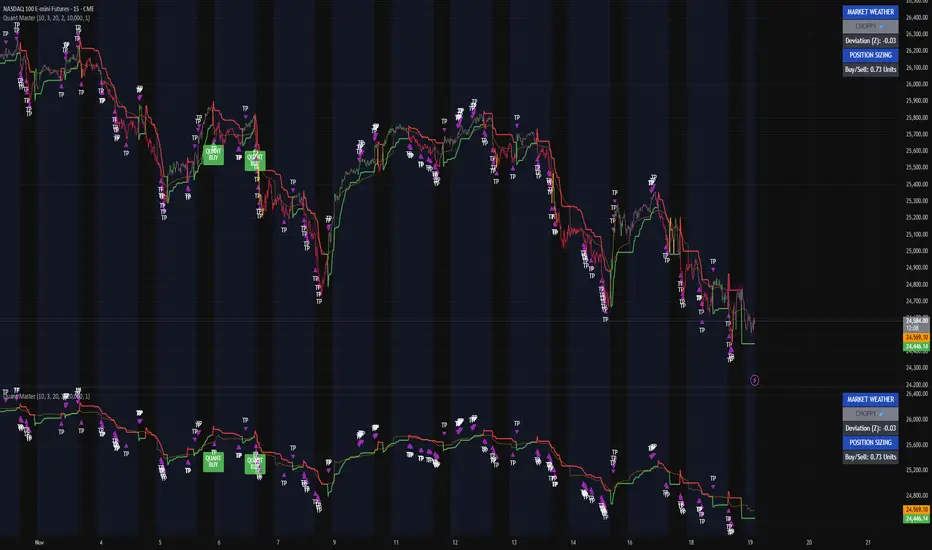
Pure signal reading. Here’s how I’m reading NQ right now.I’m tracking NASDAQ 100 e-mini futures (NQ) on the 15-minute using my Quant Master Trend System — the same model I use to separate real directional pressure from intraday noise.
This entire chart is a perfect example of why most traders get chopped to death: they trade emotions, but I trade structure.
The ribbon is choppy, fragmented, and constantly flipping, which is exactly what I expect when Market Weather is labeled CHOPPY in the panel.
That mode tells me one thing:
Breakouts fail.
Breakdowns fail.
Momentum has no conviction.
When the system is in CHOPPY mode, every pullback looks like a setup, but it’s not — the model purposely suppresses continuation trades and fires more TP clusters because it’s detecting distribution, not trend.
You can see it clearly:
• Every time the ribbon tries to go green, it gets rejected within a handful of bars.
• Every red flip lacks strong downside extension — everything fizzles.
• Price oscillates around the volatility stop instead of respecting it.
• TP clusters fire rapidly — that’s your model’s “don’t trust this move” signature.
Even the Quant Buy signals tell the story.
They’re valid moves, but they’re short-lived, because the underlying pressure isn’t unified. That’s the entire point of this system: it’s telling you the environment, not just the direction.
The deviation reading is mild at Z ≈ -0.38, which means price isn’t stretched in either direction — the perfect recipe for messy intraday action.
So here’s how I’m interpreting this:
This is not a trending environment.
This is rotational flow, liquidity probing both sides, and no clean edge.
The ribbon’s behavior, the failed retests, the compression, and the constant TP firing confirm that NQ is stuck in a structure where continuation trades have the lowest probability.
Until Market Weather leaves CHOPPY and we get a clean ribbon alignment, I’m treating everything as low conviction and short-duration.
NQ 15 MIN Overall Idea
(Not financial advice)
The chart shows a price pattern forming after a strong move upward and downward, followed by a consolidation phase. The diagram highlights targets, supports, and a gap fill area, helping determine bullish vs. bearish scenarios.
Wave Structure (A → E)
(Not financial advice)
On the left side, there's a labeled price swing (A–B–C–D–E).
This represents a sequence of higher-lows and lower-highs, ending at point (E).
Point (E) acts as the base from which the next structure begins.
Triangle Wedge Pattern
(Not financial advice)
Right after point (E), the market forms a tightening triangular structure
Upper descending line seller pressure
Lower ascending line buyer pressure
This pattern shows compression before a larger movement.
Gap Fill Area
(Not financial advice)
The GAP FILL zone inside the triangle marks an area where price previously skipped quickly.
Price often returns to such zones, creating
temporary support
or a magnet before continuation
Price Targets
(Not financial advice)
1ST TARGET
Primary upside objective if price breaks above the triangle.
2ND TARGET
A farther target indicating strong bullish expansion.
Support Levels
(Not financial advice)
1ST SUPPORT
Closest support maintains bullish structure.
2ND SUPPORT
A deeper structural support.
3ST SUPPORT
Strongest support and major turning point.
Bullish vs. Bearish Line
(Not financial advice)
The dashed horizontal line at the bottom marks the key boundary
Above → bullish
Below → bearish

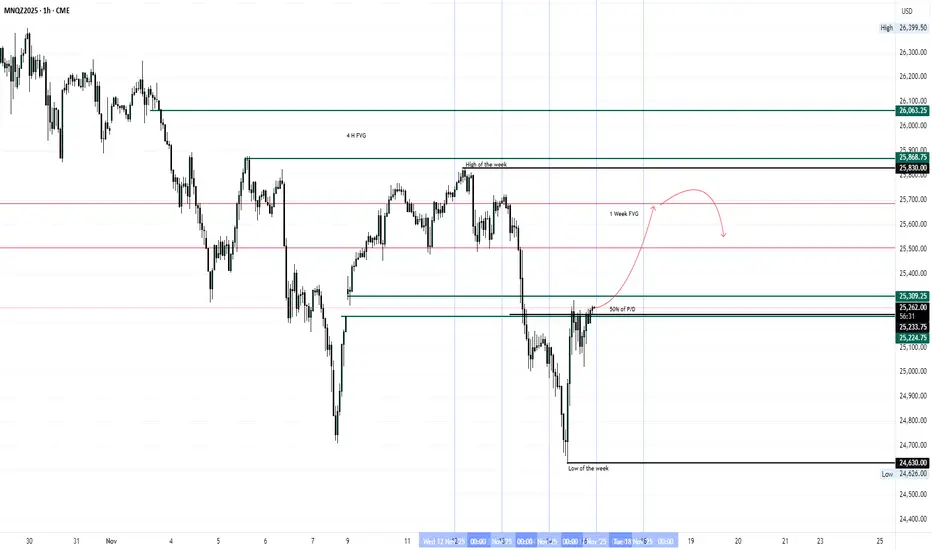
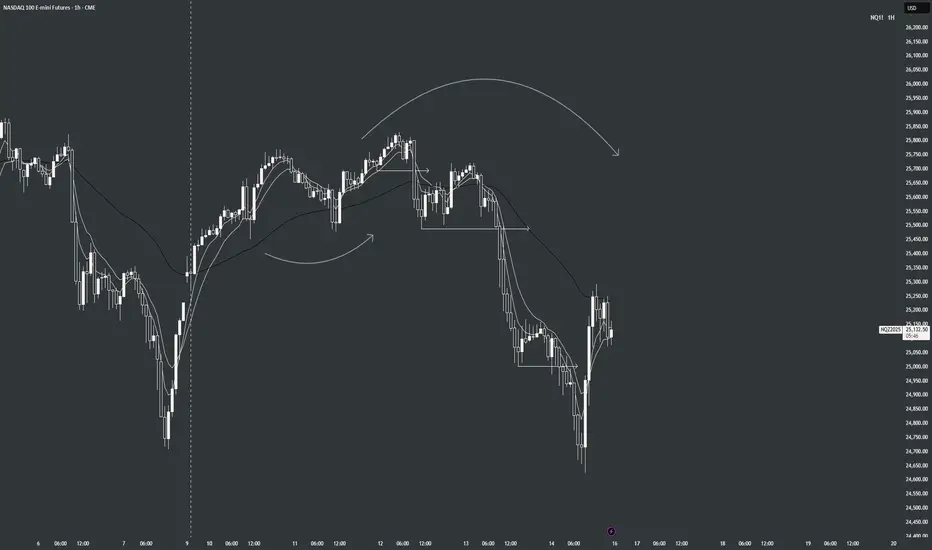
#202546 - priceactiontds - weekly update – nasdaq e-miniGood Evening and I hope you are well.
comment: Again, not much difference to dax. Also in a triangle and for now I highly doubt we will see a big range expansion out of 24600 - 25500. We had two weeks where the bears showed strength but what do they have to show for? We closed above 25000 in both weeks. That’s still as bullish as it gets. Only a bearish daily close below 24600 could change my outlook.
current market cycle: trading range 24000 - 26500 / 4h chart it’s a triangle 24700 - 25500
key levels for next week: 24500 - 25500
bull case: Bulls bought 24700 heavily again and closed the week above 25000. Bears can have no confidence in shorts when we rally for 667 points after a 1095 point drop. Problem for the bulls is that they also have to be very careful with buying high again since the downside can be huge. Which will likely mean that we won’t see much interest in buying above 25400ish. Even longing 25000 when we can drop down to 24600 or lower, is a tough trade.
Invalidation is below 24709.
bear case: Every dip is heavily bought. Has not changed. Can only become more bearish with a daily close below 24000 and that’s far. 25830 is likely the stop, most bears have to have for most shorts next week. That’s a big range and it any short below 25300 from being decent imo. We are making lower highs and lower lows but the lower lows just barely. Until that changes, we will most likely continue sideways in the given range.
Invalidation is above 25830.
short term: Neutral around 25000. Short closer to 25700 and longs closer to 25600.
medium-long term - Update from 2024-11-02: Market went further in the wrong direction so my targets become increasingly unrealistic. Right now the 50% retracement is 21750 and would mean a 18% drop. That’s a bit too much to ask for as of now. 24150 is the breakout-retest of the prior ath from 2024-12 and a more realistic target.

"Traffic"Stereophonics 1997
Daily Grind
Congestion
Setup
1. many supports & resistances
2. much swirling market moving news
3. strong fundamentals
4. historical bull market
5. strong resistance @ 25000 = a very round number
6. jobless data out soon
7. 4.2% est 3rd qtr growth
8. NVDAs earnings out & great
Trading Plan
1. Good BTD - 25000, wait for the bounce
2. Breakouts - always
3. Pivots, & Jokers - always


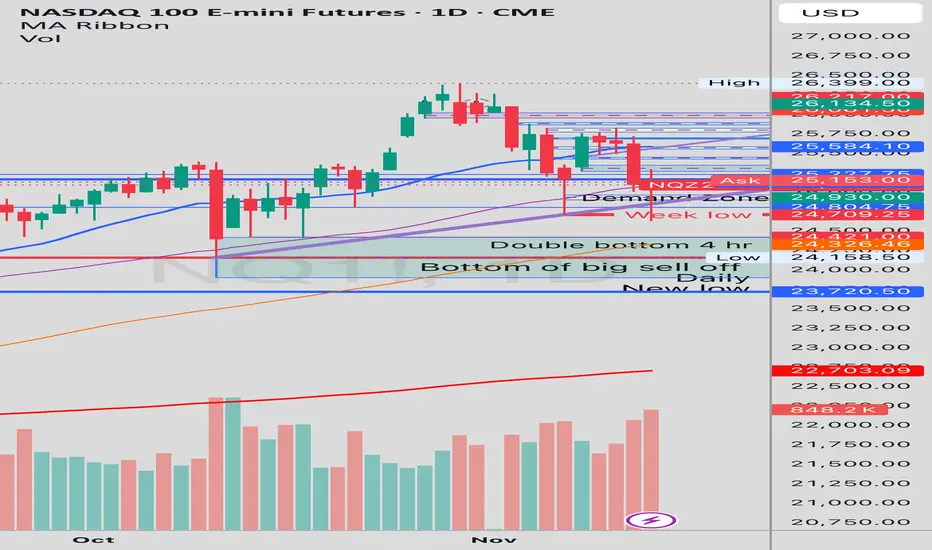
NQ Power Range Report with FIB Ext - 11/20/2025 SessionCME_MINI:NQZ2025
- PR High: 25110.75
- PR Low: 24955.50
- NZ Spread: 211.5
Key scheduled economic events:
08:30 | Philadelphia Fed Manufacturing Index
10:00 | Existing Home Sales
Session Open Stats (As of 12:15 AM)
- Session Open ATR: 478.35
- Volume: 49K
- Open Int: 292K
- Trend Grade: Long
- From BA ATH: -4.6% (Rounded)
Key Levels (Rounded - Think of these as ranges)
- Long: 26636
- Mid: 25410
- Short: 24039
Keep in mind this is not speculation or a prediction. Only a report of the Power Range with Fib extensions for target hunting. Do your DD! You determine your risk tolerance. You are fully capable of making your own decisions.
BA: Back Adjusted
BuZ/BeZ: Bull Zone / Bear Zone
NZ: Neutral Zone
Nasdaq reqdy for new all time highsChart looks great .
I think there is another push to the upside .
Equities together with crypto will have another run.

NQ heading towards 23,000Path of least resistance is down. Plenty of selling pressure since October 30Th. Had a high volume sell on 11-20 with poor buying today. Short term target 23,000

POSSIBLE ROD MAP FOR THE PRICE MNQZ2025 24-28 NOVFor this week do not trade until Wednesday New York close High volatility, Therefore start trading on Thursday better and look for the sales to 23900, the news can manipulate the price be careful.

Monastic System | Live NQ LongLong 24350
TP 25060
SL 24203
RR 1:4.7
Structure doesn’t lie.
#MonasticSystem

NQ Power Range Report with FIB Ext - 11/24/2025 SessionCME_MINI:NQZ2025
- PR High: 24555.25
- PR Low: 24455.25
- NZ Spread: 223.5
No key scheduled economic events
Low participation expected for short Thanksgiving holiday week
Session Open Stats (As of 12:05 AM)
- Session Open ATR: 533.61
- Volume: 41K
- Open Int: 298K
- Trend Grade: Long
- From BA ATH: -7.4% (Rounded)
Key Levels (Rounded - Think of these as ranges)
- Long: 26636
- Mid: 25410
- Short: 24039
Keep in mind this is not speculation or a prediction. Only a report of the Power Range with Fib extensions for target hunting. Do your DD! You determine your risk tolerance. You are fully capable of making your own decisions.
BA: Back Adjusted
BuZ/BeZ: Bull Zone / Bear Zone
NZ: Neutral Zone

POSSIBLE FORECAST MNQZ2025 17-21 NOV 25 This week will probably have a very good opportunities 25700 and 25300 we have to see if it's possible to reach the high of the week 25900 search for the bullish scenarios
Bitcoin Is Crashing… Nasdaq Still at Highs. Who’s Lying?For years, Bitcoin and the Nasdaq 100 have shown consistently high correlation, driven by the same macro forces:
• global liquidity cycles,
• risk appetite,
• real-rate expectations,
• and flows into high-beta growth assets.
Both are classic risk-on instruments—they benefit when liquidity expands and suffer when uncertainty rises.
However, the chart above shows a significant decoupling over the past weeks:
🔻 BINANCE:BTCUSDT : Deep Correction & Negative YTD
• Down more than 25% from the highs
• Trading –5% YTD in USD terms
• Volatility expanding and long liquidations accelerating
• Risk sentiment turning sharply lower within crypto
🔺 LSE:NQ11 : Near All-Time Highs
• Still hovering close to ATH levels
• Posting +16% YTD in USD
• Supported by strong earnings, mega-cap tech flows, and continued growth leadership
⚠️ This divergence is unusual — and historically meaningful
BTC and Nasdaq rarely disconnect to this magnitude without one of two outcomes:
1️⃣ Bitcoin Is Leading the Next Risk-Off Move
Crypto often reacts faster to changes in liquidity conditions and risk appetite.
If this is another leading signal, equities (especially high-beta tech) may follow with a lag.
2️⃣ Correlation Break Is Temporary
If the move was primarily crypto-specific (liquidations, funding resets, derivatives unwinds),
BTC could mean-revert upward as flows stabilize.
📌 Our View
Historically, when divergences of this scale have appeared:
Bitcoin leads, equities follow.
The magnitude of BTC’s correction vs the Nasdaq’s resilience suggests that:
👉 BTC may be pricing in a shift in risk conditions ahead of equities, not the opposite.
The key question for the next weeks:
Is the Nasdaq ignoring a message that crypto is already discounting?

Would you consider this a H&S break on NQ?Would you consider this a H&S break?
I know things are volitile and wierd right now...which makes me think that this could be a weird looking H&S. Remember, the patterns show us an idea, a story. Does this tell the story to you? It shows what an H&S shows. It is just sloppy because of volitile movements...
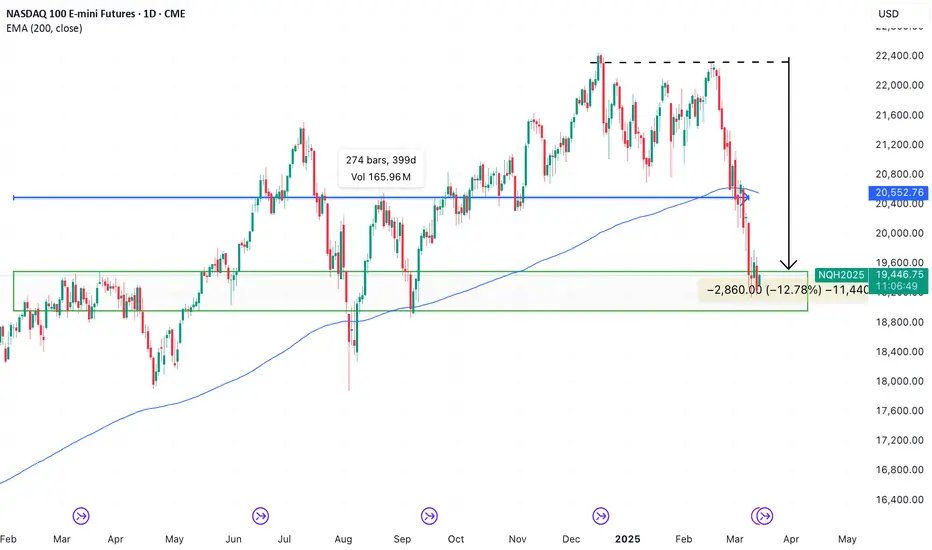
NASDAQ 100: Same Song, Different LyricsAfter a 12% pullback, NQ is retesting price levels from 400 days ago, and to many, it looks like a crash is coming. But what’s really driving the jitters?
1.Apple’s sales concerns & downgrades
2.Tariff fears (that haven’t even been imposed yet)
3.Doomsday takes on the U.S. economy
Sounds familiar? Same melody, just different words.
Yes, the stop is wide, but the profit target from here is at least 5X.
The question is—who sees an opportunity, and at what levels?
NQ Price points im looking at for reversals or continuationsReversal: Sweep HTF LiQ + Breakaway gap + BRKR + Revisit = Entry
Continuation: Closure above 25,936 + MTF CISD + IMRB/IOFED + LTF OB respected = Entry
DRH- 26220.75
75DRT-25936.75
DRE- 25652.75
25DRT- 25368.75
(close of 25147.50)
DRL- 25084.50
NQ Weekly Recap | November 10–14, 2025Method: I track impulse/correction and BOS (break of structure). Trend filter is the 50 EMA (black); momentum/trigger EMAs are the 5 & 10 (white).
Recap
Mon: Clear upside impulse with BOS up. White EMAs above the black 50 → bullish continuation vibe.
Tue: Early follow‑through, then momentum faded; corrections got deeper and EMAs started to flatten.
Wed: Failed attempts to hold above the white EMAs, then a clean BOS down as price slipped under the black 50 → trend flipped.
Thu: Follow‑through short. Lower highs into the white EMAs; corrections kept getting sold while staying below the black 50.
Fri: Flush then sharp bounce. Price reclaimed the white EMAs intraday but stalled around the black 50—looks corrective; no full BOS up yet.
Takeaways
Early week was bullish.
Midweek we failed below the EMAs and followed shorts.
The late‑week bounce is just a correction unless we get a fresh BOS up and hold above the EMAs with the black 50 turning back up.
Liquidity Hunting On!A perfect drop post buy side Liquidity Hunting now going for the sell side Liquidity.
NQ Range (11-10-25, Week 7)The 7 week Forecast is in the final week and we are up about 300 points after getting rejected at upper Target. NAZ back in the Churn Zone and did U Turn off Friday lows just under the Mid Level CZ. KL 483 is TZ to 25,333. Key fact is the NAZ and NDX are at long tern TL. Under the TL is Danger Zone to lower CZ and then TLX 24,056. Current range to watch is 25,333 and 24,817. Friday lift was Failed Auction up and these usually will get retested. Could be a start of a U Turn (that will drop and retest). Or, just another Friday pump drop offset that will trap the BTD/FOMO's.

"It's Me Again, Margaret"Ajax, aka Monster Head & Shoulders, is back again. He has been dominating our charts since 9/16.
His neckline: 24680
Buy the Dip area 1: 24640 - 24570
Buy the Dip area 2: 24550 - 24500
Pullbacks are a normal part of bull markets. We are ~4% off the high. Correction territory is 10% or more. As Day Traders we welcome pullbacks as opportunities to trade the same Px zone at least one more time.
This one is due to the govt. shutdown and the resulting lack of economic data as well as the economic losses, profit taking after the Dow posted two all-time highs in a row, and concern about over valuation especially of tech stocks.
All a normal and healthy part of the markets.
One major attraction of the Nasdaq 100 to us as day traders are its big swings. It gives more opportunity for Px action and profits than the other markets.
He has a new Breakout Ladder set @ 24770. every 20 points he will buy 1 contract. Each and every target will be 19 points.
Above you can see the BTD areas. This neckline may turn out to be a good BTD area. I'd wait until at least 09:50 NY Time before placing a BTD trade above the green shaded BTD areas.
From 9/16 to the present this support zone has been a very important one. Let's see if it holds.
