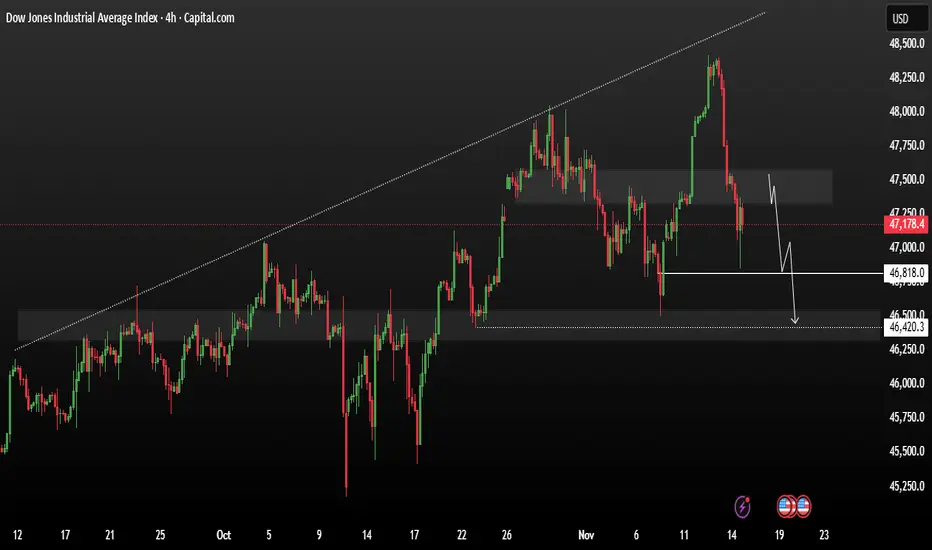
US30 remains in a bearish trend toward support levels.US30 remains in a bearish trend. The price may first retest a resistance zone, but unless there is a confirmed bullish breakout, the expectation is for another decline toward support levels.
From a market sentiment perspective, U.S. indices closed mixed on Friday as investors look ahead to Nvidia’s
About Dow Jones Industrial Average Index
Dow Jones* often refers to the Dow Jones Industrial Average, which was one of the first stock indices and is one of the most commonly referred to barometers of equity performance in the United States. The Dow Jones Industrial Average, not to be confused with the Dow Jones Transportation index (which was the first index), is often called, "the Dow" or "DJIA," and consists of thirty stocks which traditionally were industrial-based. But in recent years as the US economy has become more consumer-oriented, the index has seen a change in composition that no longer has much to do with direct industrial investment.
Related indices
DOW JONES Will the 1D MA100 save the day?Dow Jones (DJI) has been trading within a 6-month Channel Up and in the past 4 days it has been correcting on its latest Bearish Leg. By doing so, it broke below the 1D MA50 (blue trend-line) and is approaching the 1D MA100 (green trend-line) right at the bottom of the pattern.
This is the Channel'

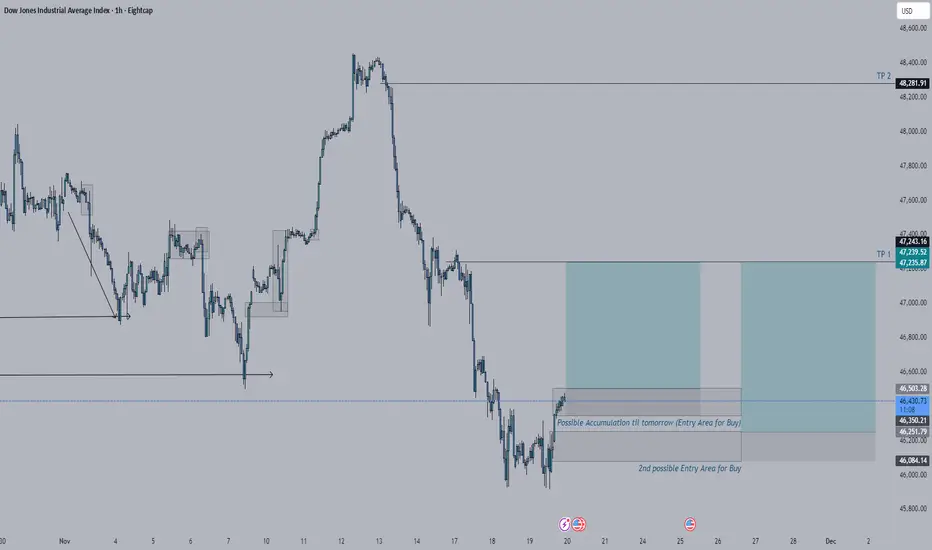
US30 Bullish MovementI'm biased for buy on US30. I have 2 area that I'm watching for entry but I think the market will just be accumulating in one area make a bit of a push to the downside within the area where it is currently accumulating then continue to push the market tomorrow. For TP, I'm actually eyeing more in th
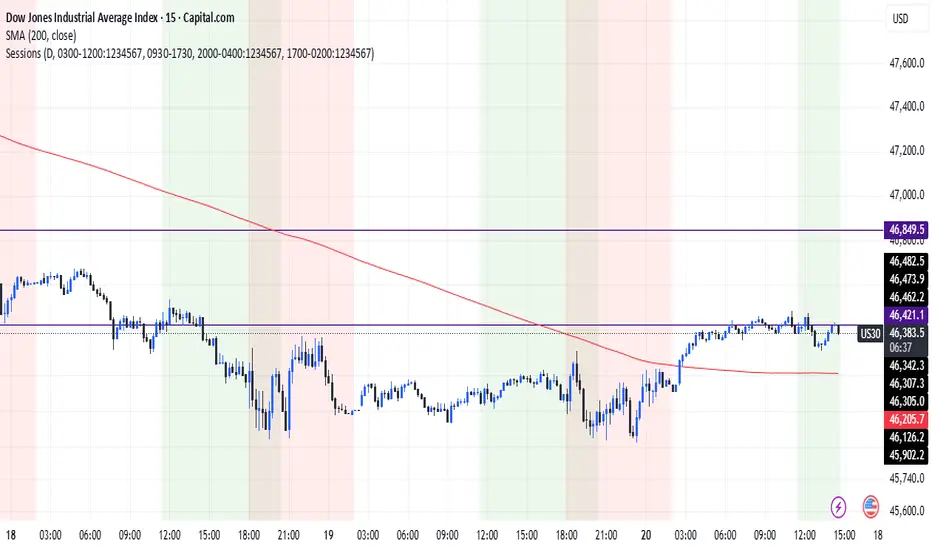
Dow Weakens Under Key Resistance | Sellers in ControlUS30 | Overview
The Dow Jones maintains a bearish trend while trading below 46410, with momentum favoring a move toward 46000, and a further decline toward 45680 if that level breaks.
A bullish recovery will only be possible if the price closes above 46600, which would open the path toward 46920.

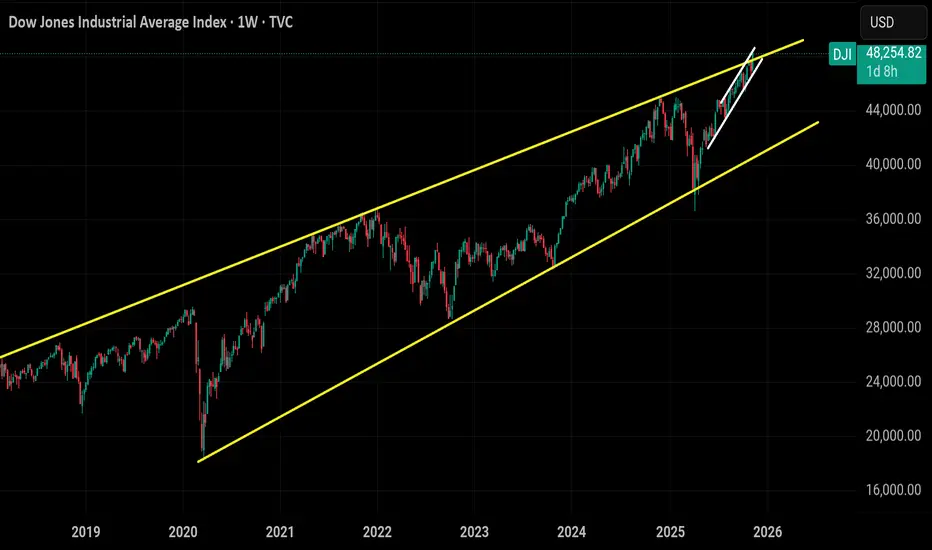
Dow jonesChart is self evident but let me explain.
Top of weekly channel 5yr resistance
(YELLOW)
Top of tariff rebound channel
(WHITE)
Outside weekly and daily bollingerband
Basically we are at extreme resistances really overbought.. imagine trying to break through something while being low on
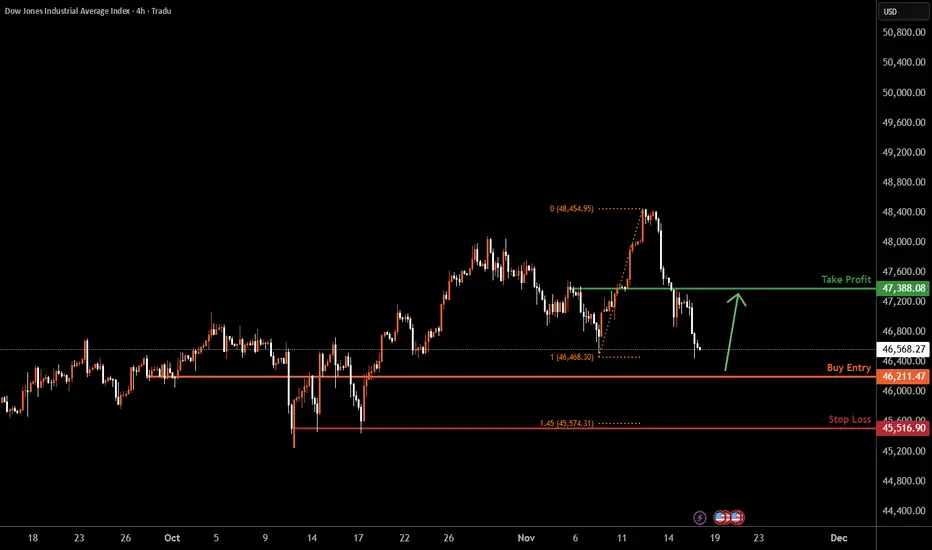
US30 H4 | Bullish Reversal SetupMomentum: Bullish
The price is currently retracing toward the buy entry, which aligns with a key pullback support level.
Buy Entry: 46,211.47
Pullback support
Stop Loss: 45,516.00
Multi swing-low support
145% Fibonacci extension
Take Profit: 47,388.08
Pullback resistance
High Risk Investment Wa
US30: Growth & Bullish Continuation
The price of US30 will most likely increase soon enough, due to the demand beginning to exceed supply which we can see by looking at the chart of the pair.
Disclosure: I am part of Trade Nation's Influencer program and receive a monthly fee for using their TradingView charts in my analysis.
❤️

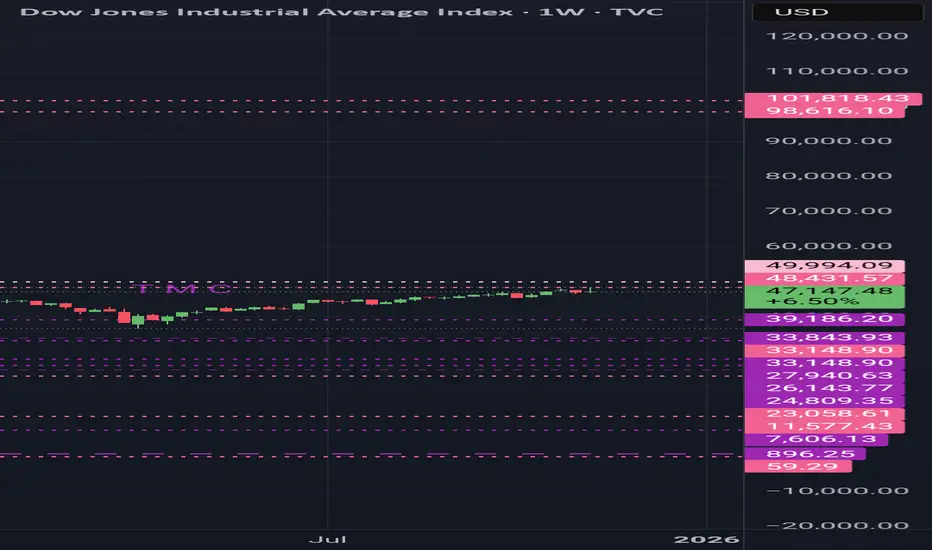
DECODED Technical Analysis DJI (DOW JONES)DECODED Technical Analysis DJI (DOW JONES)
What a remarkable historical chart
DJI, in its yearly first complete grand pattern, faces strong resistance at $48,431, the previous high, and $49,994, signaling a potential reversal. If not, corrections are at $33,843, $33,148, $27,940, $26,143, and $24,
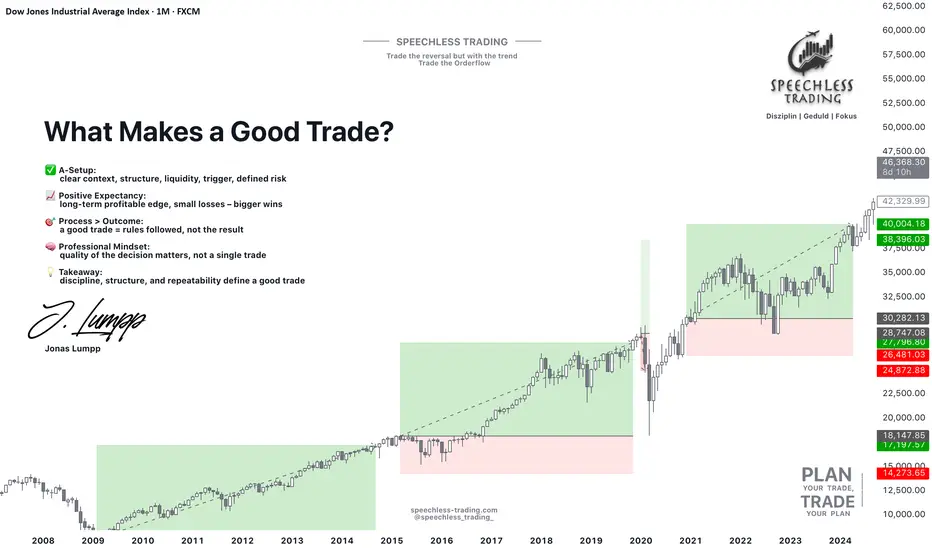
The Anatomy of a Good Trade: Focus on Decisions, Not ResultsLet's find out - what is a good trade?
Most beginners answer: a trade that makes money.
But in professional trading, a good trade has nothing to do with the outcome.
It has everything to do with the quality of the decision.
1️⃣ A good trade starts with an A-Setup:
An A-Setup is not a feeling — it’s
See all ideas
Summarizing what the indicators are suggesting.
Oscillators
Neutral
SellBuy
Strong sellStrong buy
Strong sellSellNeutralBuyStrong buy
Oscillators
Neutral
SellBuy
Strong sellStrong buy
Strong sellSellNeutralBuyStrong buy
Summary
Neutral
SellBuy
Strong sellStrong buy
Strong sellSellNeutralBuyStrong buy
Summary
Neutral
SellBuy
Strong sellStrong buy
Strong sellSellNeutralBuyStrong buy
Summary
Neutral
SellBuy
Strong sellStrong buy
Strong sellSellNeutralBuyStrong buy
Moving Averages
Neutral
SellBuy
Strong sellStrong buy
Strong sellSellNeutralBuyStrong buy
Moving Averages
Neutral
SellBuy
Strong sellStrong buy
Strong sellSellNeutralBuyStrong buy
Displays a symbol's price movements over previous years to identify recurring trends.
Frequently Asked Questions
The current value of Dow Jones Industrial Average Index is 46,245.41 USD — it has risen by 1.08% in the past 24 hours. Track the index more closely on the Dow Jones Industrial Average Index chart.
Dow Jones Industrial Average Index reached its highest quote on Nov 12, 2025 — 48,431.57 USD. See more data on the Dow Jones Industrial Average Index chart.
The lowest ever quote of Dow Jones Industrial Average Index is 28.48 USD. It was reached on Aug 8, 1896. See more data on the Dow Jones Industrial Average Index chart.
Dow Jones Industrial Average Index value has decreased by −2.07% in the past week, since last month it has shown a −1.48% decrease, and over the year it's increased by 6.22%. Keep track of all changes on the Dow Jones Industrial Average Index chart.
The top companies of Dow Jones Industrial Average Index are NASDAQ:NVDA, NASDAQ:AAPL, and NASDAQ:MSFT — they can boast market cap of 4.35 T USD, 4.01 T USD, and 3.51 T USD accordingly.
The highest-priced instruments on Dow Jones Industrial Average Index are NYSE:GS, NYSE:CAT, and NASDAQ:MSFT — they'll cost you 774.03 USD, 550.43 USD, and 472.12 USD accordingly.
The champion of Dow Jones Industrial Average Index is NYSE:CAT — it's gained 43.37% over the year.
The weakest component of Dow Jones Industrial Average Index is NYSE:UNH — it's lost −46.67% over the year.
Dow Jones Industrial Average Index is just a number that lets you track performance of the instruments comprising the index, so you can't invest in it directly. But you can buy Dow Jones Industrial Average Index futures or funds or invest in its components.
The Dow Jones Industrial Average Index is comprised of 30 instruments including NASDAQ:NVDA, NASDAQ:AAPL, NASDAQ:MSFT and others. See the full list of Dow Jones Industrial Average Index components to find more opportunities.