What Was Important for the US Dollar Index (DXY) This WeekWhat Was Important for the US Dollar Index (DXY) This Week
The long-awaited event — the Fed’s first rate cut of 2025 — has taken place. What is particularly important to note is the price action on the US Dollar Index (DXY) chart.
The value of the USD against a basket of other currencies made a two-step move, forming a pin-bar candle with a long lower shadow:
→ Arrow 1: When the Fed actually announced the easing, the dollar weakened as expected on this “dovish news.”
→ Arrow 2: But at the subsequent press conference, Fed Chair Jerome Powell delivered a series of “hawkish” remarks that shifted the market mood and drove the dollar higher. He stressed that this cut does not mark the beginning of “a series of continuous rate reductions,” and that further decisions will be taken “based on incoming economic data.”
Powell also stated plainly that the option of a more aggressive 50-basis-point cut had not gained sufficient support among FOMC members. Therefore, the “down-then-up” move highlights a sharp change in trader sentiment within a short timeframe, as expectations failed to materialise.
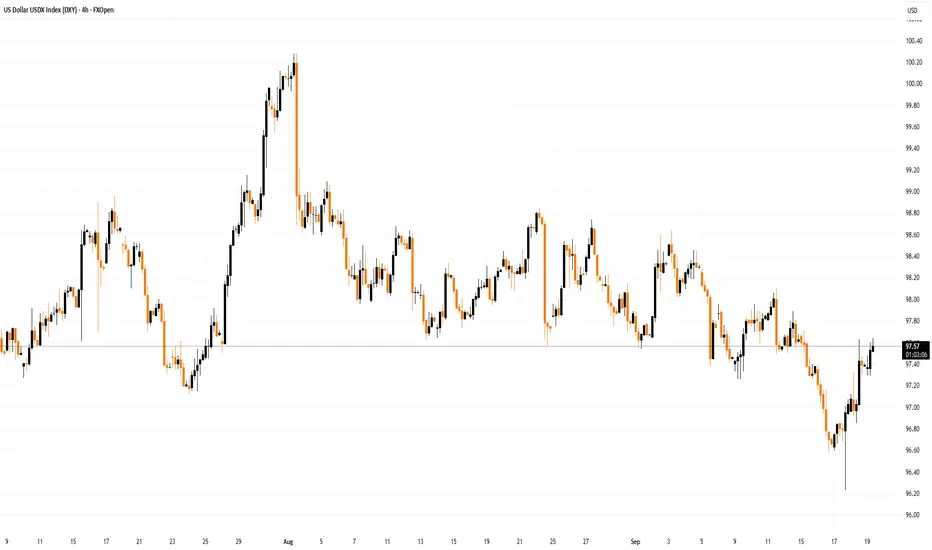
Technical Analysis of the DXY Chart
In our 9 September analysis, we confirmed the relevance of:
→ the descending channel (shown in red) defined by a sequence of lower highs and lower lows;
→ the intermediate QL and QH lines, which divide the channel into quarters.
Notably, at Wednesday’s low the price:
→ touched the QL line, underscoring its strength;
→ formed a clear Liquidity Grab pattern (in the terminology of the Smart Money Concept methodology).
From the perspective of Richard Wyckoff’s method, Wednesday’s low may be viewed as a Spring pattern, which preceded a Mark-Up phase of rising prices.
How Might Events Unfold Next?
Given the above, we could assume that the hawkish tone could serve as a longer-term factor for the DXY index. The 97.55 level appears to act as resistance, but it is possible that we may see an attempt to break through it, with the next target being the QH line.
This article represents the opinion of the Companies operating under the FXOpen brand only. It is not to be construed as an offer, solicitation, or recommendation with respect to products and services provided by the Companies operating under the FXOpen brand, nor is it to be considered financial advice.
Trade ideas
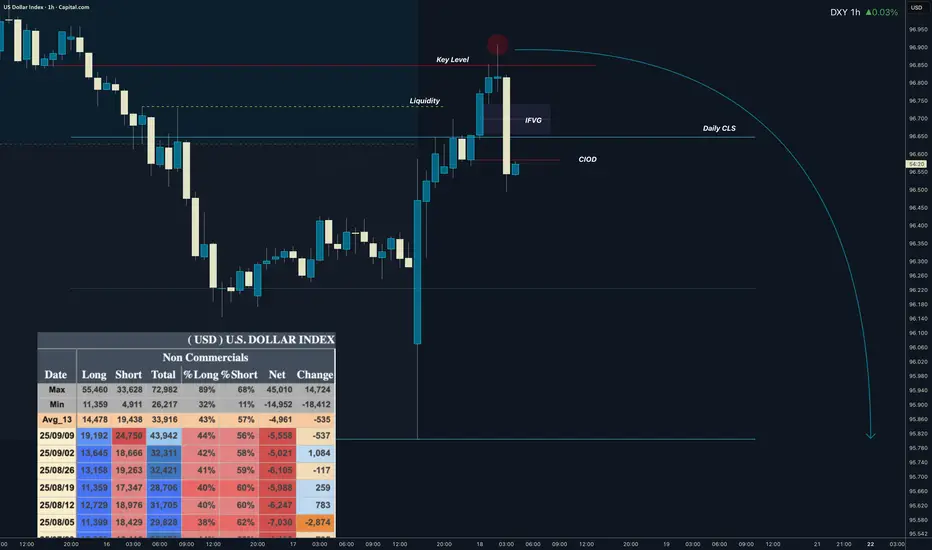
Dollar - Daily Range I Liqudity I Key Level - ShortDollar has reached key level after whipsaw move on FOMC. It also grabbed liqudity and COT is still bearish while HTF Key Level on lower prices. Hence I think new low is in play.
Trading is like a sport. If you consistently practice you can learn it.
“Adapt what is useful. Reject whats useless and add whats is specifically yours.”
David Perk aka Dave FX Hunter
💬 Don't hesitate to ask any questions or share your opinions
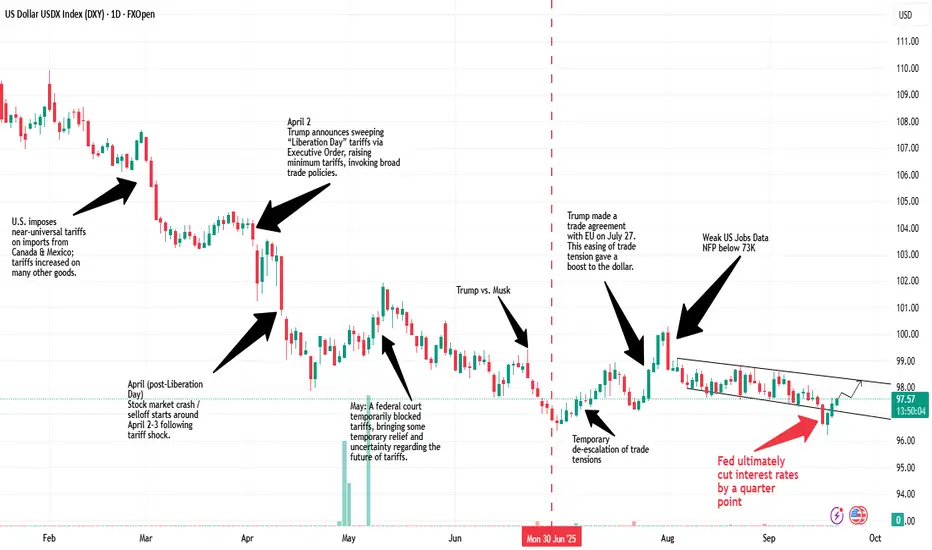
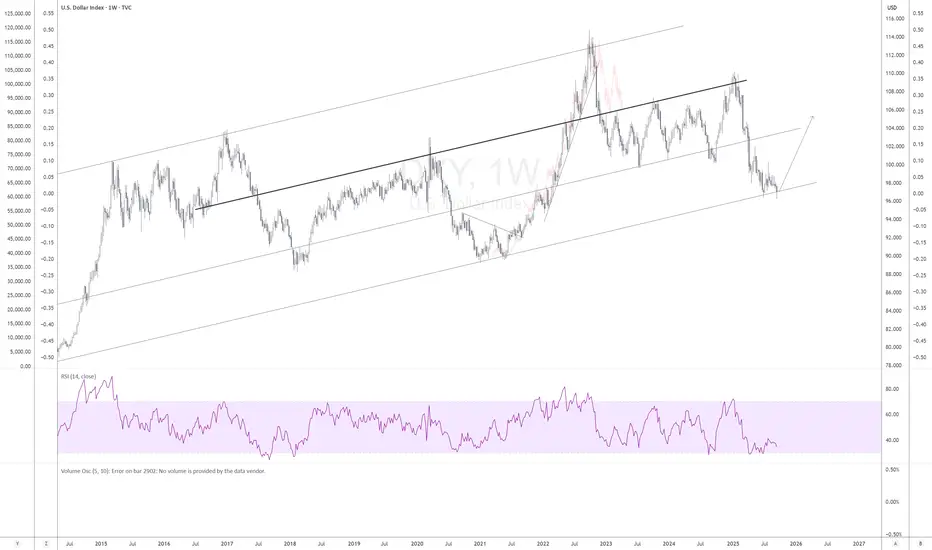
US Dollar Timeline: How Dollar is getting Destroyed Gradually The US Dollar Timeline: 2025
- The Dollar Index (DXY) has consistently weakened this year
- It fell more than 12.5% from the tops of 110 (Jan 2025) to the bottoms of 96.20, tested recently after Fed rate cuts.
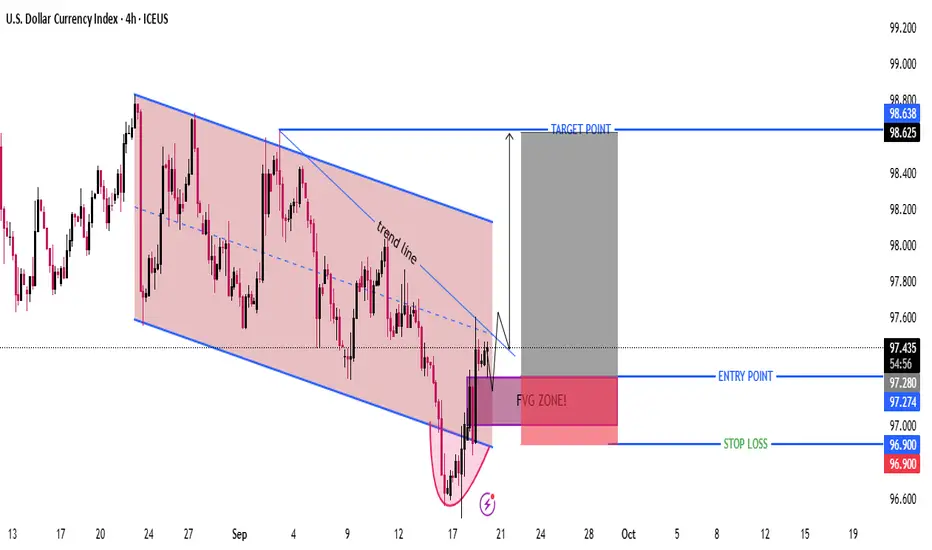
DXY 4H – Bullish Reversal Setup from FVG Zone | Target 98.63Technical Analysis
Downtrend Channel (Bearish Structure)
Price has been moving inside a descending channel (highlighted in red).
Recently, it touched the lower boundary and formed a rounded bottom pattern (possible reversal signal).
Trendline Breakout
A short-term downtrend line has been broken to the upside.
This suggests momentum is shifting from bearish to bullish.
Fair Value Gap (FVG Zone)
Price is currently testing an FVG zone around 97.00–97.28.
This zone acts as a potential entry area for long trades.
Entry, Stop Loss, and Target
Entry Point: 97.28 – 97.27
Stop Loss: 96.90 (below FVG zone support)
Target Point: 98.63
Risk–Reward Ratio: Approximately 1:3 → good setup.
Potential Scenario
If price holds above the FVG zone and doesn’t break below 96.90, we may see a bullish move toward 98.63.
But if the FVG fails and price closes below 96.90, it could resume the downtrend.
✅ Summary:
Market structure shows a possible bullish reversal after a prolonged downtrend.
A clean long setup is planned: Buy near 97.27 → Stop 96.90 → Target 98.63.
Confirmation needed: Strong bullish candle closing above the FVG zone
Dollar Weekly WrapThe dollar ripped to fresh lows early in the week on the FOMC spark and is now set to close with a heavy bearish rejection candle.
Next week’s macro stack:
Tue – U.S. PMI flash
Thu – Q2 GDP final and Durable Goods
Fri – Personal Income/Spending and PCE
Price sits just below a five-week liquidity shelf around the 98.00 area.
Technically the market is oversold near the lower range, so high probability to target next week 98ich highs and lower on cross pairs. lets see how it will play out!

Dollar Bloodbath = Risk On Assets Rally?Dollar Fundamentals:
The dollar posted modest gains on Friday due to higher T-note yields, which have strengthened the dollar’s interest rate differentials.
The University of Michigan US Sep consumer sentiment index fell more than expected to a 4-month low causing the weakening of the dollar.
Limiting the upside in the dollar are the increased expectations for Fed easing through year-end. The dollar is also being undercut by concerns over Fed independence, which could prompt foreign investors to dump dollar assets as President Trump attempts to fire Fed Governor Cook, and by Stephen Miran’s intention to be a Fed Governor.
What Can We Expect Going Forward?
- Due To High Resistance Over Multiple Weeks, There Will Be Massive Levels Volatility, Aiming To Trap The Retail Traders
- Next Week Wednesday Will Determine How Volatile Dollar Will Be. Anything More Than A .25 Basis Point Decline Will Cause Turmoil For Dollar.
- This Will Lead Risk-On Assets (e.g. GBPUSD, EURUSD, AUDUSD) Rallying Up Into Premium Arrays
Prices To Keep An Eye On:
- 99.078 (Last Line Of Defence)
- 96.377 Major Sellside Liquidity
- Medium-Term Draw To 95.716 - 94.313 HTF Array
GBPUSD
Fundamentals :
UK gross domestic product remained unchanged in July after growing 0.4% in June, the Office for National Statistics said, as manufacturing output, which makes up 9% of the economy, dropped by 1.3% on the month.
The BoE is widely expected to keep its benchmark Bank Rate unchanged on September 18, after a split decision to lower the rate to 4% in August.
What To Expect Going Into Next Week?
- Increased Volatility
- Trigger HTF Stop Losses
- Unusually High Levels Of Manipulation
Price Points To Keep A Eye On:
- 1.35950 Buyside Liquidity
- 1.36760 - 1.37036 Longer Term Premium Array
- 1.34458 Mean Threshold (Last Line Of Defence)


DOLLAR/GOLD/RATESDXY is sitting at a key monthly support.
Gold is getting extremely hot.
is it time for a flip? majority sentiment feels like gold is going up forever (i agree to an extent, but im not against some pullback/higher lows first)
FED mentioned inflation was a bit sticky.
sharing purely to see how she ages
GOLD = red
DXY = BLUE/BLACK


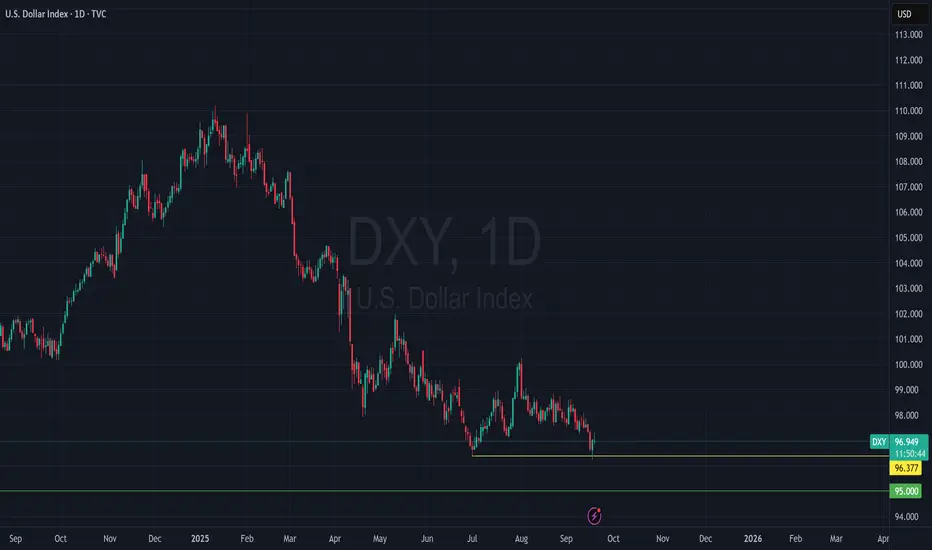
DXY bottom in sightThe short DXY trade is so crowed right now a bottom should be forming soon. 99% of people expect the $$ to keep plunging in the coming quarters. It won't. Good times to hedge your bets if you're on the consensus train
The dollar making fresh yearly lows for the FedThe dollar making fresh yearly lows yesterday for the Fed decision. 95 looks close. At some point the dollar will be on sale. Last time Trump was elected the dollar went on sale in early 2018 after a year of selling off. Will the dollar be on sale next year?
DXY (LONG)
After Fomc seeing Dollar bulls across all pairs and dollar is sitting on Pivots support Level
correlating with GOLD AND GBPUSD Sitting on Pivot resstance Levels.

Bearish reversal off pullback resistanceUS Dollar Index (DXY) is rising towards the pivot which acts as a pullback resistance and could reverse to the 1st support.
Pivot: 97.36
1st Support: 96.47
1st Resistance: 98.12
Disclaimer:
The above opinions given constitute general market commentary, and do not constitute the opinion or advice of IC Markets or any form of personal or investment advice.
Any opinions, news, research, analyses, prices, other information, or links to third-party sites contained on this website are provided on an "as-is" basis, are intended only to be informative, is not an advice nor a recommendation, nor research, or a record of our trading prices, or an offer of, or solicitation for a transaction in any financial instrument and thus should not be treated as such. The information provided does not involve any specific investment objectives, financial situation and needs of any specific person who may receive it. Please be aware, that past performance is not a reliable indicator of future performance and/or results. Past Performance or Forward-looking scenarios based upon the reasonable beliefs of the third-party provider are not a guarantee of future performance. Actual results may differ materially from those anticipated in forward-looking or past performance statements. IC Markets makes no representation or warranty and assumes no liability as to the accuracy or completeness of the information provided, nor any loss arising from any investment based on a recommendation, forecast or any information supplied by any third-party.

DXYDXY maintains a bearish bias, trading below last week’s open and confirming weakness with a series of lower highs and lower lows. Commitment of Traders (COT) data shows non-commercial traders reducing long positions and adding to shorts, reinforcing the downside outlook. As long as price holds beneath the current week open, bearish momentum is expected to persist, with any rallies into resistance or supply zones offering opportunities to align with the prevailing trend.

DOLLAR DOLLAR holding daily retest demand floor waiting FOMC outcome. The market will be surprised that fed might keep rate the same dont expect rate cut.
how ever i dont care about the FOMC policy outcome

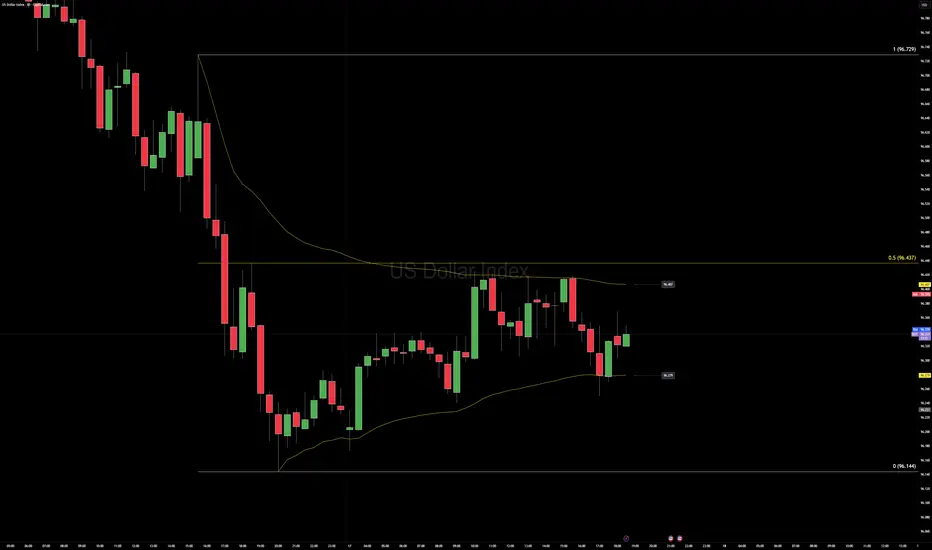
Dollar Index (DXY) – Pre-FOMC Rangebound PlayPrice is boxed between 96.20 and 96.40 as market makers build volume on both sides ahead of the Fed.
Key Levels
• 96.40 – top of the current node, first spot for squeeze fuel.
• 96.20 – base of the range, stop pockets just beneath.
Until the statement drops, expect tight, whipsaw action—classic pre-FOMC positioning. Patience over prediction.
US Dollar Index - Looking To Sell Pullbacks In The Short TermM15 - Strong bearish move.
No opposite signs.
Currently it looks like a pullback is happening.
Expecting bearish continuation until the two Fibonacci resistance zones hold.
If you enjoy this idea, don’t forget to LIKE 👍, FOLLOW ✅, SHARE 🙌, and COMMENT ✍! Drop your thoughts and charts below to keep the discussion going. Your support helps keep this content free and reach more people! 🚀
-------------------------------------------------------------------------------------------------------------------

DOLLARDOLLAR AT 96267 rebound ,uncertainty in the market rate hike or cut.
united state dollar remains a key market driver and we have seen eurusd ,audusd gbpusd and gold reverse on dollar day support floor buy opportunity.
#dollar #dxy

USD Index Technical Outlook – Key Buy & Sell LevelsThe U.S. Dollar Index (DXY) is currently trading inside a clear downward channel, showing a bearish market structure. Price is hovering near 98.23, just below the key resistance zone between 98.5 – 99.2, where Fibonacci retracement levels (0.382, 0.5, and 0.618) also align, making it a strong supply area. As long as price remains below this zone, the bias stays bearish, with potential downside targets at 97.5 and then 96.5, in line with the channel support and Fibonacci extensions. However, if buyers manage to push above 99.2, it would signal a possible trend reversal and shift the outlook towards bullish continuation. Overall, the structure suggests that the U.S. Dollar Index is more likely to face rejection near resistance and continue lower in the short term.
🔴 Sell Zone (Short Setup)
- 98.50 – 99.20 is a strong resistance area where price aligns with the Fibonacci retracement (0.382 – 0.618) and the upper channel trendline.
- Sell Trigger: If price shows rejection (bearish candles, wicks, or reversal patterns) within this zone.
🟢 Buy Zone (Long Setup)
- 97.50 – 96.50 area is the channel support and also near Fibonacci extension levels.
- Buy Trigger: Look for bullish confirmation (bounce, bullish engulfing, or rejection wicks).
Note
Please risk management in trading is a Key so use your money accordingly. If you like the idea then please like and boost. Thank you and Good Luck!

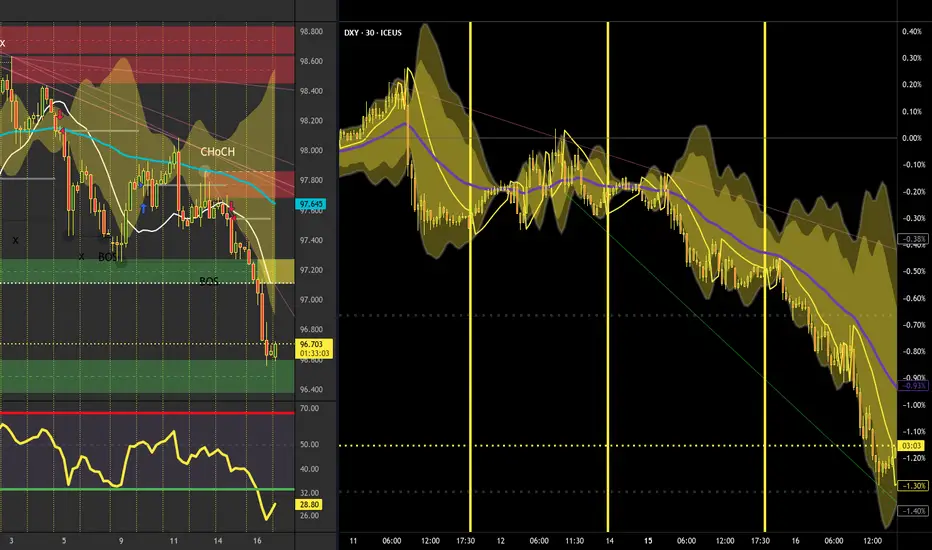
DXY vs. EURUSD – Pre-FOMC DivergenceDollar Index (DXY)
Yesterday’s move was fully absorbed inside a tight range, leaving the internal range high at 99.804 ahead of the Fed meeting.
Liquidity is at 98.00 stacked above that zone; market makers could easily run the stops toward the 98 handle before any larger downside move.
EURUSD
Meanwhile, EURUSD broke out of its major range, giving us a new weekly structure with a key reference low at 1.13914.
Cross-Market View
This sets up a classic divergence:
Dollar – trapped in a premium sell range, heavy liquidity overhead.
Euro – fresh upside structure.
For cross-pairs this often means sharp pullbacks or erratic price action as we approach the FOMC decision.
Trade Notes
Stay nimble and keep stops tight.

Weekly Review: Dollar Weakness, Equities Rally, Crypto at resis'Abstract
This week’s market action painted a consistent story: the dollar fell hard, global yields softened, and equities rallied toward resistance.
Meanwhile, commodities (oil, gold, copper) strengthened, supporting a reflationary tone. The main caution flag: volatility gauges (VIX & VVIX) are rising, hinting that this risk‑on rally might not be bullet‑proof.
In crypto, BTC and ETH tested overhead resistance with weak volume — optimism is there, but conviction is not.
🚨 Special Focus: September 17th Fed Cut
The Federal Reserve’s September 17th policy decision is the most important catalyst this week. A rate cut at 2 PM EST has direct and immediate implications for all the moves outlined below:
Dollar Impact: Cuts weaken the dollar further, amplifying this week’s oversold DXY.
Yields: A cut locks in the recent fall in bond yields, making equities and gold more attractive.
Equities: Would justify current rallies but also risks looking like “policy panic”, which can spur volatility.
Commodities: Oil and Gold respond positively to looser policy → reflation + hedging.
Crypto: Historically benefits from Fed easing, but watch if BTC can actually break resistance when liquidity improves.
Interpretation: September 17th could either validate the risk‑on rally, or reverse it sharply if markets fear the Fed is cutting because economic weakness is worse than expected. Traders should mark 2 PM EST as a volatility event across Dollar, Yields, Equities, Commodities, and Crypto.
👉 Chart reference: US10Y
1. Dollar & FX: Oversold Break
DXY dropped to ~96.6, oversold on RSI (26) after repeated breaks of structure.
EURUSD surged past 1.18, entering overbought momentum.
USDJPY and USDCAD both slipped lower, aligning with dollar weakness.
USDINR weakened to 88.0 → 87.85 POI, showing INR strength matched with NIFTY breakout.
Interpretation: The dollar is oversold and losing momentum — normally bullish for risk assets. But extreme RSI means a technical bounce is possible.
👉 Chart here: DXY / EURUSD
2. Yields: Relief for Equities
US10Y at 4.03%, US30Y at 4.65% — both off highs, easing pressure on stocks.
CA10Y fell to 3.16%, tailwind for CAD and TSX.
IN10Y steady ~6.49%, supportive backdrop for India.
Interpretation: Lower yields = fresh air for equities. Bonds validating a mild risk‑on bias.
👉 Chart here: US10Y / Global Yields
3. U.S. Equities: Bulls in Control
S&P 500 at 6607, up ~2.9% this week, testing resistance.
Nasdaq 100 jumped 3.5%, now overbought on RSI.
Dow Jones up 1.7%, steady breadth support.
Interpretation: U.S. indices are riding the yield drop, but now pressing major resistance zones. Easy money for bulls is fading — the next leg requires stronger conviction.
👉 Chart here: SPX (NDX and DJI showing similar characteristic on their respective charts)
4. Global Equities: India & Canada Stand Out
NIFTY broke to 25,239, clean resistance breakout, INR strength aligned.
TSX surged 3.7% with oil, CAD, and yields falling in sync.
EuroStoxx (SX5E) consolidated flat — showing Europe still lagging.
Interpretation: The best relative strength came from India and Canada. Europe lagged, lacking energy leverage.
👉 Chart here: NIFTY / TSX
5. Commodities: Reflation Pulse
Oil climbed to $64.6, breaking resistance.
Gold at $3695 (+2.6%), safe‑haven demand still alive.
Copper to $4.70, break higher supportive for growth assets.
Interpretation: Energy and metals are supporting the equity rally. Gold rising alongside = investors hedging tail risk too.
👉 Chart here: Oil / Gold
6. Volatility: Under the Hood
VIX back up to 16.4, rising after being crushed.
VVIX surged to 104, volatility of vol is warning of unstable positioning.
IndiaVIX collapsed below 11, reflecting too much complacency locally.
Interpretation: While equities scream “bull!”, vol warns risk management is key. This is not free money.
👉 Chart here: VIX
7. Crypto: Resistance Check
BTC at 116.6k and ETH at 4.5k: both testing resistance with weak volumes.
BNB surged +5.7%, outperformed majors.
SOL held above 228–236, neutral bias.
XRP stuck near 3.0, chopping sideways.
Interpretation: Trend is up in sympathy with equities, but risk of rejection at resistance is very real. Without stronger volumes, crypto remains a “show me” trade.
👉 Chart here: BTC
💡 Big Picture Takeaway
Dollar tanking = equity and commodity rally fuel.
Yields easing = confirms risk‑on conditions.
Equities at resistance with rising vol = bulls in control, but fragility building.
Crypto is lagging in volume — it benefits from macro tailwind but not leading.
Best relative strength: NIFTY, TSX, Oil, Gold.
Fed rate cut on Sep 17 = the true decision point for trend continuation or reversal.
🎯 Conclusion — Risk‑On, But Fed Holds the Key
Markets rewarded risk this week as the dollar collapsed and yields faded. But overbought equities, crypto resistances, and rising volatility gauges warn that the move is not bullet‑proof.
The September 17th Fed cut at 2 PM is the ultimate test. If the cut is seen as proactive stimulus, the rally has room to extend. If it’s read as a panic signal, what looks like risk‑on could swiftly unwind.
✅ Bias for the coming week: constructive risk‑on until the Fed cut, then stand ready for sharp volatility.
📌 For traders: Buy dips in leaders (NIFTY, TSX, commodities) before the Fed — reduce leverage into decision. For investors: Stay allocated with hedges in vol and gold.
ICEUS:DXY FX_IDC:USDINR CMCMARKETS:USDCAD CMCMARKETS:EURUSD TVC:US10Y CBOE:SPX NASDAQ:NDX DJ:DJI NSE:NIFTY TSX:TSX TVC:SX5E NYMEX:CL1! OANDA:XAUUSD TVC:VIX CRYPTO:BTCUSD
dxy-1Ddollar index has a bearish gaurd to close it's cycle and sweep the liquidities to provide its fuel to form new HHs...
