Gold and silver break records: what is behind the price increaseTVC:GOLD TVC:SILVER
Gold recently broke historical records, exceeding $3,850 per ounce, and silver later followed suit, reaching a maximum of $47 per troy ounce.
At first glance, it may seem that this is a signal for investors to urgently increase the share of precious metals in their portfolios in order to profit from the growth. But let's take a closer look at what is behind this increase and what risks this story entails.
Reasons for the gold rush
First and foremost, this rise in gold prices is linked to geopolitical tensions, particularly the situation where the world is beginning to divide into “risk zones” and “stability zones”. Amid such instability, it is not surprising that central banks and investors are looking for reliable assets, and gold is still a classic “safe haven.”
Another reason for the rise in gold is the decline in interest rates, which the market is actually underestimating. The history of the last hundred years shows that gold rises steadily when interest rates fall. And given that Trump continues to put pressure on the Fed, it is quite likely that they may be lowered again, thereby creating even more favorable conditions for the metal. Add to this rising inflation, and it is safe to say that this will only push gold prices higher. As a result, the forecast of $3,900 per ounce in the third quarter may well become a reality.
The current trade wars, which are worsening the economic situation around the world, are adding fuel to the fire. Because of these conflicts, fiat currencies such as the dollar are constantly losing position. And as soon as the US currency begins to decline in value, gold begins to rise in price — not so much in itself, but relative to the depreciating currency.
As for production, this factor is not currently key to the growth of gold. It is clear that a serious redistribution of spheres of influence is taking place in Africa, and it seems that this will only get worse. Therefore, while we are seeing geopolitical divisions in Europe, Africa is gradually transforming from a problem region into a zone of high instability, which makes owning assets there riskier and gold even more expensive.
Silver – betting on production
Silver, in turn, is becoming more expensive for completely different reasons. If gold is considered a barometer of crises, silver is more tied to progress in industry. Electric cars, batteries, solar panels, electronics – silver is needed everywhere.
However, it is important to maintain a sober view here, as the potential for a sharp increase in the price of silver is very limited. The market for electric cars and batteries is already largely saturated, and new technological breakthroughs are still only on the horizon. Silver is also strongly linked to the state of the global economy, which, in turn, leaves much to be desired. As a result, the volatility of silver prices can be 2-3 times higher than the gold prices. In addition, the influence of the US on global supply chains makes any forecasts for silver highly unreliable.
How to invest in these metals?
When it comes to buying physical gold, it is more suitable for collectors or people from countries where gold has special significance, such as India, China, or Arabic countries. But buying it to store at home or elsewhere does not make much sense due to the high cost of storage. The same applies to silver: it can be purchased in physical form, but silver coins are often more expensive than the spot price of the metal due to production and distribution markups. And again, storage and even insurance costs should be taken into account.
Therefore, it is more rational to consider both gold and silver through the exchange. There are three main ways to invest. The first one is gold and silver ETFs. This is the most convenient and accessible option, suitable even for beginners, as there are many large and reliable securities with different terms and conditions. The only downside is that investing in ETFs does not give investors direct access to these metals.
Shares in gold mining companies are also suitable for investing in the yellow metal. With silver, this option can be even more risky and volatile than buying ETFs. Therefore, investors are better off paying attention to gold mining companies such as Newmont NYSE:NEM (USA), Barrick Gold TSX:ABX (Canada), Freeport McMoRan NYSE:FCX (USA), and others. We have already discussed some of them in more detail here. However, to invest in their shares, you need to have a very deep understanding of the market. Despite being linked to gold, the shares are still traded on a stock exchange, whose index can either rise or fall.
The last option is to buy gold and silver futures, for example, on the Chicago Stock Exchange. But this method is even more complicated and is suitable for even more experienced investors.
As a result, whichever investment method investors choose, they need to be careful in any case. Gold, of course, looks attractive and can strengthen a portfolio amid falling interest rates and a weakening dollar. But it is worth increasing your share gradually, as record prices are usually followed by a correction. Silver has the potential to grow a little more, but we shouldn’t expect too much from it.
GOLDSILVER trade ideas
Capture Relative Moves: Gold vs. Silver
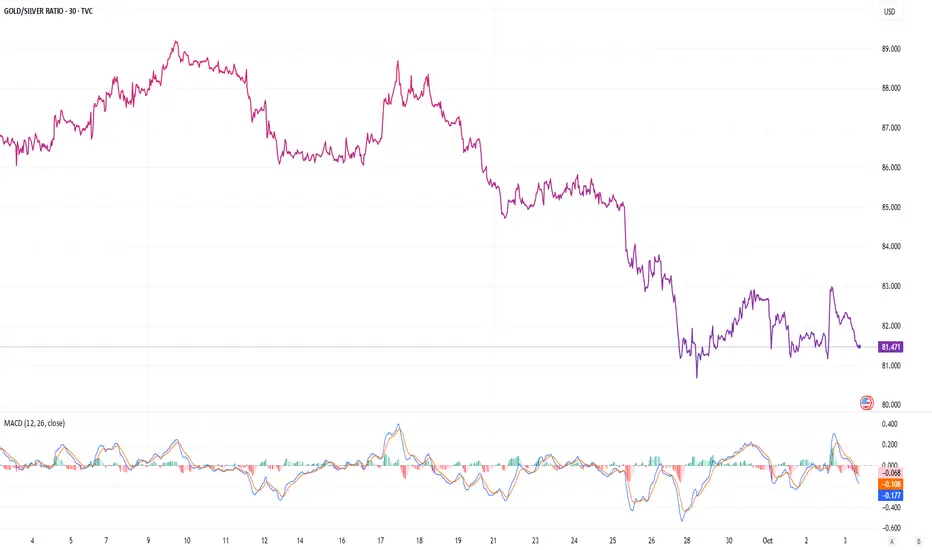
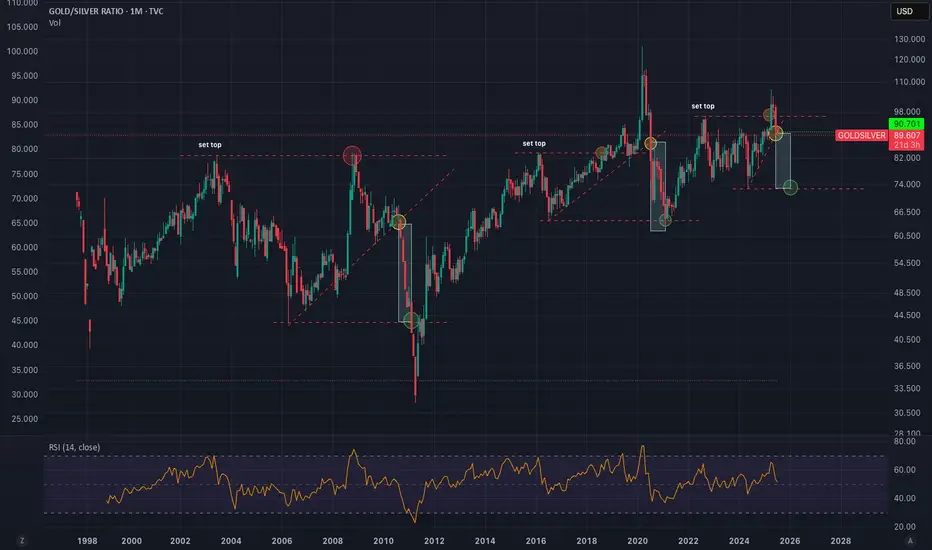
The gold-to-silver ratio is trading around 81. Although that’s already a decline, it previously fell to around 64 in 2021 and 2016, and even to 31 in 2011. Each time the ratio drops, it typically marks a peak in silver prices during an uptrend.
Therefore, now is just the beginning of a new down-cycle in the ratio. (Usually, the ratio decreases when precious-metal prices rise.)
Over the past decade, the gold-to-silver ratio has mostly ranged between 40:1 and 80:1. Readings above ~80 often imply silver is undervalued relative to gold, while below ~40 can suggest gold is undervalued.
Looking back about a century, the ratio was frequently anchored near 16:1 under bimetallic standards, though it has varied over time.
Beyond gold’s monetary/jewelry premium, a key driver of silver’s lower price per troy ounce is supply: annual silver mine output is typically 6–14× that of gold, depending on the year.
In any case, the current ratio of around 80 is considered high.
How to use the ratio effectively
Many investors treat it as a rotation signal between gold and silver. A common approach: buy silver when the ratio is high (typically ≥80:1) and buy gold when the ratio is low (thresholds depend on your preferred lookback).
For illustration: with gold near 3,900 USD per troy ounce, a move in the ratio to 40:1 would imply silver around 97.5 USD per troy ounce (≈double today’s level).
You can also construct a synthetic spread by pairing the two: long silver (XAGUSD) and short gold (XAUUSD) for equal notional value. It’s crucial to match contract size on both legs and rebalance when prices move beyond your tolerance.
Analysis by: Krisada Yoonaisil, Financial Markets Strategist at Exness
GOLDSIL LongThe likelihood of the GoldSilver bat breaking out of the wedge formed by the drawn trendlines suggests a potential increase in the index in the future.

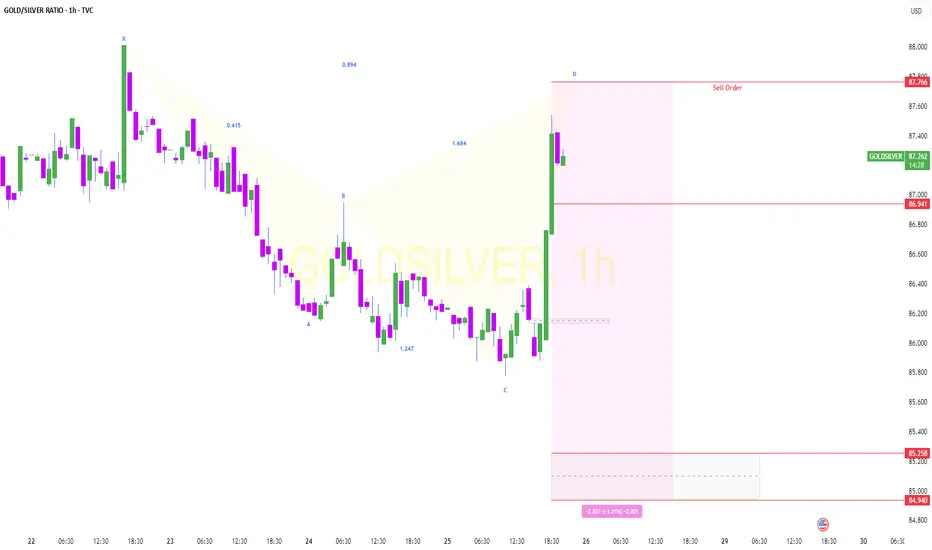
GOLDSILVER Short .GOLDSILVER Index may fall from 87.77 towards target (order block zone), based on shark pattern.
Gold/Silver Ratio to 72 Minimum - Imminent Silver BreakoutGoldSilver Ratio is following a clear pattern of behavior. We can expect a return to mean conservatively hitting 72 at a minimum. This puts silver at $46-58 if Gold doesn't move higher. I think we will see silver 5-10X over the next few years. Easy 25-50% in the short term (6-12 months).
GSR Update July 8th 2025I am expecting the GSR to return to the medium doted line in the near future with the divergence of the short term FIB time zone 3 coinciding with the long term FIB time zone 3. This will bring the silver chart at the bottom up closer to the medium dotted line. Fingers Crossed!

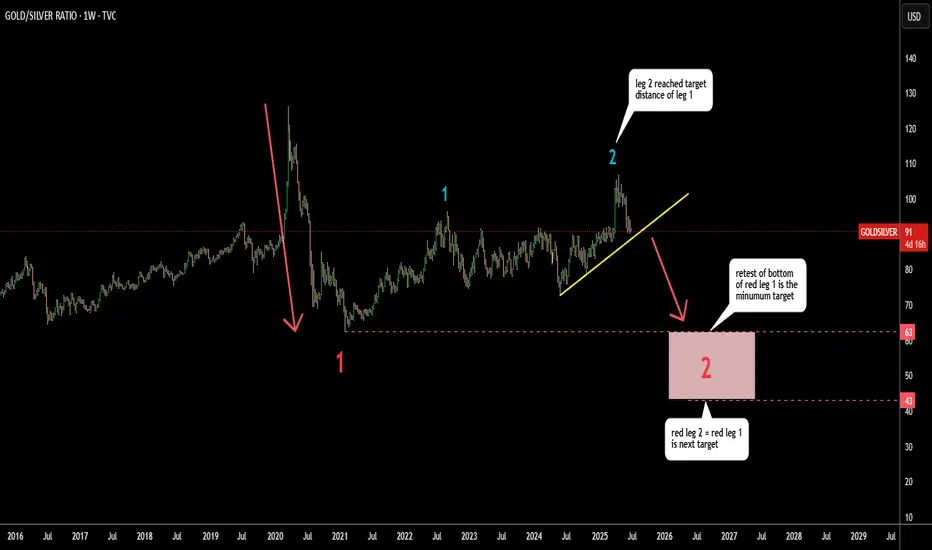
GOLD/SIlver Ratio Signals Risk On Gold/Silver ratio represents the appetite for risk
Stronger gold means risk off and vice versa
In spring, the ratio had hit the target for leg 2 (blue) within
large consolidation that took over 4 years to emerge
It travelled the equal distance of leg 1 (blue) and then reversed.
The next step might be the continuation to the downside for the ratio.
The minimum target is to hit the bottom of red leg 1 at 63.
The next target is located at the distance of the red leg 1 subtracted from the peak of blue leg 2. It was set at 43.
Both downside targets are within historical range.
Gold/Copper ratio shows same dynamics of "Risk-On" attitude on the market.
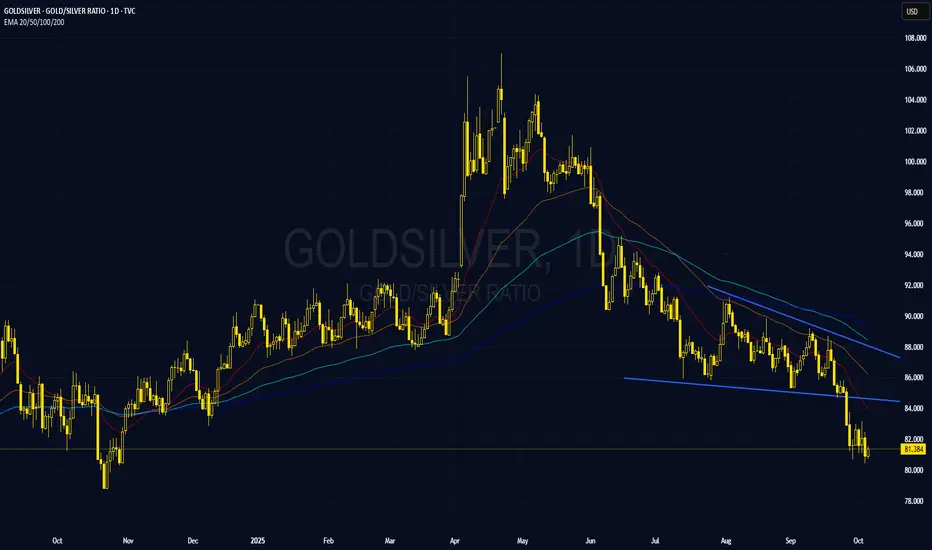
3-Year Range Broken — Gold/Silver Ratio Retesting Critical ZoneContext:
For more than three years, the Gold/Silver ratio traded within a predictable range between approximately 79 and 92. This provided consistent opportunities to rotate between metals: buying Gold when the ratio approached the bottom of the range, and favoring Silver when Gold became relatively expensive near the top.
Breakout and Failure:
In March 2025, the ratio broke out sharply above the 92 ceiling, reaching above 105 for the first time in years. This breakout was driven by macro uncertainty and a surge in demand for Gold as a safe haven. However, the move quickly lost momentum. As risk appetite returned and macro concerns faded, the ratio dropped aggressively, falling back below the former breakout zone.
Current Setup:
Price is now testing the 90–92 region — the same area that acted as resistance for years. This zone is now functioning as key structural support. Its behavior here could determine the next major leg.
Trading Outlook:
If the ratio holds above 90, Gold may continue to outperform Silver, possibly establishing a new higher range between 90 and 105. However, a decisive break below 90 would indicate a failed breakout and may favor Silver strength, with downside potential back toward the 80–85 area.
Conclusion:
This is a technically critical zone. A confirmed hold or breakdown from here could define the next multi-week trend in the precious metals space.

Gold Silver trade updateHello,
So, the case remains unchanged; buy silver when the gold to silver ratio is above 80:1. But, now silver is out-performing gold significantly and the ratio is strongly trending towards a lower gold to silver ratio.
If the previous steep drop is extended from the recent high, then it could imply a G:S ratio of around 45:1, which is;
- right in my buy-zone (that would be a dream come true),
- looking more and more likely.
Luckily, I made a significant silver purchase in late May. I was going to buy gold, but with a gold to silver ratio at around 102:1 then, I just couldn't do it. I had to buy silver instead. I have physical silver ETFs and silver miners.
Actually, HYMC Hycroft Gold also did really well last night +14% (I was watching it spike up at market open). I have a position in HYMC. Because;
- It has almost 20Moz in gold equivalent ounces,
- Seems likely to start mining shortly (6 months or a year maybe commencing heap-leach operations while they seek finance for a processing plant),
- They are extremely under-valued. When I bought in I was only paying $4.40 per gold equivalent ounce,
- They have debt issued, but the bulk falls due 1st Dec 2027 - so there is a bit of time to seek additional funding or re-financing,
- It is in a reliable mining-friendly jurisdiction - Nevada,
- They had some ridiculous drill results recently... over 80,000g/ton Ag (yes only 0.2m of that but still) plus other strikes at 20,000, 15,000, and 10,000g/t Ag.
- The large component of silver was a positive for me, because silver is leverage on gold. I want more silver so I can buy more gold in the future.
For me HYMC was a clear "buy" despite discussing it with someone at Sprott, and they weren't positive about it. I hope it doesn't go up too much, because I see HYMC in the tens of dollars in a couple of years time, not in the single digits.

Gold-to-Silver ratio doing the Crab WalkEyes on that golden Crab level for a possible bounce back to 110 ( Target of Previous Idea) .
Precious metals drama never disappoints! 💰✨

Dive into the Wild Waves of Gold and Silver!treasure hunters! Ever feel like the gold and silver markets are like surfing big waves?
The fluctuations in precious metal prices are often likened to the contrasting behaviors of wild crabs; gold prices soar upward, akin to a crab climbing, while silver prices plunge into the depths, reminiscent of a crab diving beneath the waves.
Such dynamics illustrate the volatility and unpredictable nature of the commodities market, where various factors can influence the trajectory of these valuable resources.
Understanding these movements is essential for investors aiming to navigate the complexities of financial markets effectively.

This is the Gold Silver Ratio, FIB Time ZonesThis is my comparison tracking the divergence in the gold and silver prices since 2006 prior to the Global Financial Crisis.
I noticed that both prices in USD and tracking in the same upward channel. I have inserted two FIB time zones that seem to be playing out with a move about to play out here on the 20th April 2025.

Important breakdown in the Gold & Silver ratio !!!This is a heads up that concerns the PM sector as well as all other assets.
An important breakdown just happened in the Gold & Silver ratio. This means precious metals bull resumes and SILVER will now overperform gold !! We are now in back test mode !
For the other asset classses this is good news also, because this breakdown in the ratio signifies the return of (asset) inflation. So this is good for stocks and crypto also.
It remains to be seen whether PM's will outperform stocks. My guess is YES.

Silver still under-valued vs GOLDBased on history, The relative value of gold and silver reverts between the 40:1 ratio and 80:1. Silver is still above 80:1, so IMO is a good buying opportunity, to leverage against gold.
The idea is; hold gold and buy silver above 80:1 ratio and sell silver and buy gold at or below 40:1 ratio. After a cycle, you will end up having twice as much gold as if you just bought gold outright.
If you think that silver cannot make major and quick advances relative to gold... look at 2020. We are just in a holding pattern, if you want confirmation, look for the 80:1 ratio level - that is currently acting as support to give way and for silver (smaller less liquid market) to make quick progress.

G&S ratio rising could be bearish on metals medium termThe G&S ratio is back above resistance (now support) and wants to break out of the bullish wedge in dark rose color.
If that happens, an inverse H&S formation could play out and shoot us up (blue line) to the extension of the rising resistance of the (yellow) bearish rising wedge. This would mean a last hurray spike of the ratio, to touch the apex a last time before falling again.
The final fall of the G&S ratio would then signal the risumption of the bull market and the further collapse in the G&S ratio would signifie a raging bull market for precious metale (both silver and gold - but especially silver).
The bull market in metals is unavoidable with the current macro sitauation. However its resumption could be delaid if this set up plays out.

Gold/Silver Ratio Breakdown Confluence with Higher Silver PriceGold/Silver Ratio Breakdown Confluence with Higher Silver Price

Soon, gold will outperform silverIn this #gold vs. #silver chart, it looks like #xauusd will bounce soon against #xagusd in short term.

Gold/Silver Ratio Breakdown Traders. A roadmap to help guide you.
The gold to silver ratio is certainly primes to breakdown. It's just a matter of time. Once this is confirmed silver will really start to shine.

Metals bull run has legs - Silver is gaining momentum!The gold-to-silver ratio is a key signal—a roadmap, if you will—showing us where we are in the cycle of precious metals. Gold typically takes the lead, but then, like clockwork, silver catches up, and fast. In recent months, we’re seeing that exact shift—silver is gaining momentum.
We’re entering a phase where silver is primed to outperform over the next several months. The first conservative target? $44.3. But here’s the thing—if BRICS nations decide to step in, if they start stacking silver too, I believe we could be looking at a price much, much higher by the time this move plays out. Buckle up—this could be big.

Time for Silver to Shine? Upside targets.As the apocalypse near and human's need for the shinny rare metal to produce the most soght after silver bullet as they hunt zombies for fun.
the demand for silver will explode.
Target 24
Ultimate target: 6.0
imagine if Gold is at 20,000
lots of love.

GOLD is going to start getting much cheaper in SILVER terms.Gold has been on an absolute tear lately as the de facto U.S. corporate government has been printing and spending FRNs (Federal Reserve Notes) into oblivion. As a result, real money is gaining value against the Federal Reserve's monopoly money. Naturally, those who saw the money devaluation coming have been buying gold to preserve their purchasing power, but silver has been lagging behind, even though it has also been appreciating. Although the price of precious metals is, and will continue to be, on the rise, the price of gold is about to get much cheaper in terms of silver. Instead of buying gold, I believe the best move right now is to buy silver, hold it, and once the exchange rate drops to the 35/45 to 1 area, then exchange your silver for gold.
I believe that in the next year to a year and a half, we will see the price of gold cut in half in silver terms, which means it will take half the silver to buy the same amount of gold, effectively doubling the purchasing power of silver versus gold.
Good luck!

What does gold-silver ratio tell us about precious metals?The gold-silver ratio has reached a key area of resistance between 80.30 to 80. 55 area and has reacted. This comes on the back of a major breakdown below a multi-year bullish trend line back in early May. So far, the ratio has held resistance here, which suggests that silver might be able to outperform gold again. However, it could also mean that both precious metals may be in a correction phase, with gold falling faster than silver
But given the bullish price action we have seen so far this year, I'm leaning more towards the bullish argument for precious metals than bearish. For that reason, the breakdown in the gold-silver ratio makes me remain bullish on silver.
Meanwhile, the grey metal itself has been testing a major area of support around $28.00 to $29.00 in the last few weeks. So far there have not been any major bullish breakthrough with the metal holding inside what appears to be a bull flag pattern or bearish channel.
By Fawad Razaqzada, market analyst at FOREX.com

GOLDSILVER RATIO-BUY strategy Daily chartThe ratio will likely recover back towards 80.0. It has had a sharp push lower, and this caused to form a false bear flag pattern.
Strategy BUY @ 74.0-75.50 area and take profit near 79.75 for now. SL up to the risk appetite
