US100 - BEARISH POSSIBILITYPrice is already bearish in higher timeframe (H4). And is currently creating bearish tendency in the lower timeframes. We can observe a slow support breakout which can be a crucial confirmation of a bearish continuation. This is purely ideas purpose only and should not be used alone to take on a trade. Good profits traders.
Trade ideas

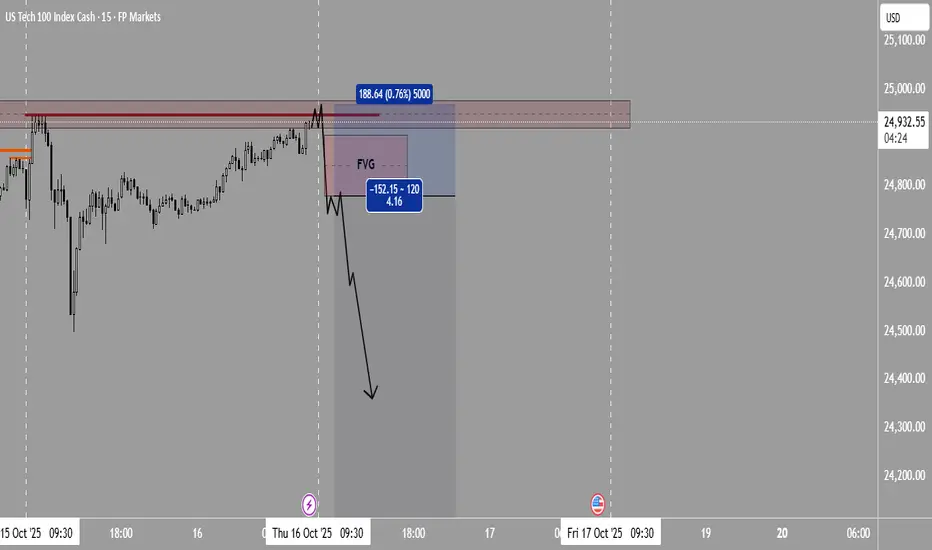
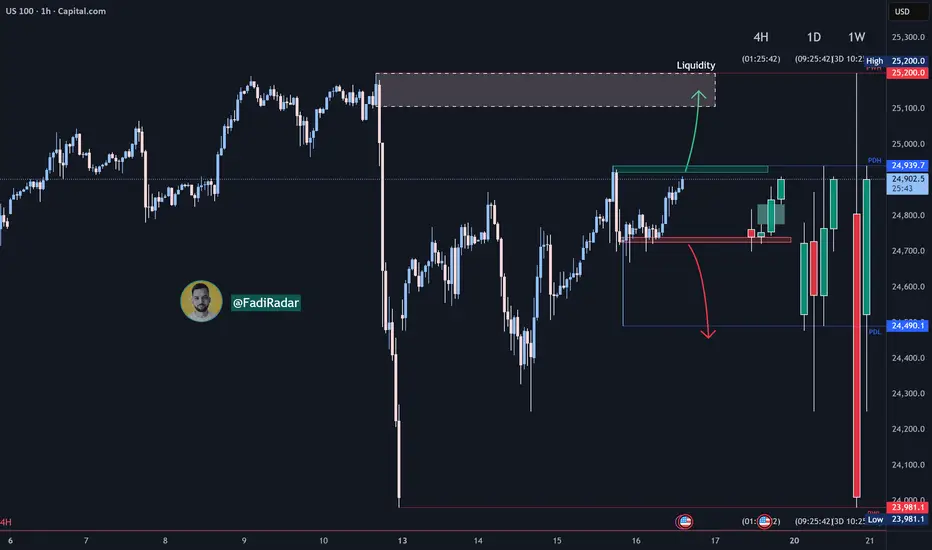
I’m getting ready for potential short position |October 16 2025If today the price goes up and hunts the high from 10 AM yesterday (New York time) — meaning it grabs the liquidity and takes out the stops above that level — and then forms a bearish Fair Value Gap (FVG) followed by signs of weakness or a rejection structure (like a lower-timeframe break, divergence, or bearish confirmation candle), that scenario would be one of the best short setups of the day.
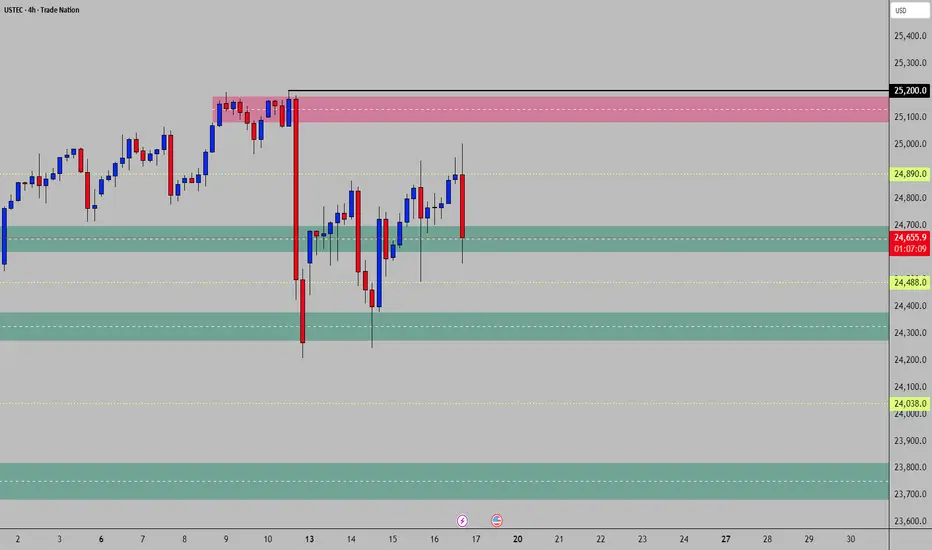
NAS100 in a bearish move and may break 24000NAS100 recently touches all time high to 25200 and sharply retrace back to 24000 level.
The price is now going back to 24800 level. In order to continuous the short term trend , It may move back to 24000 to take the liquidity and it may go further downside to 23800 leve.

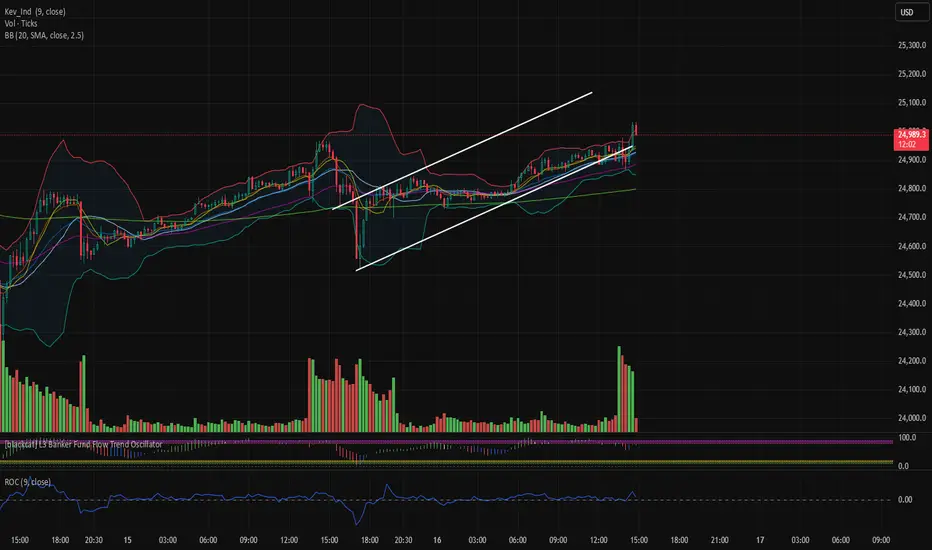
Trendline BreakThe price broke out of a bearish trendline which was a small consolidation as we are still in a bullish trend, the price made a pullback and now looks to continue its bullish run
WE ONLY TRADE PULLBACKS
Comment your thoughts

NAS100 - High Volume Control🔶 USTEC Trading Card
🔑 Pivot Zone: 24,600 - 24,700 (Primary Demand)
📊 Context: Bullish trend in correction | Current 24,776.9
⚠️ Key Levels:
Immediate Resistance = 25,080 - 25,180 (Major Supply)
Lower Support = 24,280 - 24,380
Deep Support = 23,670 - 23,820
────────────────────────────────────────────────
🟢 Bullish Scenario
Bias Flip: Already active (pullback within uptrend)
Trigger: Long from 24,600-24,700 when price shows upward demand - wick below
🎯 T1 = 24,900
🎯 T2 = 25,080
🎯 T3 = 25,180
❌ Invalidation: Back below 24,500
────────────────────────────────────────────────
🔴 Bearish Scenario
Bias Flip: Clear breach below 24,600
Trigger: Short on break below 24,600 with downward supply confirmation
🎯 T1 = 24,330
🎯 T2 = 24,038
🎯 T3 = 23,820
❌ Invalidation: Back above 24,800
NASDAQ/NAS100The Nasdaq looks shaky right now. Tech stocks are still priced high, but cracks are showing from weak momentum to rising global tensions and stubbornly high interest rates. If key support levels break, we could see a pullback.

Just following Trend This is Nasdaq Trend since Monday Low Do think 25,137 is a good short area but Trump speaks at 3pm now so I would just wait.
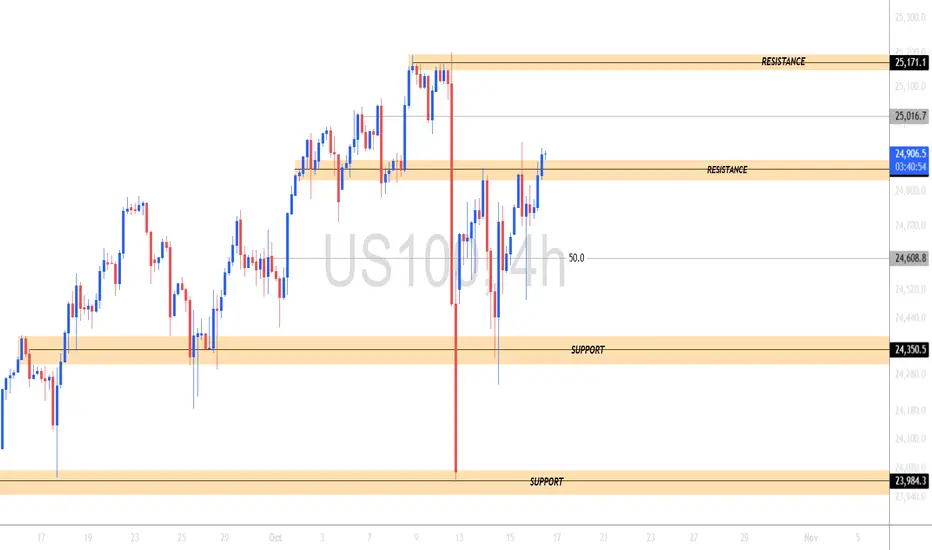
US100 AnalysisPrice is currently trading around the 24,907 🔼 resistance zone after bouncing from the 24,350 🔽 support area. Bulls have regained some momentum, but the index still faces a strong barrier at 24,907. A breakout above this level could open the way toward 25,171 🔼, while rejection could drag price back to mid-range levels.
Currently trading at 24,907, with
Support at: 24,608 🔽, 24,350 🔽, 23,984 🔽
Resistance at: 24,907 🔼, 25,171 🔼
Bias:
🔼 Bullish: If price breaks and holds above 24,907, expect continuation toward 25,171.
🔽 Bearish: A rejection at 24,907 could trigger a pullback to 24,608 or 24,350.
No breakout, no trade.
📛 Disclaimer: This is not financial advice. Trade at your own risk.
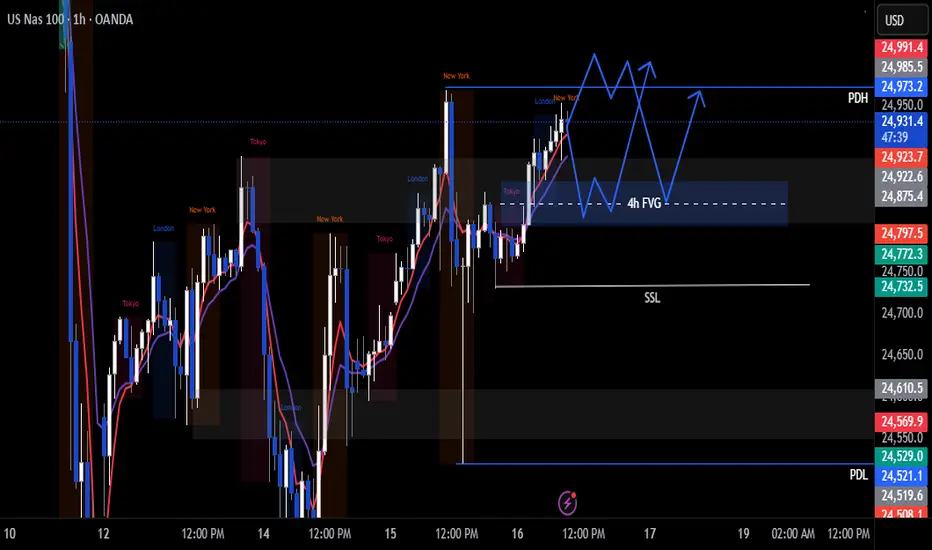
Nas100 Trade Set Up Oct 16 I want to see a see sweep of PDH to then get a push down to 4h FVG before continuing up or a push down to 50% of the 4h FVG first to then buy to PDH
NASDAQ (US100) Analysis:The NASDAQ index is moving in a short-term upward trend and is now approaching the 24,900 resistance zone.
🔺 Bullish Scenario:
If the price breaks above 24,900 and holds, this could support further upside movement toward the liquidity zone around 25,200.
🔻 Bearish Scenario:
If the price rejects from resistance, it may retest the 24,700 support level, and a break below it could shift the trend back to bearish.
📈 Best Buy Zones: on a rebound from 24,750 or after a confirmed breakout above 24,900
📉 Best Sell Zone: below 24,700
USNAS100 – Overview | Bearish Pressure Below 24,855USNAS100 – Overview | Bearish Momentum Below 24,855
The index shows bearish momentum today as long as price trades below 24,855, after testing the resistance zone twice.
Failure to break higher keeps the pressure on the downside, with potential to drop toward 24,510 in the near term.
A 1H close above 24,855 would invalidate the bearish setup and trigger a strong bullish continuation toward the all-time-high (ATH) region near 25,035 → 25,200.
Pivot: 24,855
Support: 24,660 – 24,520 – 24,350
Resistance: 25,035 – 25,200 – 25,400

US100 to break Resistance, Bullish Momentum Continues...US100 is showing Bullish Momentum. If it breaks its resistance, it can likely go further up and test its second resistance. We can take a 1:1 buy trade between these two resistances.
Let's see how it goes.

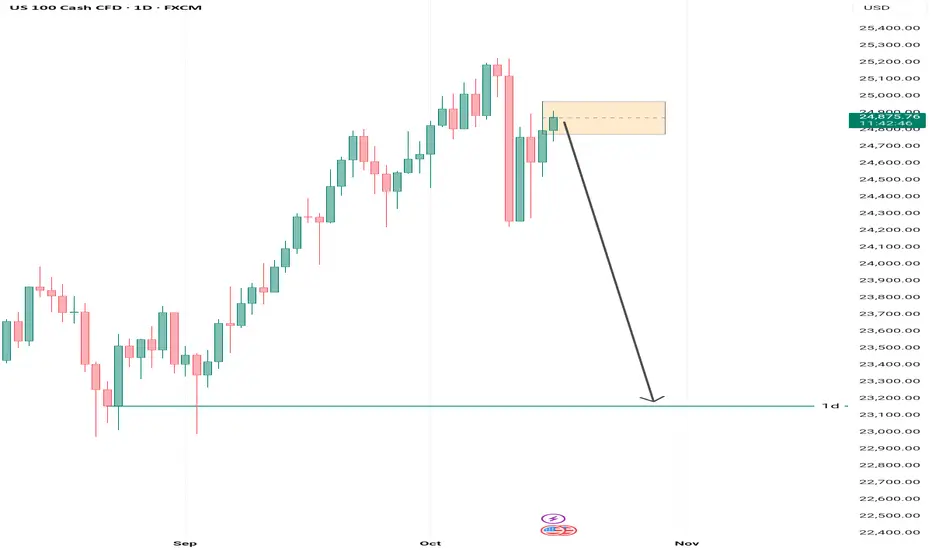
NAS100 4h Bearish move confirmed across multiple timeframes
Based on the breakout observed on the 4-hour timeframe and its confirmation on the 30-minute chart — which itself was validated by the M5 structure break within the highlighted golden zone — we expect the price to continue its decline toward the first daily support level.
This setup provides a strong risk-to-reward ratio, as illustrated on the chart.
As always — stay patient, follow your plan, and trust your analysis.
What's going to happen today ?Don't know what today is going to bring, what do you guru's think about ?
possible entry for short and long looking at volume nodes and aggression of the market..
Above value area high of yesterday so retracement to POC of yesterday is possible before any big moves happen.
I thought normally London is mean reversing but i think time will tell.
Have a good day all of you, and remember trade safe (full margin full risk)

US100: Potential reversal from overbought zone
Symbol: SKILLING:US100
Timeframe: 30 Minutes
Indicators: OB/OS Overlap (RSI, MFI, Stochastic) + S/R
________________________________________
🔍 Quick Summary
After a strong rally 🚀 from the 24,750–24,800 support area, US100 has reached the 25,280–25,300 resistance zone — where multiple oscillators are showing overbought signals.
This suggests potential profit-taking or a technical correction may occur soon.
________________________________________
📊 Price Structure
• Price formed a temporary top after tapping the overbought area, with clear rejection candles near resistance.
• A pullback toward the first support zone around 25,000–25,050 could occur before the next move.
• If selling pressure continues, the next target area lies near 24,800–24,850, where previous structure and demand overlap 📉.
________________________________________
🧩 Technical Highlights
• OB/OS Overlap: RSI, MFI, and Stochastic are all in overbought territory (3/3 alignment) — a strong early signal of potential short-term exhaustion.
• Price Action: A minor double top or bearish divergence may be forming if momentum indicators continue to decline.
• Key Zones: Blue zones on the chart mark areas of potential buyer reaction (demand).
________________________________________
🧭 Scenario Outlook
Main Scenario (🔻 Pullback Expected):
Price could retrace toward 25,000–24,850 before buyers attempt a rebound.
Alternative Scenario (🚀 Continuation):
If the price holds above 25,100 and breaks 25,280, the bullish momentum might continue short-term.
________________________________________
⚙️ Risk Note
This analysis is for educational purposes only and not financial advice.
Always manage risk carefully and align your trade plan with your own strategy 📘💡.
Market conditions can change rapidly — stay flexible and objective!
Please like and comment below to support our traders. Your reactions will motivate us to do more analysis in the future 🙏✨
Harry Andrew @ ZuperView
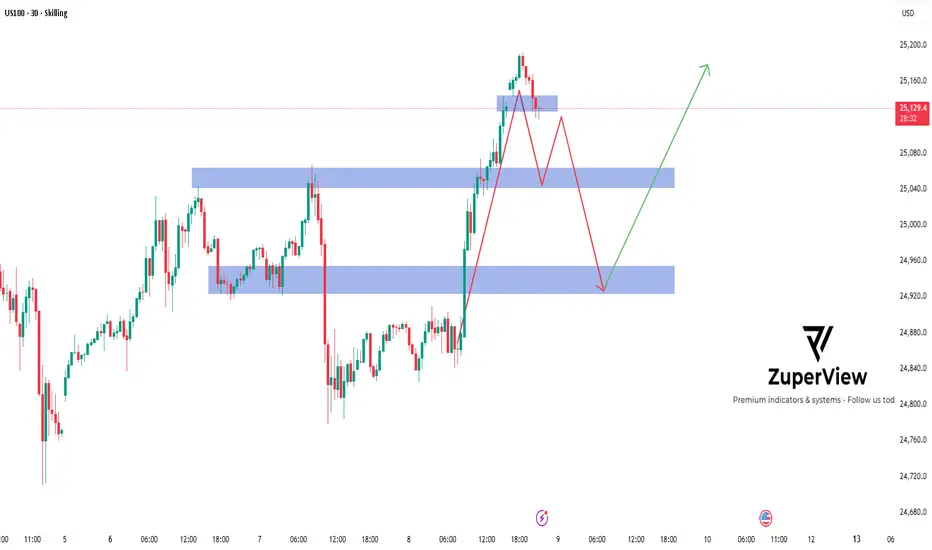
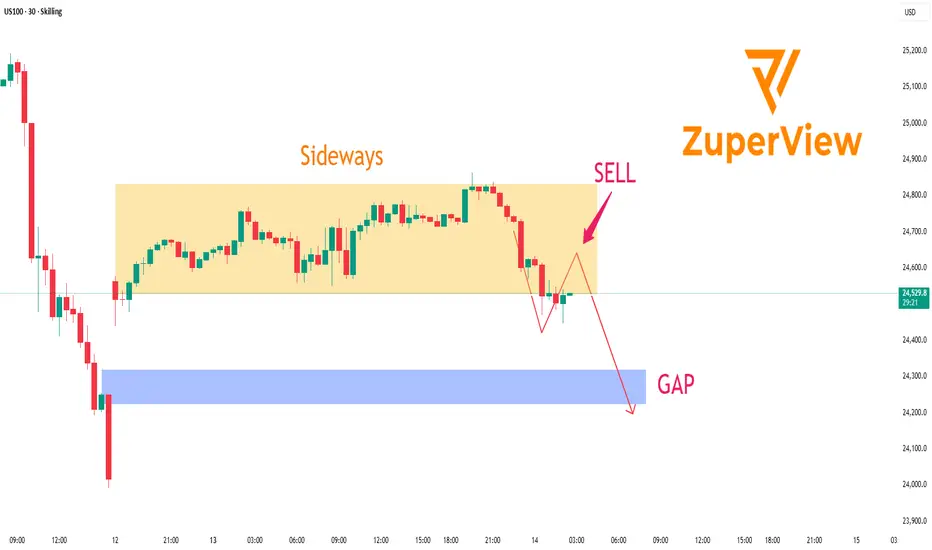
US100: Pullback to fill the GAP below
🧩 SKILLING:US100 – Pullback scenario targeting the GAP support zone
📊 30-Minute Chart Analysis
On the 30-minute timeframe, US100 is showing signs of a short-term corrective move after failing to hold its previous support zone.
Price is currently trading below the Trend indicator’s resistance area, suggesting that sellers have regained temporary control.
After a strong drop, the market is forming a technical pullback to retest the resistance zone. This is often where traders look for opportunities to continue following the prevailing bearish momentum.
________________________________________
🧭 Trading Scenario (For Analysis Purposes Only)
• Potential SELL Zone: 24,650 – 24,740 (resistance and Trend zone)
• Target Area: 24,250 – 24,350 (GAP support area below)
• Invalidation Level: Above 24,750 — if price closes above this level, the short-term bearish structure could be invalidated.
________________________________________
🔎 Technical Outlook
• Short-term trend: Bearish
• Market structure: Forming a pullback–continuation pattern
• Trend indicator: Has flipped bearish, confirming renewed selling pressure
• GAP support: Likely to act as a key area for potential stabilization or reaction from buyers
________________________________________
⚠️ Important Note
This analysis is for educational and informational purposes only and should not be considered financial advice.
Traders should combine this view with their own risk assessment, price action, and macroeconomic context before making any trading decisions.
________________________________________
💡 Summary:
US100 is in a short-term correction phase. If price continues to reject the 24,700 resistance area, the downside scenario toward the 24,250–24,350 GAP support zone remains valid.
________________________________________
Please like and comment below to support our traders. Your reactions motivate us to do more analysis in the future 🙏✨
Harry Andrew @ ZuperView
US100: Breakout signals a strong second bullish leg🧩 Market Context
On the 30-minute chart, SKILLING:US100 index shows renewed bullish momentum after a phase of sideways consolidation. Following a deep correction, price action has started forming higher highs and higher lows, suggesting that buyers are gradually regaining control.
🔍 Price Structure and Breakout
Price has recently broken out above a short-term consolidation zone and a rising trendline.
This breakout reinforces the short-term bullish bias and could mark the start of a second upward leg in the current recovery.
Statistically, when a breakout happens after tight accumulation, the next bullish leg often becomes equal to or larger than the previous one, as momentum builds and buyers gain confidence.
📈 Key Price Levels
• Resistance 1: 24,914 – prior rejection zone in the last upward move.
• Resistance 2: 25,074 – distribution area before the previous drop.
• Support: 24,700 – 24,750 (former resistance now acting as potential support).
⚙️ Trading Scenarios (for observation only)
• After the breakout, price may retest the previous resistance zone (around 24,700–24,750) before continuing higher.
• If buyers defend this level, the second bullish leg could extend toward 24,914 and possibly 25,074.
• Conversely, a close back below 24,700 may trigger a deeper pullback before any continuation attempt.
🧠 Summary
The technical structure on US100 favors a short-term bullish outlook. A successful retest of the breakout zone could pave the way for a second upward leg, potentially matching or exceeding the size of the previous rally.
______________________________________
📌 This analysis is for educational and technical purposes only. It does not constitute financial advice or a recommendation to buy or sell any asset.
Please like and comment below to support our traders. Your reactions will motivate us to do more analysis in the future 🙏✨
Harry Andrew @ ZuperView


NZD 100 pushed downward momentumOn the M15 timeframe, the structure has been broken, confirming a bearish bias. From the lower timeframes, we now expect the price to drop from the golden M3 zone toward the horizontal target level below.
As always — stay patient, follow your plan, and trust your analysis.

15-10-2025 _ Short Term Bullish Idea _ NAS100 H11- Price has broken above 200 MA.
2- Strong Bullish Impulse.
3- As long as the Rising Trendline holds, one can expect push to the Up Side.


NAS100 Double Botton Rejection H1 TF - New ATHsPrepare to get sick of me and these double bottom and top rejection patterns but here is another one on NQ.
Get the right entry and ride it to new ATHs

Nas100 Trade Set Up Oct 15 2025i want to see price sweep PDH, make internal bearish structure and target 4h FVG and possibly Asia lows as SSL before continuing bullish
