NDQ trade ideas

US 100 - Ranges overview Today is Monday, a new trading week and the first trading day of the month. Let's see what the market wants to give us.
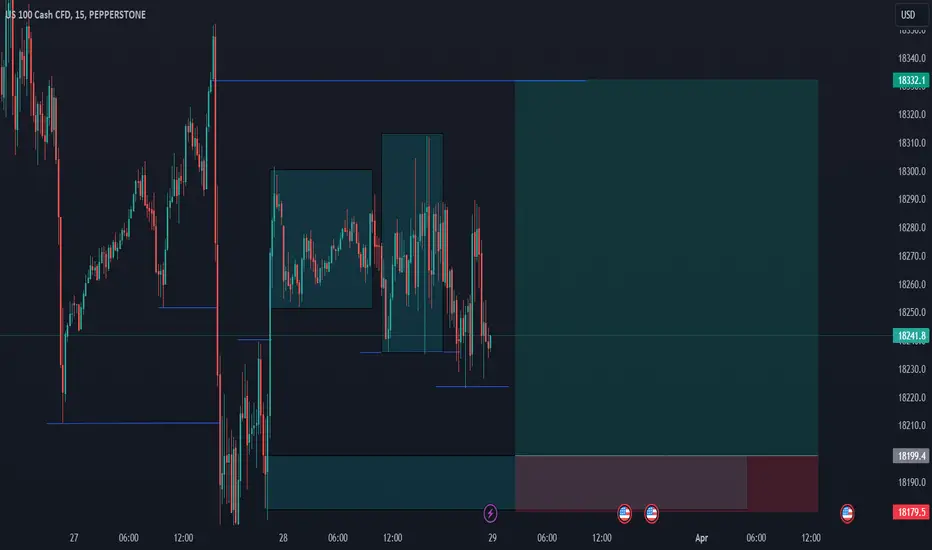
The overall targets remain the same and the trading range remains unchanged.
We have opened the week by trading above the highs of the range (green line).
IF we hold the highs expect further expectation
IF we fail to hold these levels and close back within the range we should expect the sellside to get taken out
BE PATIENT and watch how we trade from here.
Stay safe and never risk more than 1-5% of your capital per trade. The following analysis is merely a price action based analysis and does not constitute financial advice in any form.

NAS100/US30/SPX all making Bull Moves. Don't miss the move.Current Analysis:
NAS100 just broke out the ($5255 - $5260) price range to the Long side.
Entry: $5261.6
TP take profit: 1%-3% RR risk to reward: ($5300)
SL stop loss: ($5251)

NAS100 SHORTSEXPECTING 18329 REGION TO BE SWEPT. Do not expect 18374 region to be swept. Shorts from 18329 ( Look for LTF structure shift with OB- )
SHORT
FX:NAS100


$NAS100USD 4H Time Frame Trade Idea for the Week 4/1/2024 TO 4/5OANDA:NAS100USD 4H Time Frame
Trade Idea for the Week 4/1/2024 TO 4/5/2024

US100 - Looking for Bearish Breakout and a Short Trade Signal💡Hello Traders!
This is my idea for US100. I expect a retracement until the Bearish OB and after that, to look for a short trade entry as I expect a bearish breakout of the market on US indices.
In case of confirmation, I will execute this trade.
Please LIKE 👍, FOLLOW ✅, SHARE 🙌, and COMMENT ✍ if you enjoy this idea! Also, share your ideas and charts in the comments section below! This is the best way to keep it relevant, support us, keep the content here free, and allow the idea to reach as many people as possible.
____________________________________
www.tradingview.com

NASDAQ US100weekly-daily- up trend(bullish)
bullish patterns
if nasdaq breaks its main resistance18380 by 4hr candle we will continue bullish target
18460-18580-18700
to go bearish nasdaq must break its support 18120 by 4hr candle to target
17980-17800-17760

NASDAQ SellsHello traders, it is great to be back! this weekend I am taking a look at nasdaq where I see the possibility to get involved in potential sells, we have a nice supply zone that price may potential play off of. I will be looking to target down toward 1800 where we have some liquidity.
Good luck traders! be sure to use proper risk management!

NAS100/NASDAQHello Fellow traders, this idea on SKILLING:US100 is being distributed to my community, I'm sharing it here for your comments, if this is valid.
This is only my view, im looking for another Buy limit on this pair $nas100.
This is not a financial advice,
Once we hit another 2 highs, I will update again this idea.
Follow for more.

Return to Bullish OrderblockMarket was accumulating engineering liquidity of which was then swept both the high.Now the market has to distribute and clear out the liquidity void left.
NAS100 Long term Buy idea & short term scalp possibilityBig time frame uptrend breaking previous ATH.
Currently in short time frame downtrend accumulating strenght for new breaks.
Strong resistance at this moment.
Possible short term sell scalp and big long term buy idea.

Godfather market targeting(wall st... main st)I prepared this analysis after 4 hours of expertise. This is the most accurate scenario of the us100. The price will reach the green lines. Before it wants to hit the red lines... the Nasdaq target will definitely be 19671.8. Description on the price image... This idea will be loaded and archived...I emphasize that this analysis is not an indicator or Elliott or Fibo Nachi

NASDAQ $20 000?NASDAQ100 has been making a lot of bullish moves despite several strong bearish momentums. it has not made a retest of any nature to the major key levels and keeps making new record highs.

NAS100: Riding the Bullish Wave!Hello Everyone,
The current emphasis for NAS100 is on maintaining levels above the weekly pivot point (1W PP) and ultimately establishing a stable position above the daily pivot point (1D PP). NAS100 continues to present a strong buying opportunity and is anticipated to sustain its upward trajectory. Although there is a prevailing sentiment favoring short positions in the long term, the current situation suggests ongoing bullish momentum. It's essential to observe how developments unfold, but all indications point towards further upward movement at present.
TradeWithTheTrend3344

NAS100 bullish scenario if the price stays above the 18000 it will move up. i am still bullish. Good Luck.

NASDAQ is approaching a significant level.Hey Traders, in the coming week we are monitoring NASDAQ for a selling opportunity around 18300 zone, NASDAQ is trading in a downtrend and currently is in a correction phase in which it is approaching the trend at 18300 support and resistance area.
We would also like to consider the current bullish bias on DXY due to the negative correlation that may put extra pressure on NASDAQ.
Trade safe, Joe.

NASDAQ (US100) - Long opportunity ✅Hello traders!
‼️ This is my perspective on US100.
Technical analysis: Here we are in a bullish market structure from daily timeframe perspective, so I look for a long position. I wait price to continue the retracement to fulfill that huge imbalance and then to reject from trendline + FIBO 0.618 level.
Like, comment and subscribe to be in touch with my content!

US 100 long - swing trade Sellside taken and currently trading trough the buyside.
Personally taken short scalps up until the NY open so let's see where the market wants to go from here.
Don't forget there is news at 10:00 am (NY time). Expecting us to trade back within the FVG (blue box) before continuing on pushing higher towards the highs (green line)
IF we fail to hold these levels we will get a deeper retracement towards yesterday's lows.
Stay safe and never risk more than 1-5% of your capital per trade. The following analysis is merely a price action based analysis and does not constitute financial advice in any form.

US100 - Trend continuation after correctionUS100 making new highs for a long time, now instrument passed previous reversal point, I am waiting to rise to upside and thinking idea of buying from previous reversal price very good idea.

US100 Will Go Up! Long!
Please, check our technical outlook for US100.
Time Frame: 12h
Current Trend: Bullish
Sentiment: Oversold (based on 7-period RSI)
Forecast: Bullish
The market is testing a major horizontal structure 18298.8.
Taking into consideration the structure & trend analysis, I believe that the market will reach 18603.7 level soon.
P.S
We determine oversold/overbought condition with RSI indicator.
When it drops below 30 - the market is considered to be oversold.
When it bounces above 70 - the market is considered to be overbought.
Like and subscribe and comment my ideas if you enjoy them!

Nasdaq is on the verge of growthThe Nasdaq index may be setting up for the breakout, ahead of the long holidays (Good Friday). Volatility remains low, as VIX keeps below 13.
The overall narrative behind the stock market is disinflation, as traders are not yet convinced if the interest rate will be lowered during the meeting of the Fed in May and June. Among other publications, the most important one would be a publication of the PCE index on Friday (the so-called "Feds inflation").
The US GDP growth rate for Q4 the US was 3.4% against 3.2% forecasted, which is stronger than expected. That is a sign of strength for the US economy and may continue supporting stocks.
Tech sector (Nasdaq) might take off after a two-weeks underperformance in comparison to other sectors, due to rotation within the bull market.
Trade well and manage risks at all times!

NAS100 Remains BULLISHI remain bullish of the NASDAQ 100 until I'm given a reason not to be. At this point, there just isn't much of a reason to think about shorting, especially given the fact that the indices aren’t even designed to fall for any great length of time – as they are not equal weighted. Remember, passive investors continue to buy all of the same stocks, which of course are the biggest ones in this index.
