NAS100Ultimately bullish on the Nasdaq. Just waiting for any sort of pullback to get involved in the trade
NDQ trade ideas

US100 LONGI took this long while i was out of my house (look at previous idea on my page to see evidence and timestamp for the long entry) Unfortunately my idea wouldnt publish on my phone.
Long was taken as a reverse postion to my prior short trades that i closed at break even and a small loss.
Long is also explained within those ideas, But heres a quick breakdown.
After multiple fast rallies to the top side, re testing todays and yesterdays highs i was wanting to see price hold and drop from these levels as a last ditch effort from longs. However if price broke above and held above them levels it would signal to me that longs are in a more valuable spot than short traders as they hold more value holding their postions rather than closing them.
Alot of the time, other traders see this and close their shorts agreeing with potential value to short at higher prices. If prices were to of dropped low again, There would be a higher value change in a long than a short.
Shortly after the long postions were taken, we saw a large push to the top side as i predicted would happen if price held above (which it did)
Im now expecting this long postion to hold for a few days and i will trail and update as price continues to rise.

US100 LONGExtremely low risk on this trade - refer to bottom to see how i risk.
Price has just taken out most of the weeks highs via a very strong, consistent rally.
Im expecting price to fake this level to gain the luqidity it needs to push higher.
If price does not move higher and manages to break and stay below the newest low then i will close for a small loss and reverse the postion.
- I risk a % of my capital per 1% market change.
Example, 1% risk per 1% market change. Hover over the long tool in the idea to see the total % risk/gain for this trade.
I will also be trailing this trade as i have done my last, The TP is not infact my TP.

Uptrend analysis on Nas100This does not constitute as financial advice it is purely analysis intended for educational purposes

NASDAQ, expect a top to be built at 18kHello everyone,
I've been watching NASDAQ closely as I expect to end an elliot wave count around the 18k area.
If the level will be reached soon the chance for a correctional move is high, where we could anticipate in.
To make it short, the psychological level of 18.000 will be very interesting, but there is also the channel trendline above, that should form strong resistance. I usually work with several positions, the cyan tringle area will be used for shorting.
I will keep you updated about further actions.

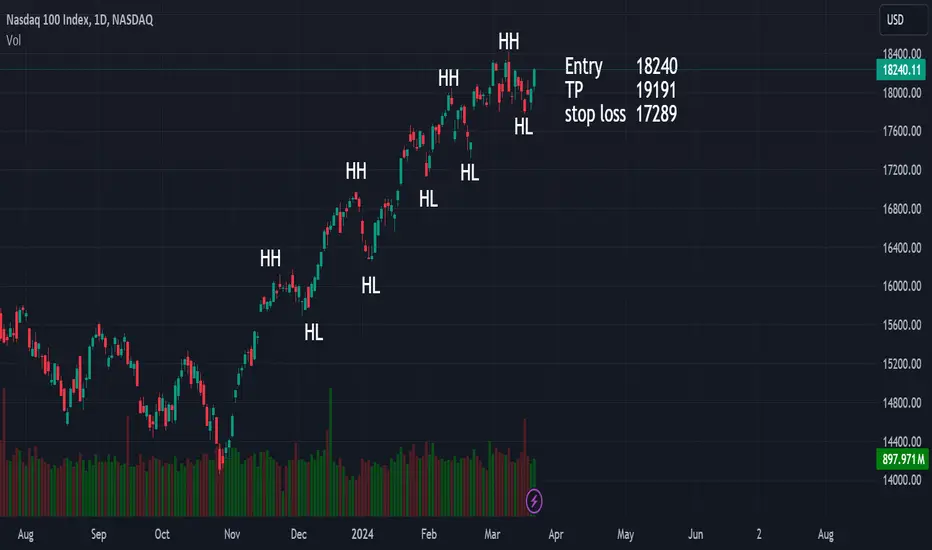
NDX Still BullishNDX still creating Higher highs and Higher lows. The trend is still advancing. However, it is important to do your own research before making any investment decisions.
US 100 resultUS 100 trade result, the target was reached. Most of the volume was yesterday, the FOMC


Nasdaq approaching strong resistance zone?Hi Guys,
This is starting to sound like a broken record, but the Nasdaq and accomplices, Dow Jones and SP 500 have yet again broken into all time highs, just when it looked like they might all pull back.
Nasdaq is now approaching what may be a strong resistance zone that is highlighted with the purple box and the lines in it.
The red and black line above it are explained with the text box and the SP 500 and Dow both faced selling pressure at the same retracement level.
The other lines are fib extensions from recent impulse moves.
There is a shark pattern that lands precisely at the 1.27 retracement level but the fib ratios not so good so I have left that out.
Hope this is useful to some.
Safe Trading all


Nasdaq Buy target reached.I want to highlight an issue regarding timeframe analysis. Some of you know something called "Top Down" price action analysis. For those who don't know what a Top Down price action analysis is, let me elaborate on it. A Top Down price action analysis is when a retail trader begins his/her analysis from higher timeframe like Monthly down to 1hour roughly speaking. This type of analysis of switching back and forth on timeframes is what's so called Top Down price action analysis. Now here is what I wanted to highlight some of you on, timeframes are never to be treated as confluence when it comes to trading. They are simply made with the purpose to accommodate everyone. If you don't want to spend every second of your time watching price moving up and down you will use Higher timeframes. Define your timeframe and stick to it.

USTECThe "higher high, higher low" pattern indicates an uptrend, with each peak and trough higher than the previous one. It reflects increasing buying pressure and bullish sentiment. Traders use this pattern to identify upward trends and make buy decisions. Risk management, including setting stop-loss orders, is important when trading based on this pattern to mitigate potential losses.

US100 shortFast rally to the topside again, This in my opinion is the last ditch effort of longs + luquidity to trial breaks of the highs, If this market does short lower than we can easily see another break even position again meaning this trade is very low risk.
Keep in mind that i do not use physical stop loss's, I use mental Stop loss's (visual areas that i want to get out if price goes agaist me)
I can do this method of no SL as i risk a certain % of my account value per 1% of market change.
If we do see this rejection on this level, I predict that it will sit around its current price for a while until buyers finally accept that higher prices are not value and will see a steep drop to the downside.
If this market does rip to the top and hold around the area or above the area of my stop loss then i will be looking to reverse the position and hold till the end of the week, Expecting highs to be taken as the short cycle would have come to an end.

Nasdaq BuyOn Nasdaq, Target is almost hit. Immediately when they washed out retail positions, I caught a beautiful entry which align with my strategy.


NAS100 Rising Wedge Break - Sell on RetracementNAS100 Daily Chart Rising Wedge Break
Sell on Rise with SL above the highs
TPs calculated based on risk taken
Price Projection based on Rising Wedge
Pattern width
1:3 RR Trade

Nasdaq's another figure May we have an ABCD pattern. Before the decision of the fed about interest rate. Be careful !


La manipulation semble terminée et la distribution commence !AMD on nasdaq. We will look for the level of the fib channal I mentionned a while ago, in another video idea

US100 SHORTFast rally to the weeks highs, So fast that a retrace is highly probabal.
This retrace will allow a break even aproach to the trade which makes it low risk.
Epecting the lows to be taken if this high rally doesnt hold


Sell?The Nasdaq 100 (NDX) is flashing potential signs of weakness after a stellar run.
Remember: Do your own research before entering any trade. This is not financial advice.
#NAS100 #SellSignal #TradingView
