NDQ trade ideas

Consolidation until 15 May Core CPI dataScary weekly close, but expecting the index to consolidate more until 15 May to make the big drop.
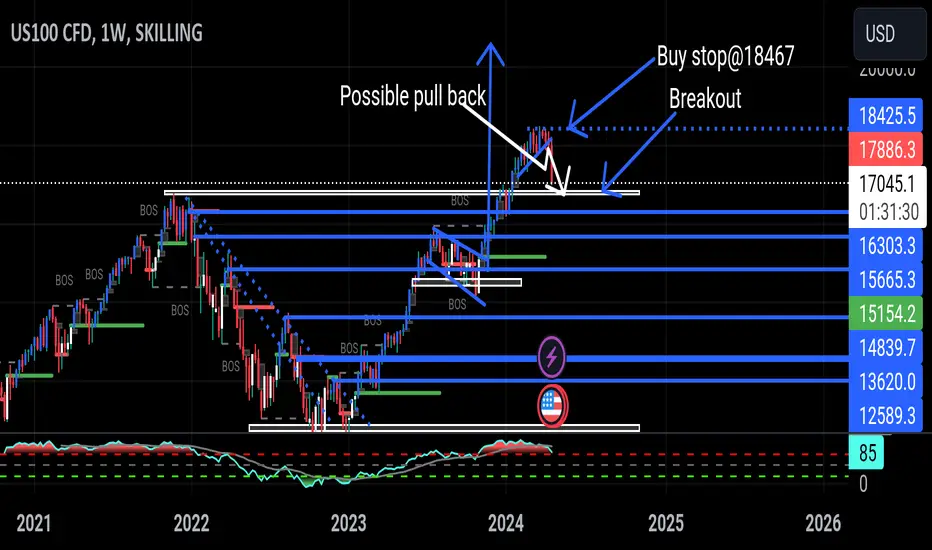
Opening long until 15 May from 17k. Sell on 15 May 2024

NASDAQ is leading the way down ⤵️Capitulation?🩸🐻NASDAQ is leading the way down ⤵️
NASDAQ is leader index, whereas the #Russell is a laggard, with the lesser #SPX.
As the MAG 7 were leading the way up, now they dragging the rest down.
Capitulation?🩸🐻


Nasdaq-100 Index. Meet and Greet March Quarter Earnings Season.US stock indices, including the benchmark American economy S&P500 index (SPX) and US BigTech Nasdaq-100 index (NDX), are retreating from their yearly highs, moving to a more aggressive decline last Friday, April 12.
Investors digest the first portion of earnings reports for March quarter 2024 - traditionally starting with financial sector Earnings reports.
New Earnings season has begun! Perfect!
Well... sounds good. Anyway...
JPMorgan (JPM), Citigroup (C) and Wells Fargo (WFC) reported first-quarter earnings that beat forecasts, but a large number of persistent inflation pressures are still building and continuing.
JPMorgan CEO James "Jamie" Dimon warned that while the stock market is healthy and most economic indicators look favorable, there are still significant risks that could arise at any time.
"Looking ahead, we remain alert to a number of significant uncertain forces. First, the global landscape is troubled, horrific wars and violence continue to cause suffering, and geopolitical tensions are rising. Second, there appear to be a large number of persistent inflationary pressures. Pressure that is likely to continue," - Dimon said on the conference call.
On the inflation front, US import prices rose for the third straight month in March, slightly above the consensus forecast of 0.4% month-on-month. Almost all of the rise in import prices was driven by the recent rise in oil prices.
The fight against inflation - which has transformed into a classic chronic illness from a relatively minor cyclical problem driven by a low Covid-19 base - appears to have reached a stalemate, and the first rate cut will not occur until December, Bank of America (BAC) now says.
Despite the fact that at the beginning of 2024, the market was almost 100% confident that at least one rate cut would take place by the June FOMC meeting, and by the December meeting, the number of rate cuts could reach three.
Monetary easing by June is looking more and more like an unattainable dream, tempered by the latest data.
Recent inflation data, while in line with expectations, doesn't give the Federal Reserve much reason to rush.
But if the central bank doesn't cut rates by June, it will likely delay any cuts until March 2025, Bank of America strategists said.
In reality, long-term forecasting of the US Federal Reserve's monetary policy curve is not an easy task, given that only forecasts for the next FOMC meeting, which is scheduled for May 1, and for which the market does not factor in a change in interest rates, can be relatively reliable.
Of much greater significance is that the same arguments and theses that are presented in the reports of the largest American banks - the locomotive of the American economy - may find their repetition or imitation in Earnings reports for Q1'2024 of dozens and hundreds of other companies over the next two-three months.
Technically, the main chart of the Nasdaq-100 Index (NDX) featured in the idea is in a long-term positive trend of a weakly rising channel, above its 5-year SMA.
At the same time, taking into account the possibility of escalation of macroeconomic and political risks, one cannot exclude the prospect of its decline to the lower border of the channel - down to the levels of 12,500 - 13,000 points.
Also lets take into account the fact that the entire 10-12 percent Nasdaq-100 increase from Q4'21 highs to nowadays can be easily represented as the transposition of a 200% increase in the shares of only one company - Nvidia (with its near 6% allocation in the index), - which increased in price from $320 to over $960 per share over the same period of time - from Q4'21 by Q1'24.

US100 Will Fall! Sell!
Take a look at our analysis for US100.
Time Frame: 9h
Current Trend: Bearish
Sentiment: Overbought (based on 7-period RSI)
Forecast: Bearish
The price is testing a key resistance 17330.1.
Taking into consideration the current market trend & overbought RSI, chances will be high to see a bearish movement to the downside at least to 16972.3 level.
P.S
Overbought describes a period of time where there has been a significant and consistent upward move in price over a period of time without much pullback.
Like and subscribe and comment my ideas if you enjoy them!

US100 upcoming moveAs index pullback is very big opportunity for investment, a great time is coming to buy US100 as tech market will bloom in future, with the fast development in AI sector it is biggining of a new era, I am definitely looking for this big opportunity to come now it is coming , with a 61.8% to 50% retracment zone I am going to put a big fund and hold my position till 20k level

NASDAQ/QQQ Q2 24' FORECAST: IGNORANCE IS BLISSignorance is bliss till consequence's kiss
(i am not a doomsday prepper or hope'r this is not financial advice or a prophecy of doom)
im expecting price to drive higher to one of the target points highlighted and will be expecting
a drop of a significant magnitude (new york earthquake magnitude 4.8)
all these rate cut anticipations as inflation just starts to pick up
with the way they people seeking cuts you'd think inflation is invisible in their eyes (makes sense no one pays attention to unattractive things😭 )
so the
data will come hot cpi nfp etc numbers will be good until they have been revised yet again!
and 3.4 inflation becomes a 3.7/4.0 maybe 4.8 like the earthquake(maybe its a fractal of whats to come lol), rate cuts are out of the question... cause now, the ugly is staring you in the eyes you're uncomfortable but you cant ignore him, he just placed he's hand in your pocket maintaining eye contact and says....... recession was inevitable diacth as he pulls out a piece of your sanity. in that moment of panic you chose to save yourself from a financial beatdown in your portfolio as your sub-concious mind tells you WHEN IN DOUBT GET OUUUUTTTTTT !!!
HODL'ING IS GREED BRO ... you realise this but you choose to wait and see. -10% has been shredded from you portfolio tomorrow its up by +4% hope is born in this pullback it drops another -12% the day after you accept your loss pull out but alas the baby has been deposited you game was weak bro.
But thats okay cause you can revenge short all your investments in one fell swoop ( NASDAQ:QQQ ) driving the economy into anachy, elon musk just went from 3 digits to 1 digit billionaire he posted some memes but you cant laugh because uncertainty lingers in your mind about tomorrow, but u find peace in knowing you're not alone and the market has always been a risky place as you cope with the crowd. affirming no risk no reward
the end
but is it... you remember this post you comeback to me seeking answers and i charge you $15.99 in tips to answer what these darn tarots cant but we both agree this is not the financial advice bro, as i post alternative investments that reap 20% while the hedies praise themselves for 3% gains amid crisis 😪
patterns in the chart patterns in the data with the way things are not suprised if it does pick up tbh www.usinflationcalculator.com
LIKE COMMENT FOLLOW

NAS100 on DailyOverall uptrend structure, price was forming a series of higher highs & lows. Price made a new higher high @ 18450, but failed to continue the uptrend impulse stage & sellers push price back underneath the previous all time high zone. Since then, sellers have now pushed price back & is currently invalidating the uptrend today by breaking the last higher low & support structure zone. If todays candle closes below structure, the next daily open, price may retest the previous support zone as new resistance on the lower timeframe, & shift the trend back to the downside. On the monthly timeframe, quite is a bit overextended with buyers, and a correction may be coming.

NAS100: Potential Rebound as Buyers Step InHello Everyone,
The NAS100 has experienced a significant decline following resistance from the 1-month and 1-week pivot points. Presently, two possible scenarios loom: an immediate upside bounce from the recent low or further testing of support levels, potentially reaching as low as 16169. Currently, there are signs of buyer activity emerging.
TradeWithTheTrend3344

Nasdaq Dwindling MomentumWhile the markets have not broken down and are still in long term uptrends...
Please look at the weakening momentum!
Current market complacency is astonishing.
#Nasdaq


This is How I took sell trades today on NASDAQ(NEWYORK SESSION)I had my overall analysis from last week, I had the direction on where the price is heading to. The market had already made a second touch on our major key point(Daily Support level) that we predicted that price is going to react on, I then had to wait and see how price will playout on current resistance level, I used the 15minutes to get another resistance level and price rejected twice today on that price level and a HEADS&SHOULDER pattern was created on my 1&5minute timeframe that's were I then became confident enough to enter trades.

Bullish price actionfrom what im seeing and this could be a bullish pattern to the highs of this recent high or at least 50 percent

Nasdaq and Indices Lower on Middle East conflictNasdaq keeps pushing bearish as the stock indices struggle to deal with rising tensions and conflict in the middle east. The Monthly/Weekly timeframes .. everything is bearish. As we head into the close of the week I'm anticpating a further push bearish. The previous 4hr candle closed a shooting star candle.. this coincided with the 1hr timeframe rejecting a 1hr resistance zone,17,397. The market dropped and really disliked the Israel strikes from 12 hours ago. We have bearish momentum , anticpating a retest of daily support level 17,164. The weekly candle will likely keep pulling down to finish off the candle. Vix volatility index gapped way up overnight due to war conflicts and this signals more puts being bought and therefore more anticpated downside on the Indices.

$NDX in oversold territory, support levels & major moving avgThe NASDAQ:NDX , Nasdaq 100, is at a support level on the daily chart, left.
The 4Hr chart shows it is almost at the 320Moving avg, left.
Being that there's support & the intraday is at a Major Moving Avg, we'll likely get some sort of bounce around here.
The index is also oversold daily & intraday.
NASDAQ:QQQ NASDAQ:TQQQ NASDAQ:SQQQ

NAS100We were triggered and stopped out but we did fair.
DAILY
Kept falling and dragging down and tested around the support level, 17070 around here. We have a test candle which shows that our test level was correct.
4H
Price is testing again (in correction) so we stay waiting and watching for either the break (impulsively) or the reversal impulsively. This is where we will get more information to lay forward our case.
1H
Reject before 17500 is where we would believe that our correction has ended, break through here means we wait even more.

4/19/2024 NASDAQ PERSPECTIVEPOI areas for today. I'm waiting for price to take liquidity and react to these areas. I shall personally take entries dependent on how price reacts in these zones. If price takes liquidity on the 1m timeframe in any area and shoots towards a POI, then that POI is more then likely invalidated. If price slows down before reaching a POI, then it's more then likely valid. Trade at your own risk. Good luck today!


📈 Bullish Butterfly spotted on NASDAQ! 🦋 Bulls set to dominateExciting news for traders as a bullish Butterfly pattern emerges on NASDAQ 📊🔍. This pattern, known for its predictive power in forecasting bullish reversals 📈, suggests a potential uptrend in the market.
The Butterfly pattern consists of specific Fibonacci ratios between price swings, indicating a strong probability of a bullish reversal. Traders are anticipating a surge in buying pressure as the pattern unfolds 📈💪.
Key to this pattern are four distinctive points: the initial downward leg, a corrective retracement, an extension leg, and a final upward reversal leg. As price action approaches the projected reversal point 🎯, traders are gearing up for potential gains.
Factors such as market sentiment, economic indicators, and company earnings will influence the pattern's confirmation and subsequent market movement 🌐💼. Traders are combining technical analysis with fundamental insights to maximize profit potential.
Get ready for bullish momentum! Traders equipped with a comprehensive understanding of harmonic patterns and market dynamics are poised to capitalize on the potential uptrend in NASDAQ 🚀💰.

SELL NASDAQYesterday I posted to sell NASDAQ, however the market didn’t reach our OB and gave us an BOS, now since the market have reached our OB you can sell and set SL and TP as dat in the chart.
