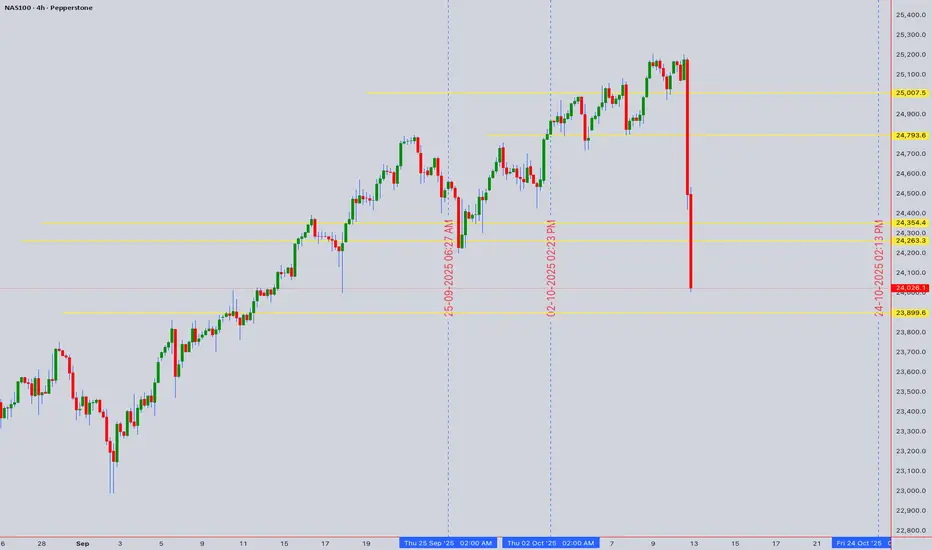
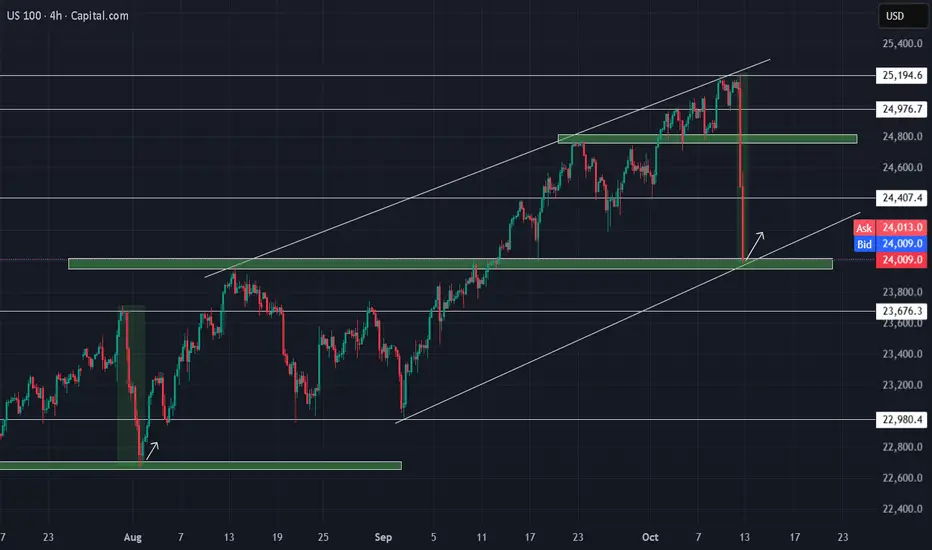
NAS100 4HThe price is currently in a pullback zone near the trendline and a key resistance area; therefore, the possibility of a correction or another decline cannot be ruled out.
Trade ideas
NASDAQ Index Analysis:📉 U.S. indices witnessed a sharp decline on Friday’s session, with the NASDAQ being one of the most affected, closing at 23,980.
📈 As Monday’s session opened, the market started with a strong bullish gap (Gap Up) at 24,480, then continued to move upward — a trend likely to persist in the coming hours.
🔹 Expected Scenario:
As long as the price remains above the 24,500 support zone, the likely movement is toward the 25,100 resistance level for a potential retest.
🔸 However, if 24,500 support is broken and closed below, we could see a deeper correction before the uptrend resumes.
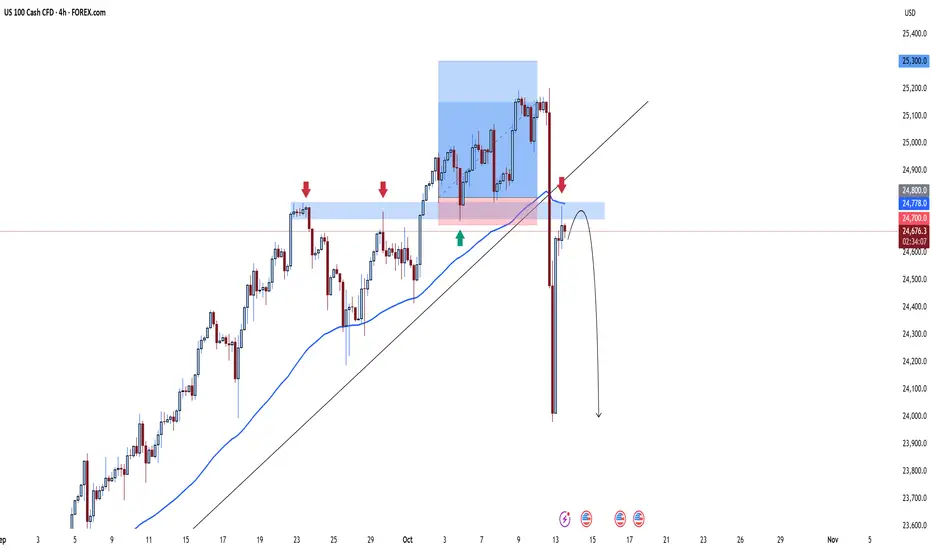
BEARISH TRADE IDEA - IF THEN ANALYSISMONDAY: 13 OCTOBER 2025
PRE-NY ANALYSIS:
BEARISH INTRA-DAY IDEA FRAMED ON H1 AND REFINED ON M15:
- Market currently in a Premium and just caressed the OTE (62%) of the Fib.
- Price also currently above the True-Day Open.
- Would like to see price trade lower into the Discount of the range (below the True-Day Open) before trading higher into the overlapping H1/M15 -FVG before trading softer, as per scenario 1.
- Otherwise, we look to scenario 2.
DISCLAIMER:
The owner of this page is an authorised Representative under supervision of TD MARKETS (PTY) LTD, an authorised Financial Services Provider (FSP No. 49128) licensed by the Financial Sector Conduct Authority (FSCA) under the Financial Advisory and Intermediary Services Act (FAIS).
The FSP is licensed to provide advice and intermediary services in respect of Category I financial products, including but not limited to derivative instruments, long-term deposits, and short-term deposits.
All investment ideas are provided in accordance with the scope of the FSP's license and applicable regulatory requirements. Derivative instruments is a leveraged products that carry high risks and could result in losing all of your capital, and past performance is not indicative of future results.
This idea and any attachments are informational/education and does not constitute advice.
No guarantee is made regarding the accuracy or outcome of this trade idea.
If you choose to accept this idea, please do so at your own risk.

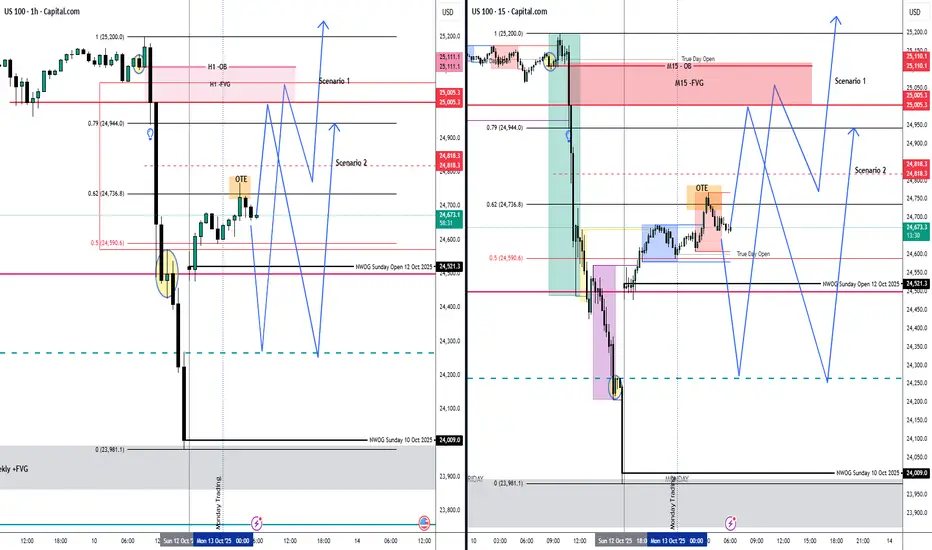
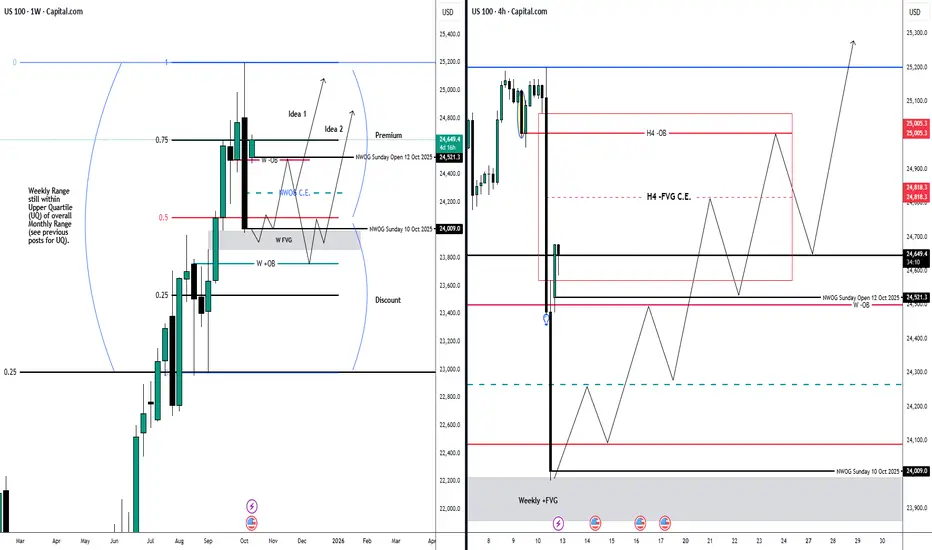
BULLISH TRADE IDEAS - IF THEN ANALYSISMONDAY: 13 OCTOBER 2025
PRE-NY ANALYSIS:
BULLISH INTRA-DAY IDEA FRAMED ON H1 AND REFINED ON M15:
- Market currently in a Premium and just caressed the OTE (62%) of the Fib
- Price also currently below the True-Day Open.
- Would like to see price trade lower into the Discount of the range before trading higher as per scenario 1.
- Otherwise, we look to scenario 2.
DISCLAIMER:
The owner of this page is an authorised Representative under supervision of TD MARKETS (PTY) LTD, an authorised Financial Services Provider (FSP No. 49128) licensed by the Financial Sector Conduct Authority (FSCA) under the Financial Advisory and Intermediary Services Act (FAIS).
The FSP is licensed to provide advice and intermediary services in respect of Category I financial products, including but not limited to derivative instruments, long-term deposits, and short-term deposits.
All investment ideas are provided in accordance with the scope of the FSP's license and applicable regulatory requirements. Derivative instruments is a leveraged products that carry high risks and could result in losing all of your capital, and past performance is not indicative of future results.
This idea and any attachments are informational/education and does not constitute advice.
No guarantee is made regarding the accuracy or outcome of this trade idea.
If you choose to accept this idea, please do so at your own risk.
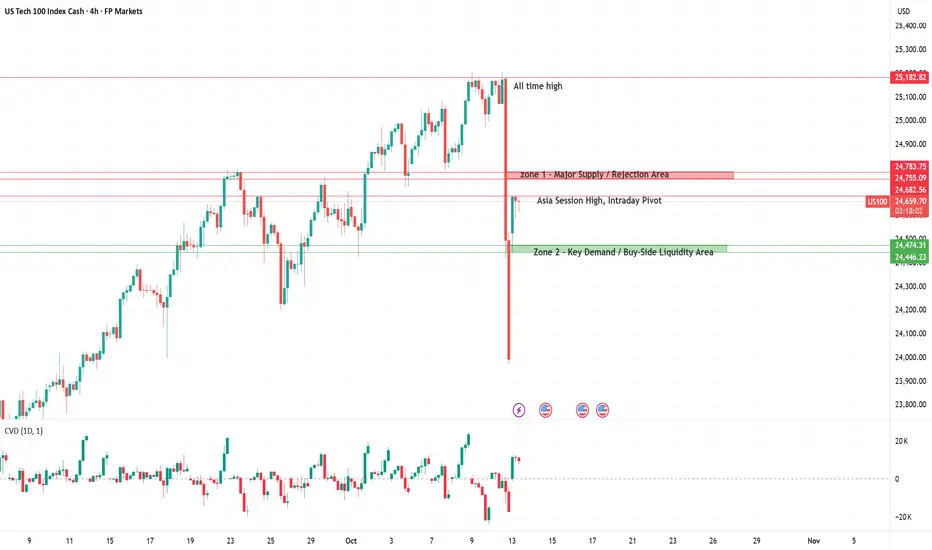
Nas100 - Pulls Back from Record Levels, Testing Critical SupportZone 1: Major Supply / Rejection Area
This zone aligns with the upper consolidation structure from which the last impulsive sell-off originated. Sellers have shown clear presence here, making it a strong supply pocket. As long as price remains below, it acts as a tactical short zone or at least a reaction point where momentum may fade. A sustained break and acceptance above would neutralize the selling pressure and open the door for a retest of the highs.
Asia Session High: Intraday Pivot
This intraday level marks short-term liquidity and offers a reference point for session-based structure. If price holds below it, short-term bias stays bearish toward the lower demand zone; reclaiming it intraday could trigger a squeeze back into Zone 1.
Zone 2: Key Demand / Buy-Side Liquidity Area
This zone has repeatedly acted as a strong buy-side absorption region. It represents the base of the prior impulse move, where aggressive buyers stepped in to defend structure. A clean hold here could produce a sharp rebound, while a decisive break below would confirm a shift in market control toward sellers and potentially start a deeper correction cycle.
Sentiment
The Nas100 remains near record highs, with sentiment best described as bullish but cautious. The market is still being driven by expectations of upcoming Fed rate cuts, falling bond yields, and strong momentum in AI and large-cap tech stocks. Despite a weaker macro backdrop, investors continue to treat the tech sector as a structural growth play and a safe haven in an uncertain environment.
However, the tone is far from euphoric. The ongoing U.S. government shutdown has created a “data blackout,” leaving traders without key economic releases such as CPI or employment figures. This has made the market more headline-driven and prone to volatility. At the same time, renewed U.S.–China trade tensions and rising warnings about overvaluation are keeping risk awareness high.
Overall, sentiment on US100 remains positive, supported by liquidity and tech optimism, but the rally rests on fragile ground - driven more by policy expectations and momentum than by clear fundamental strength.
How to find algorithmic levels of support and resistanceUsing repeating pinpoint levels to form meaning of opens and closes around these levels give you an advantage in your analysis.
As price gives us clues to what levels are affecting price, we should mark the new candles that are responding to these levels by breaking and retesting these very levels.
Please let me know your thoughts! 🙏🏾

H4 INTRA-DAY IDEAIntra-Day Buy Model Idea
DISCLAIMER:
The owner of this page is an authorised Representative under supervision of TD MARKETS (PTY) LTD, an authorised Financial Services Provider (FSP No. 49128) licensed by the Financial Sector Conduct Authority (FSCA) under the Financial Advisory and Intermediary Services Act (FAIS).
The FSP is licensed to provide advice and intermediary services in respect of Category I financial products, including but not limited to derivative instruments, long-term deposits, and short-term deposits.
All investment ideas are provided in accordance with the scope of the FSP's license and applicable regulatory requirements. Derivative instruments is a leveraged products that carry high risks and could result in losing all of your capital, and past performance is not indicative of future results.
This idea and any attachments are informational/education and does not constitute advice.
No guarantee is made regarding the accuracy or outcome of this trade idea.
If you choose to accept this idea, please do so at your own risk.
Us100I previously shared an analysis where I gave a buy entry and then sold it. While it didn't occur under the conditions I anticipated, the sell-off did occur. Now, in this analysis, I project that wave 4 has already ended, so the start of wave 5-5-of-3 appears as a major pattern.

US100: SCENARIO 3 IF PREVIOUS 2 IDEAS FAILBearish Market Structure Shift (-MSS) is imminent if Price Action follows what I have denoted in this trade idea.
DISCLAIMER:
The owner of this page is an authorised Representative under supervision of TD MARKETS (PTY) LTD, an authorised Financial Services Provider (FSP No. 49128) licensed by the Financial Sector Conduct Authority (FSCA) under the Financial Advisory and Intermediary Services Act (FAIS).
The FSP is licensed to provide advice and intermediary services in respect of Category I financial products, including but not limited to derivative instruments, long-term deposits, and short-term deposits.
All investment ideas are provided in accordance with the scope of the FSP's license and applicable regulatory requirements. Derivative instruments is a leveraged products that carry high risks and could result in losing all of your capital, and past performance is not indicative of future results.
This idea and any attachments are informational/education and does not constitute advice.
No guarantee is made regarding the accuracy or outcome of this trade idea.
If you choose to accept this idea, please do so at your own risk.

US100 HTF MARKET OUTLOOKMMSM (Market Maker Sell Model) is imminent if Price Action follows what I have denoted in this trade idea.
DISCLAIMER:
The owner of this page is an authorised Representative under supervision of TD MARKETS (PTY) LTD, an authorised Financial Services Provider (FSP No. 49128) licensed by the Financial Sector Conduct Authority (FSCA) under the Financial Advisory and Intermediary Services Act (FAIS).
The FSP is licensed to provide advice and intermediary services in respect of Category I financial products, including but not limited to derivative instruments, long-term deposits, and short-term deposits.
All investment ideas are provided in accordance with the scope of the FSP's license and applicable regulatory requirements. Derivative instruments is a leveraged products that carry high risks and could result in losing all of your capital, and past performance is not indicative of future results.
This idea and any attachments are informational/education and does not constitute advice.
No guarantee is made regarding the accuracy or outcome of this trade idea.
If you choose to accept this idea, please do so at your own risk.

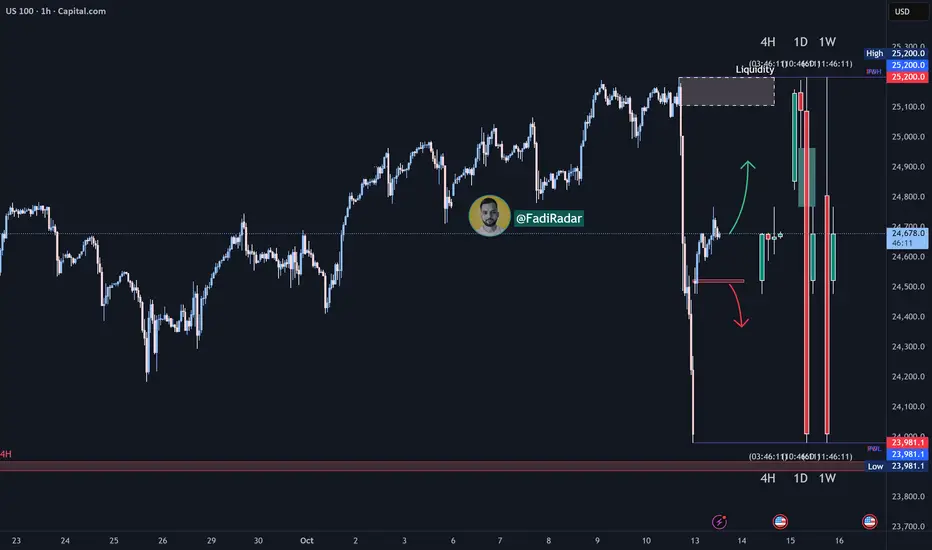
us100 turtle soupUS100 has received good liquidity on the hourly chart. If it becomes clear that it's a turtle soup at the opening, it might make sense to buy as I've shown on the chart.

NASDAQ Faces Downside Risk Amid Tariff and Shutdown UncertaintyUSNAS100 – Technical Outlook Aligned with Fundamentals
The Nasdaq 100 fell sharply on Friday, losing nearly 1,200 points within six hours as it retreated from its all-time high.
The drop came amid renewed U.S.–China tariff tensions and growing uncertainty from the ongoing U.S. government shutdown, which has delayed key economic data releases and weighed on sentiment ahead of third-quarter earnings season.
Technically, the index is showing clear bearish pressure, and sellers will likely maintain control while the price remains below 23,930.
A short-term corrective rebound toward 24,160 – 24,350 is possible before renewed downside momentum.
If the price closes a 1H or 4H candle below 23,930, it would confirm a continuation of the bearish trend, opening the way toward 23,700 → 23,500 → 23,350.
Conversely, as long as the index trades above 23,930, limited corrections may occur, but overall bias remains weak under current macro headwinds.
Pivot Line: 23,930
Support Levels: 23,700 / 23,500 / 23,350
Resistance Levels: 24,160 / 24,340 / 24,480
Summary:
Fundamental headwinds — from tariff threats to the shutdown’s data vacuum — are fueling pressure on tech stocks.
Technically, bias stays bearish below 23,930, with a potential correction toward 24,350 before continuation to the downside.

THE ULTIMATE CHESS MATCH...THE FINANCIAL MARKETSHey hey everybody JosePips here!!! Just wanted to drop a fire video about how we as retail traders should be approaching these markets, what they truly represent, & how we are witnessing the ultimate chess match take place...so let's dive in to what I go through in this video
1. The mindset behind the markets: People & Money
2. What the markets represent: the ultimate chess match
3. The chess match between buyers & sellers
4. The RETAIL ADVANTAGE: 3rd party witnesses
5. The business of the markets
6. How WE as RETAIL participants can UTILIZE this chess match to create our trading/business decisions with PROBABILITY
OK guys! I dropped some heat in this video! Hope you all enjoy & REMEMBER...EMOTIONAL trading is not trading..it's just hope :)
Cheers!!

NASDAQ 100 – Technical Breakdown Meets Fundamental RealityAfter months of relentless buying, the tech sector’s engine is finally sputtering.
The recent sharp drop from the highs wasn’t random — it reflects growing macro tension and liquidity tightening that’s starting to bite risk assets.
🧩 The Fundamental Story
Yields & Liquidity:
Long-term Treasury yields remain stubbornly elevated despite the Fed’s cautious tone. This indicates the market is pricing in structural inflation rather than trusting the “soft landing” narrative. Higher yields mean tighter financial conditions — bad news for richly valued growth stocks.
Earnings Fatigue:
Recent earnings season showed early cracks: slowing cloud growth, cautious forward guidance, and shrinking profit margins. Even AI-related optimism can’t offset the broader deceleration.
China & Trade Risks:
Renewed U.S.–China trade friction and export restrictions on high-end chips are dampening sentiment in the semiconductor and tech hardware sectors — key NASDAQ components.
Fed Policy Uncertainty:
With inflation sticky above 3% and unemployment starting to rise, the Fed is cornered. A rate cut could come late — but only after more market pain.
📊 Technical Outlook (4H Chart)
The chart structure shows a clear break of the bullish sequence.
Support lost at 24,580 triggered heavy volume selling.
Current price is consolidating near 24,000 — the make-or-break zone.
Below 23,650, momentum sellers could accelerate the drop toward 23,000–23,050 (next key demand).
Any short-term bounce into 24,460–24,580 may act as a retest before another leg lower.
🎯 Trading Plan
Bias: Bearish below 24,460
Possible retest zone: 24,260–24,580
Main target: 23,050
Invalidation: Close above 24,880 with renewed bullish momentum
⚠️ Why It Matters
This isn’t just a pullback — it’s a repricing of risk driven by real-world fundamentals:
tightening liquidity, weak earnings, and policy uncertainty.
If the macro backdrop doesn’t shift fast, the NASDAQ could unwind a significant portion of its 2025 gains before year-end.
💬 Discussion
Do you think the Fed will pivot soon enough to save tech stocks from a deeper correction?
Or are we entering a new phase of the cycle where fundamentals finally catch up with price?
👇 Share your thoughts below and follow for more macro + technical insights every week.

NAS100📊 NAS100USD 4H Analysis – Reversal Zones Identified
The Nasdaq 100 has seen a sharp bearish drop, breaking below recent highs with strong momentum. Price is now approaching a key support region where a short-term rebound could take place if buying pressure emerges.
Potential Reversal Zones:
🔹 24,446.9 – Primary support / first potential reaction area.
🔹 24,818.4 – 24,970.5 – Resistance range; watch for possible rejection if price rebounds.
The market remains under bearish pressure, but short-term corrections toward 24,800–25,000 are possible before any continuation of the downtrend.
If the current bearish momentum continues below 24,400, we could see further downside movement.
📈 Bias: Short-term corrective bounce within a broader bearish structure.
🕓 Timeframe: 4H

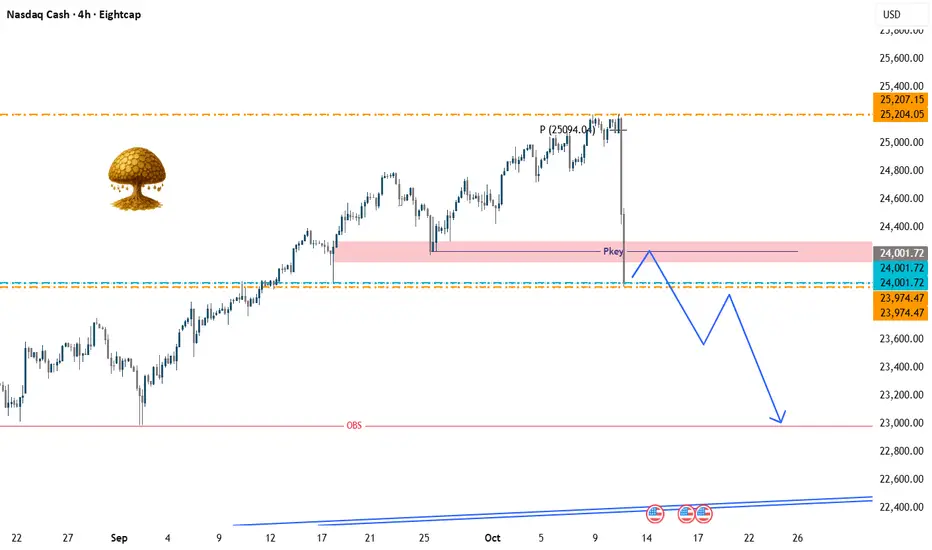
Is the NASDAQ Ready to Drop to 23,000?🏔️ NASDAQ Weekly & Daily Analysis | Bulls vs Bears 🐂🐻
Hey traders! 💥
In the weekly timeframe, NASDAQ is still holding its strong bullish trend, showing solid momentum on higher timeframes.
However, in the daily chart, due to the recent fundamental tensions between China and the U.S., we’re starting to see bearish signs forming.
📊 Trading Plan:
If the market opens without a gap, we may expect a downward move after a possible retest of the Pro Key Level, with the target around 23,000.
Remember — the market is never 100% certain, so make sure you manage your risk and enter only after confirmation in lower timeframes.
⚠️ Heads-up: Tomorrow is a Bank Holiday, so expect lower liquidity and potentially tricky moves.
Trade smart, stay patient, and let the market come to you.
💬 I’d love to hear your thoughts — what’s your bias for NASDAQ this week?
👇 Drop your analysis or opinion in the comments!
🚀 Empowering traders through clarity, confidence & clean charts.
Follow 👉 parisa_tl for more liquidity setups and weekly insights 💙
#NASDAQ #TradingAnalysis #TechnicalAnalysis #PriceAction #SmartMoney #DayTrading #SwingTrading #RiskManagement #TradingCommunity #TradeSmart
US100 BUY IDEA.NASDAQ100 is at a potential level for a buy opportunity. Yeah! We can see how price plummeted on Friday aggressively and closed at 24016 price level. Therefore, a buy opportunity is envisaged from the current price.
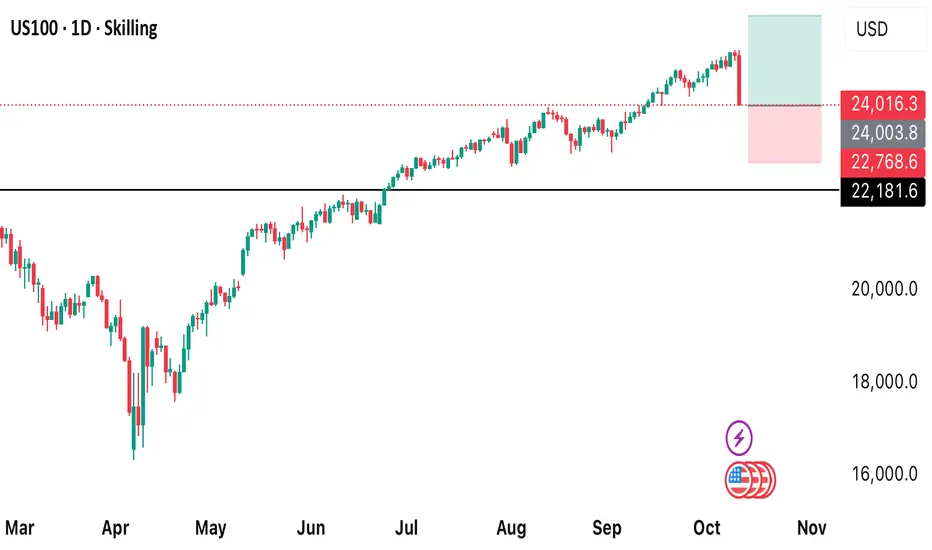
Bullish Idea, bye bye bearsMy Q4 long position 🤔📈
Trend Contiation, bulls are still in control on US equities

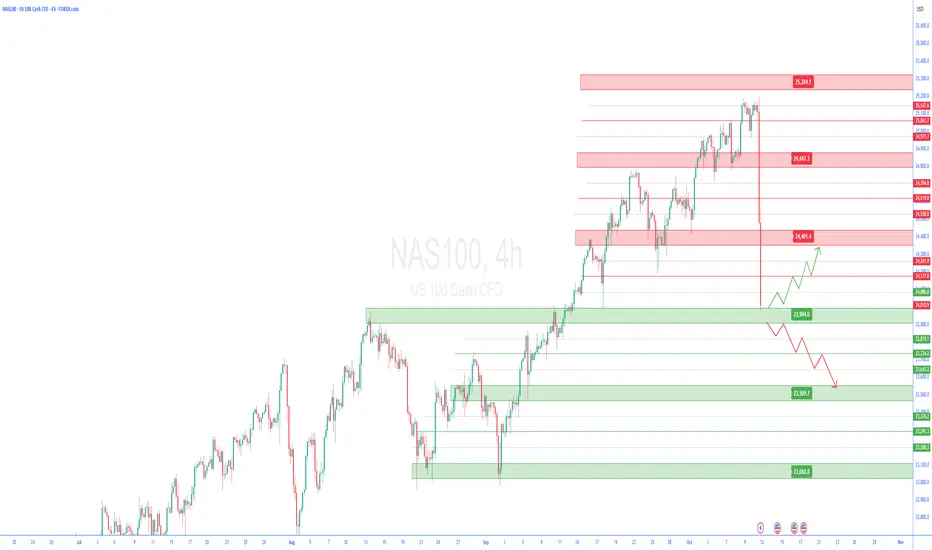
NAS100 4 H🔹 Overall Outlook and Potential Price Movements
In the charts above, we have outlined the overall outlook and possible price movement paths.
As shown, each analysis highlights a key support or resistance zone near the current market price. The market’s reaction to these zones — whether a breakout or rejection — will likely determine the next direction of the price toward the specified levels.
⚠️ Important Note:
The purpose of these trading perspectives is to identify key upcoming price levels and assess potential market reactions. The provided analyses are not trading signals in any way.
✅ Recommendation for Use:
To make effective use of these analyses, it is advised to manually draw the marked zones on your chart. Then, on the 5-minute time frame, monitor the candlestick behavior and look for valid entry triggers before making any trading decisions.
NAS100USD 1M – Tariff Shock After Record HighsThe NAS100 reached a new all-time high earlier this month, extending its recovery from the April 2025 low. However, October has turned into a sharp selloff after Trump’s announcement of a 100% tariff on China starting November 1st, triggering heavy liquidation and breaking multiple support levels. The key focus now is whether the 23,367.28 zone will hold as support or open the way for deeper downside.
Support at: 23,367.28 / 21,800.00 / 16,400.00 / 10,700.00 🔽
Resistance at: 25,249.79 🔼
🔎 Bias:
🔼 Bullish: A monthly close back above 25,249.79 would suggest renewed strength, keeping the long-term uptrend intact.
🔽 Bearish: Failure to hold 23,367.28 confirms October’s selloff continuation, exposing 21,800.00 as the next key downside target.
📛 Disclaimer: This is not financial advice. Trade at your own risk.

NAS100USD 4H – Tariff Shock SelloffAfter maintaining a strong bullish structure, the NAS100 sharply reversed following Trump’s announcement of a 100% tariff on China starting November 1st, triggering a heavy selloff that broke multiple support zones.
Support at: 23,985.8 / 23,700.0 / 23,350.0 🔽
Resistance at: 24,393.3 / 24,583.1 / 24,800.0 / 25,200.0 🔼
🔎 Bias:
🔼 Bullish: Only if price reclaims 24,583.1, confirming a recovery above broken structure.
🔽 Bearish: Continuation expected if candles close below 23,985.8, opening room for a deeper drop toward 23,700.0, 23,350.0, and 23,100.0.
📛 Disclaimer: This is not financial advice. Trade at your own risk.

NAS100 Decision Point at All-Time HighsNAS100 Decision Point at All-Time Highs
Asset: NAS100 (NASDAQ 100) 11th Oct 2025 UTC+4
Closing Price: 24,026.1 | Bias: Neutral, awaiting breakout confirmation.
1. Multi-Timeframe Market Structure
Daily Chart Context: The index is in a powerful, sustained uptrend, trading near all-time highs. The recent consolidation suggests a pause within the broader bullish structure.
Critical Resistance: 24,200 - 24,300. A confluence of the recent swing high and a psychological barrier. A decisive daily close above 24,300 is the key bullish trigger.
Key Support Levels:
Immediate: 23,900 (Recent swing low & 4H consolidation base).
Primary: 23,650 - 23,750 (Previous resistance, now key support & 50 EMA area).
Major: 23,400 (Would signal a deeper correction).
2. Chart Pattern & Wyckoff/Elliott Wave Context
Pattern: The price action from the September low exhibits characteristics of a Wyckoff Accumulation phase, followed by a strong markup. The current pause could be a re-accumulation before the next leg up, or a distribution.
Elliott Wave Count: The rally from the ~23,400 low is impulsive. We are likely in a Wave 4 (corrective) consolidation. A break above 24,200 would confirm the start of Wave 5 towards new highs. A break below 23,650 would invalidate this count.
3. Indicator Confluence & Momentum
Ichimoku Cloud (Daily): Price is well above the Senkou Span (Cloud), confirming the strong bullish trend. The cloud itself is thick and rising, providing strong dynamic support.
RSI (14): On the daily, RSI is neutral (~60), not yet overbought, leaving room for further upside.
Bollinger Bands (4H): Price is hugging the upper band, indicating strength. A move to the middle band (~23,950) would be a healthy pullback.
Moving Averages: The 50 EMA (23,850) and 200 EMA (23,500) are bullishly aligned, acting as dynamic support layers.
Actionable Trading Plan
Intraday Trading (Based on 1H/15M Charts)
Bullish Breakout Setup:
Trigger: Sustained price action above 24,150 with rising volume.
Buy Entry: On a pullback to 24,100-24,130, or a break of 24,200.
Stop Loss: Below 24,000.
Targets: 24,300 (TP1), 24,450 (TP2).
Bearish Rejection Setup:
Trigger: Bearish reversal candle (e.g., Shooting Star, Bearish Engulfing) at 24,150-24,200.
Sell Entry: On the confirmation of the rejection.
Stop Loss: Above 24,250.
Targets: 23,950 (TP1), 23,850 (TP2).
Swing Trading (Based on 4H/Daily Charts)
Long Swing Entry:
Condition: Wait for a daily close above 24,300.
Entry: On the next pullback towards 24,200 (new support).
Stop Loss: Below 23,900.
Target: 24,600 - 24,800.
Short Swing Entry (Counter-Trend):
Condition: A clear break and close below 23,900.
Entry: On a retest of 23,900 as resistance.
Stop Loss: Above 24,100.
Target: 23,750, then 23,650.
Risk & Trade Management Note
The current setup is a high-probability bull trap if price fails at the 24,200 resistance. Conversely, a breakout opens significant upside. Do not chase price in the middle of the range. Patience for a confirmed trigger is key. Always use a stop-loss and manage position size accordingly.