2 Year Trutheries Claims Fed Pivot Soon!Fed claiming to continue rate increases. 2-year treasuries calling, "Bluff"! One of them is lying.
Trade ideas

35. A lesson on INFLATIONFolks,
This is the hottest topic nowadays. Everyone is talking about it. How high will it go? When will it end? The obvious reason being solely to predict when the Fed will pivot.
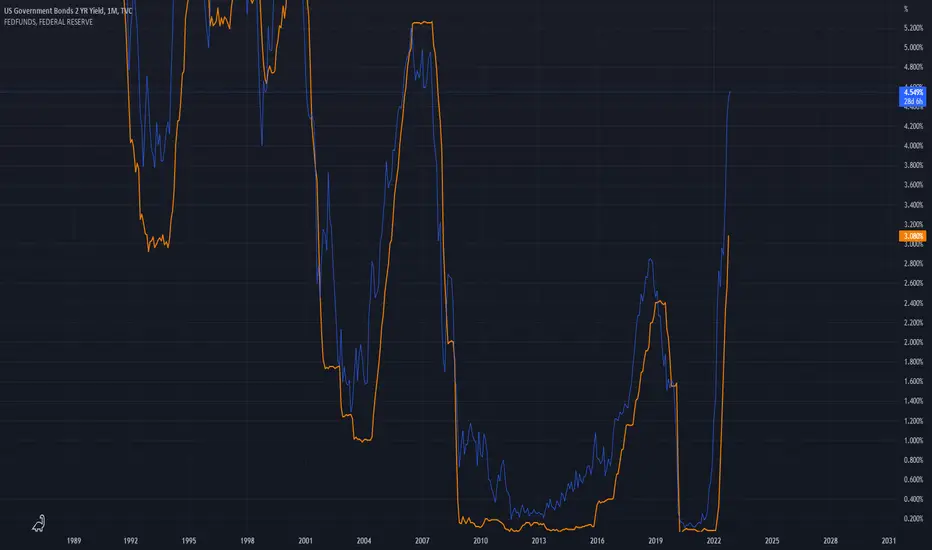
Lets look at the MARKET reaction to date. When 2Q GDP was announced, US02Y drop below the 50MA. This is the market saying the pivot is near. The Fed will stop hiking rates because the economy is contracting and in recession. Since then, the market has sobered up and is now anticipating a 50bps hike next month (current = 2.50% + 0.50 = 3.00%) and is hovering around 3.00%. We can see from this that the MARKET is indeed VERY OPTIMISTIC and is somewhat ignoring the recent DOT PLOT.
But for us, it is best to really understand the situation correctly. This is often not found/mentioned by the MSM. Inflation is a topic best covered in mystery and not easily predictable. Or is it?
Lets use some logic and common sense.
INFLATION WILL END 13 MONTHS FROM THE DATE WHEN THE HIGHEST PRICE WAS RECORDED. And when we talk about price, the easiest would be to use the single most important commodity - OIL. USOIL traded at the high of $129.416 on 8 March 2022 . So regardless of what the Fed do or not do, inflation will start to normalize sometime in March 2023.
Get it? For example, you may be paying $2/gallon. But because of inflation, price suddenly jump up to $5/gallon. Even if price continue to stay at $5/gallon, 13 months later, there would be no inflation as price remain the same y-o-y.
It is just some statistical shitfuckery used by the policy maker to justify that things are back to normal.
That is why the stock market is so 'RESILIENT' - they are just waiting for the coming happy time just a few months away.
That is why the market is so bold to even ignore the DOT PLOT.
Lets continue to monitor the US02Y. And when it really drops below the 50MA and below the FFR, then we might see the Fed finally capitulate to Market Demand.
Good luck.
P/S : As always, do not just believe what I say. Use your common sense.
1) Do not forget beside the FFR, there is also a Balance Sheet Reduction going on. This will impact liquidity and based on latest Fed talk, they are indeed serious about this this time around.
2) There is still a war going on in Ukraine and this has direct impact to EURUSD we are trading. Regardless of pivot or not, the situation in Euro Zone is quite dire. Germany is collapsing and without GAS, they are looking at a DEEP and LONG recession in the coming months.

US02Y: Falling Wedge, Sign of Stronger Dollar Ahead?Hello Fellow Trader/Investor!
Price Action Analysis
US Government Bonds 2 Years Yield is moving above EMA90, indicating a bullish trend. The Falling Wedge Pattern is a bullish continuation pattern confirmed by the recent breakout. The MACD Indicator made a golden cross, signifying a possible upside movement to the target area.
Fundamental Drives
1. The Fed does not reach the 2% Inflation Target Yet
2. Hawkish Fed Position usually makes the bond yields potentially increase, which will cause a bullish dollar outlook.
All other explanations are presented on the chart.
The roadmap will be invalid after reaching the target/ support area.
"Disclaimer: The outlook is only for educational purposes, not a recommendation to put a long or short position on the US02Y"

2-year Treasury yield: hang in there, buddy!As long as we do not see RSI (daily, 14d) prints below 35, I wouldn't call for a trend reversal in years - maybe we'll see 4.00%, but I doubt we'll see 2-year yields come in more. Strategy long = long yields, i.e. short the 2-year Treasury bond.

January 2023 projectionOn July 6th 2022, the 2s / 10s yield curve inverted, and it has widened its gap since then. An inversion of the 2-year, 10-year part of the curve is viewed by many as a reliable signal that a recession is likely to follow in one to two years. On May 27th 2022, US02Y piRSI levels were oversold the same as they are now on December 15th 2022. From May 27th - June 14th 2022, US02Y piRSI spiked and so too did the rate from 2.48% - 3.37%. Yesterday, FOMC Jerome Powell publicly stated that the peak rate will be higher for longer in order to minimize risk of a protracted bout with elevated inflation.
The new batch of quarterly projections from Fed policymakers shows the key overnight lending rate rising to 5.1% in 2023 and easing to 4.1% in 2024. The Fed now expects the unemployment rate to rise to 4.6% next year as GDP growth slows to zero. Wednesday 12/14/22, tickerTracker MFI crossed under the 50 level for ETF's SPY, DIA, QQQ & IWM. With all things considered, including Christmastime market seasonality and the above mentioned fundamental and technical analysis. The probability for January 2023 is for US20Y to spike up and US equity markets to go down as the new fear will be a downgraded MegaCap earnings season with recession looming on the horizon.
Do your own due diligence, your risk is 100% your responsibility. This is for educational and entertainment purposes only. You win some or you learn some. Consider being charitable with some of your profit to help humankind. Good luck and happy trading friends...
*3x lucky 7s of trading*
7pt Trading compass:
Price action, entry/exit
Volume average/direction
Trend, patterns, momentum
Newsworthy current events
Revenue
Earnings
Balance sheet
7 Common mistakes:
+5% portfolio trades, capital risk management
Beware of analyst's motives
Emotions & Opinions
FOMO : bad timing, the market is ruthless, be shrewd
Lack of planning & discipline
Forgetting restraint
Obdurate repetitive errors, no adaptation
7 Important tools:
Trading View app!, Brokerage UI
Accurate indicators & settings
Wide screen monitor/s
Trading log (pencil & graph paper)
Big, organized desk
Reading books, playing chess
Sorted watch-list
Checkout my indicators:
Fibonacci VIP - volume
Fibonacci MA7 - price
pi RSI - trend momentum
TTC - trend channel
AlertiT - notification
tickerTracker - MFI Oscillator
www.tradingview.com

US 2 Year Starting To Creep HigherThis melt-up in the 2yr has seen the breaks put on in the stock rally. Have to see how things look after January. The Fed might remain more hawkish for longer than expected.

BONDS YIELD PREDICTION!!!!! US02YDESCRIPTION: In the chart above I have provided a macro analysis for 2 year bond yield on the Daily Timeframe.
POINTS:
1. Since the beginning of this upward trend on January 2022 we have seen that bonds and the overall market are said to share an inverse relationship but during pivotal moments that has not been the case as you can see that the stock market has risen along with bonds and vise versa .
2. Deviation in SUPLY & DEMAND POCKETS is clearly shown to be every 1% RISE IN YIELDS . (Refer to BLUE & ORANGE Horizontal Lines)
3. Before entry is made into a new DEMAND POCKET price action has a distinctive pump that has occurred several times. (Refer to white lines between SUPPLY & DEMAND POCKETS).
4. Predicted rise was formulated by using the average of previous last two pumps of +40.92% and +54.21% = +48% when rounded.
5. Average does in fact coincide with previous point of resistance when bond yields rose to 6% in the early 2000's. (A POINT THAT I WOULD CONSIDER TO BE A PIVOT POINT)
6. When you observe MACD we can also conclude that downward pressure is looking for relief like in past occasions.
SCENARIO #1: Bond Yields continue to rise and follow uptrend into early 2023 which can then signify that a market bottom is yet to be confirmed.
SCENARIO #2: Bond Yields break crucial SUPPORT OF 4.000% and will invalidate current setup. Possibly being followed by capitulation in the stock market since falls in yields seem to be more closely tied to falls in the overall market than the inverse relationship.
TVC:US02Y

2 y 5 y 10 y bonds butterfly idea and historical returns hello
does anyone find me please an historical returns of a butterfly spread as follow -
long 1 2 years bond
short 2 5 years bond
long 1 10 years bond.
Does that make sense ?
It is a combination of 3 legs , using 3 instruments.
I am looking for some history and historical returns .
Thnak you

2Yr Yield creeping up slowly$TNX is closed atm but if the 2yr is an indication it may open higher
We re-entered long yield after FED day in DEC.
Sold puts on $TYO & bought common
Didn't go heavy because Monthly chart is a tad tough.
Weekly 2yr trading decently above avg's again
So far so good.
We were bullish on STOCKS but that was late Oct/Early Nov, then went bearish for a bit, & are now NEUTRAL.
EDIT:
Keep in mind that in BULL MARKETS items can remain OVERBOUGHT for long periods of time.

2yr Treasury note yield, a Monthly look MACD has done a nice job of highlighting the 2yr treasury note yield cycle tops over the past decades. Will be interesting to see how this one works out.

2 Year Treasury Hit Supply from 2007 - Bullish for StocksThis is bullish for stocks if rejects, beautiful monthly shooting star at supply from 2007.

2yr Yield & $TNX2Yr #Yield is close to support @ 4
Look at that weekly performance!
However, monthly shows RSI readings above mid 70 has signified TOPS
ALSO
Depending on how Dec closes $TNX also looking weak
Look @ RSI
What is this telling you?
"Someone" buying loads of #bonds, who & why?

US2Y - FedFunds comes down to zeroUS2Y - FedFunds comes down to zero coincides with fed funds pausing, which is bullish for S&P

US02Y Showing the way to stock market recoveryThe US02Y has just completed a Head and Shoulders (H&S) pattern, which is a technical formation found on tops. The very same formation was last seen in October - December 2018 and caused a massive long-term drop on the US02Y. Check also the identical 1D RSI sequences leading to the top with Channel Down patterns.
The US02Y peak was translated into a fall on inflation (orange trend-line) and the stock market (S&P500 blue trend-line) immediately reacted. We've already seen a strong stock rally these past two months, but so far seems counter-trend.
Do you think the Fed and the CPI report next week can help sustain it?
-------------------------------------------------------------------------------
** Please LIKE 👍, SUBSCRIBE ✅, SHARE 🙌 and COMMENT ✍ if you enjoy this idea! Also share your ideas and charts in the comments section below! This is best way to keep it relevant, support me, keep the content here free and allow the idea to reach as many people as possible. **
-------------------------------------------------------------------------------
You may also TELL ME 🙋♀️🙋♂️ in the comments section which symbol you want me to analyze next and on which time-frame. The one with the most posts will be published tomorrow! 👏🎁
-------------------------------------------------------------------------------
💸💸💸💸💸💸
👇 👇 👇 👇 👇 👇

When does the recession become official?Fed funds rate crossing above the 2 and 10 year yield(s) can give us a pretty good idea...

Is oil price about to collaps ?The history of US. Oil/$ chart vs US02Y-US10Y chart (inverted) : show that the cude price is lagging the move of the US. spread between 2s/10s. "Is oil price is about to collaps ? or this time is diffrent because of OPEC+ cutts ?"

US 2yr Yield Turning OverThe 2yr yield appears to be rolling over which is bullish for stocks. Have to see if there is a weekly reversal

US02Y is the key for stocks and it has started to drop!This is a 1W time-frame chart, showing the correlation between the U.S. Government Bonds 2 YR Yield and the S&P500 (blue trend-line). Some may perceive the recent 2-month rally on stocks as a coincidence but the US02Y price action shows that it is not and has a direct correlation with it.
The 1W RSI on the US02Y has been falling within a Channel Down since the start of February 2022, while at the same time the actual price has been rising within a Channel Up. That is a technical Bearish Divergence. The same Bearish Divergence was last seen from late January 2018 up until the week of November 05 2018. As shown on the chart this lasted 41 weeks (287 days).
The start of this Bearish Divergence happened when the stock market(S&P500) had an initial pull-back event entering into a year long period of volatility, followed buy an even stronger correction. Once the US02Y started to drop, the stock market bottomed and started rising sustainably (until of course the non-technical black Swan event of COVID).
Right now, we are two weeks past the 41 week (287 days) mark and the US02Y has been dropping for 4 weeks. As mentioned, the stock market has been (aggressively) rising since the October 10 2022 1W candle. The fractals are identical and this could be a repeat of the 2019 rally. Whether we see it extending or not, the US20Y certainly holds the key.
-------------------------------------------------------------------------------
** Please LIKE 👍, SUBSCRIBE ✅, SHARE 🙌 and COMMENT ✍ if you enjoy this idea! Also share your ideas and charts in the comments section below! This is best way to keep it relevant, support me, keep the content here free and allow the idea to reach as many people as possible. **
-------------------------------------------------------------------------------
You may also TELL ME 🙋♀️🙋♂️ in the comments section which symbol you want me to analyze next and on which time-frame. The one with the most posts will be published tomorrow! 👏🎁
-------------------------------------------------------------------------------
💸💸💸💸💸💸
👇 👇 👇 👇 👇 👇

30min tf shows a C wave sell off on 2yr treasury yieldshort term bullish on the 20yr ETF, based on the 2yr/20yr yields temporary falling...

Treasuries After CPIToday’s cooler readings on inflation and jobless claims were welcome news for stock-market bulls. They could be even more important for the Treasury market.
Today we’re considering the yields of the of two-year (US02Y) and 10-year (TNX) notes.
The two-year shot to a 16-year high above 4.8 percent on November 4 after non-farm payrolls but failed to hold: a shooting star. It’s also noteworthy that the data had a touch of “Goldilocks,” with total jobs and unemployment both higher than forecast. Those headlines, and subsequent lows, potentially confirm the shooting star as a reversal pattern.
There’s also a rising trendline along the lows of August and September that was broken on Thursday. Both events may suggest two-year Treasury yields have peaked.
Next is the weekly chart of 10-year Treasury yields. They touched 4.33 percent in mid-October, the highest level since June 2008. Two inside weekly candles followed, potentially indicating a halt to the uptrend.
These patterns together, combined with the Euro solidly back above parity, could mark a change from the kind of price action that’s characterized most of 2022. It could have a positive impact on broader sentiment if it continues.
TradeStation has, for decades, advanced the trading industry, providing access to stocks, options, futures and cryptocurrencies. See our Overview for more.
Important Information
TradeStation Securities, Inc., TradeStation Crypto, Inc., and TradeStation Technologies, Inc. are each wholly owned subsidiaries of TradeStation Group, Inc., all operating, and providing products and services, under the TradeStation brand and trademark. You Can Trade, Inc. is also a wholly owned subsidiary of TradeStation Group, Inc., operating under its own brand and trademarks. TradeStation Crypto, Inc. offers to self-directed investors and traders cryptocurrency brokerage services. It is neither licensed with the SEC or the CFTC nor is it a Member of NFA. When applying for, or purchasing, accounts, subscriptions, products, and services, it is important that you know which company you will be dealing with. Please click here for further important information explaining what this means.
This content is for informational and educational purposes only. This is not a recommendation regarding any investment or investment strategy. Any opinions expressed herein are those of the author and do not represent the views or opinions of TradeStation or any of its affiliates.
Investing involves risks. Past performance, whether actual or indicated by historical tests of strategies, is no guarantee of future performance or success. There is a possibility that you may sustain a loss equal to or greater than your entire investment regardless of which asset class you trade (equities, options, futures, or digital assets); therefore, you should not invest or risk money that you cannot afford to lose. Before trading any asset class, first read the relevant risk disclosure statements on the Important Documents page, found here: www.tradestation.com .


Price Expectations On Point - But Few Expected ThisTraders,
This week we'll have a look at recent price action, current sentiment, and what might be driving these huge pops in the altcoin space.
Stew

75 basis points predicted movepeople are predicting a 75 basis points move yet we need something like 150 lol