Lingrid | USDCAD Sideways Market Long Opportunity FX:USDCAD has been trading within a clear sideways channel after facing strong rejection from the resistance zone near 1.3925. Price has since formed a lower high and dipped into the 1.3764–1.3693 support region, where buyers are attempting to stabilize. A bounce from this demand area could fuel a recovery toward 1.3850, but the broader structure remains corrective unless price clears above the descending trendline.
⚠️ Risks:
A sustained break below 1.3765 would expose 1.3700 and the deeper support area.
Stronger crude oil prices could strengthen the CAD and weigh on USDCAD.
Unexpected hawkish Fed comments may disrupt the short-term rebound scenario.
If this idea resonates with you or you have your own opinion, traders, hit the comments. I’m excited to read your thoughts!
USDCAD trade ideas

USDCAD: Bulls Targeting Higher ResistanceUSDCAD: Bulls Targeting Higher Resistance
USDCAD is showing bullish momentum after bouncing from recent lows.
The price is now heading upward, aiming first for the resistance area around 1.3882.
If this level breaks and holds, the next target lies near 1.3920, which is a stronger resistance zone.
As long as the price remains above recent higher lows, buyers may continue to be in control.
A rejection from resistance could cause a short-term pullback, but the overall outlook favors more upside movement.
You may find more details in the chart!
Thank you and Good Luck!
❤️PS: Please support with a like or comment if you find this analysis useful for your trading day❤️

USDCAD – Head & Shoulders Pattern with Trendline BreakOn the 4H chart of USDCAD, a potential Head & Shoulders formation is visible, with the left shoulder, head, and right shoulder already marked. Price has also broken below the rising trendline, suggesting a possible bearish structure shift.
Key points:
Head & Shoulders pattern completed.
Trendline break adds confluence.
Price is currently retesting the broken zone.
A continuation to the downside may develop if sellers remain in control.
This analysis is shared for educational purposes only. It is not financial advice—always do your own research and follow your trading plan.

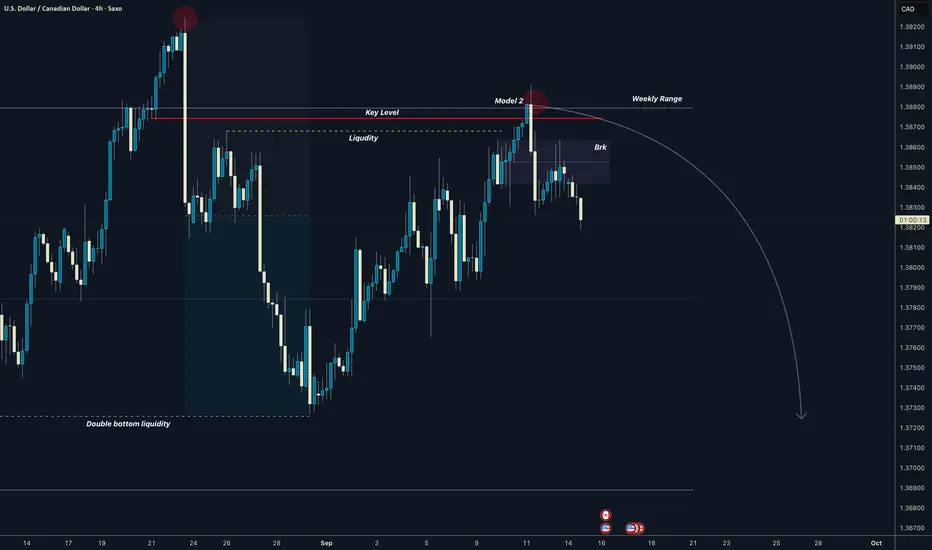
USDCAD Weekly Range Model 2Bearish setup from the weekly range retest from the key level.
Weekly Range manipulated
Price dropped down and created double bottom = Liqudity
Pullback to the Premium liquidity
Rejection + Breaker
Targeting 50% of Range and Double bottom , then Range low
Note: FOMC this week. it can be volatile.
Good luck
David Perk aka Dave FX Hunter
USD/CAD 4H chart:USD/CAD 4H chart:
Current price: ~1.3753
Support zone: ~1.3720 – 1.3730 (where price has bounced)
First target (TP1): ~1.3835 – 1.3840 (next resistance zone)
Second target (TP2): ~1.3915 – 1.3920 (major resistance zone at the top)
So the trade plan shown in chart is:
✅ Entry from support ~1.3730
🎯 Target 1 → ~1.3840
🎯 Target 2 → ~1.3920

4H USD/CAD Head + Shoulders PatternWaiting for potential break and retest of the 1.37200 level. If this happens, I’ll be watching USD/CAD on a lower timeframe in order a for a better entry. I’ll be placing my TP around the 1.3600 level and my SL around the 1.37400 level.

USDCAD Analysis: Bearish Reversal Signal ? 👋Hello everyone, it's great to see you again! Let’s take a look at OANDA:USDCAD !
Here’s my perspective:
USDCAD has formed a Head and Shoulders pattern, signaling a potential bearish reversal. The price recently tested the 1.386 level and is now heading lower. The next target is approaching an important trendline support.
What do you think about this currency pair? Feel free to share your thoughts, and let’s discuss it!

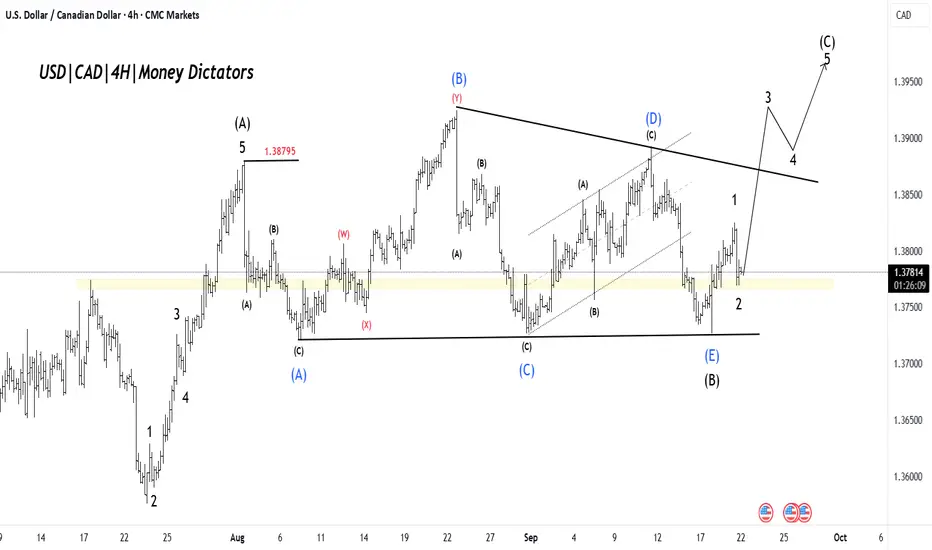
USDCAD: Impulse Wave Points to Higher LevelsUSD/CAD Price is showing the early stages of a bullish (C) leg after a large corrective sequence. The chart labels show a completed corrective (B) low at the horizontal support and an impulsive 1–2 sequence unfolding for the new upward leg. Bias: bullish while price holds above the demand zone/wave-2 low.
The market completed an ABC correction that found support on the horizontal lower boundary. That corrective phase looks finished; we should now be in wave (C) up, the final leg of the correction.
Short-term momentum has flipped, with buyers stepping in at support. This favors trend-following longs into the extension leg (wave 3 → 5)
Target 1 (T1): 1.38408
Target 2 (T2): 1.38810
Stop-Loss (SL): 1.37195
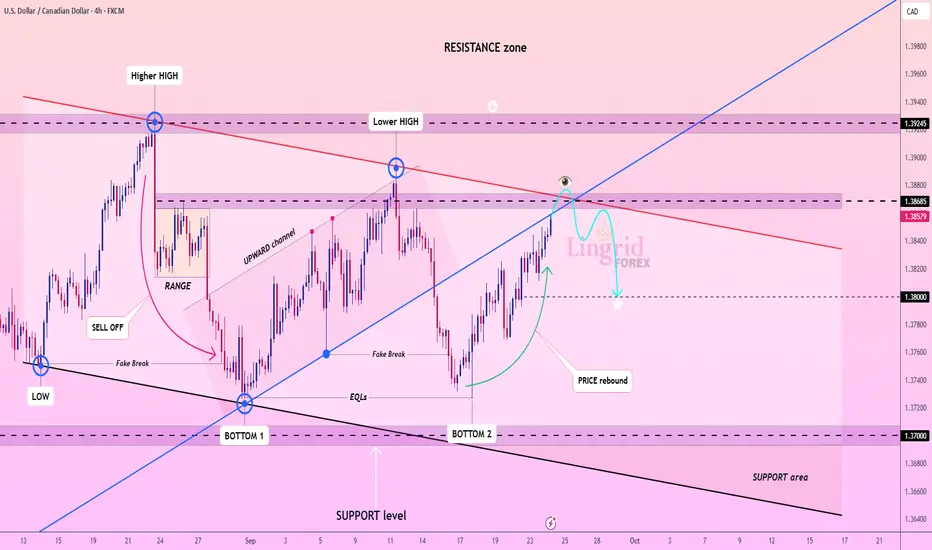
Lingrid | USDCAD Short at Resistance Following Rejection SignalThe price perfectly fulfilled my previous idea . FX:USDCAD rebounded strongly from the double bottom around 1.3700 and is now climbing within an upward channel. The structure shows lower highs capped by the red resistance trendline, while buyers attempt to sustain momentum toward 1.3868–1.3924 resistance. If price fails to break and hold above 1.3868, a rejection could send it back toward 1.3800 support. Broader context suggests a corrective upswing inside a larger resistance zone where sellers remain active.
⚠️ Risks:
A clean breakout above 1.3924 would invalidate the sell bias and extend the bullish leg.
Strong USD momentum from macroeconomic data could fuel further upside.
Failure of the 1.3800 support could trigger deeper volatility spikes.
If this idea resonates with you or you have your own opinion, traders, hit the comments. I’m excited to read your thoughts!
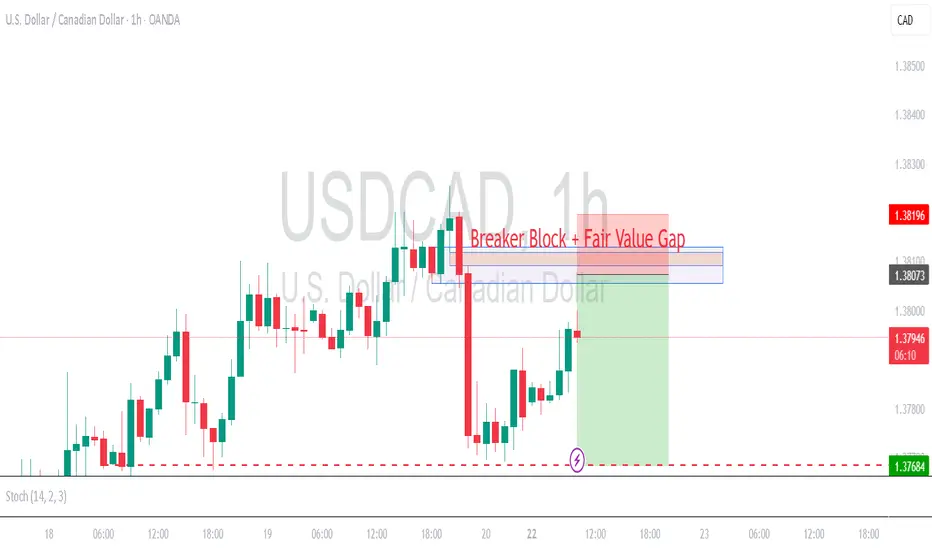
Monday 22 Sep Mapping for USDCAD : positioning for bearish moveWe observed strong bearish candle on Friday (bearish engulfing candle).
Today during Asian session we observed the price doing a healthy retracement.
I'm expecting the price to touch H1 Fair Value Gap area before dive for another bearish movement.
This is my mapping for USDCAD today for my future reference.
if you want to follow, make sure you calculate your own risk & reward.
Good Luck & happy trading.
USD/CAD - Bearish Flag (15.09.2025)The USD/CAD Pair on the M30 timeframe presents a Potential Selling Opportunity due to a recent Formation of a Bearish Flag Pattern. TRADENATION:USDCAD
This suggests a shift in momentum towards the downside in the coming hours.
Possible Short Trade:
Entry: Consider Entering A Short Position around Trendline Of The Pattern.
Target Levels:
1st Support – 1.3814
2nd Support – 1.3796
🎁 Please hit the like button and
🎁 Leave a comment to support for My Post !
Your likes and comments are incredibly motivating and will encourage me to share more analysis with you.
Best Regards, KABHI_TA_TRADING
Thank you.

Bullish bounce off major support?The Loonie (USD/CAD) is reacting off the pivot, which acts as an overlap support and could bounce to the 1st resistance, which is an overlap resistance that is slightly below the 50% Fibonacci retracement.
Pivot: 1.3755
1st Support: 1.3568
1st Resistance: 1.4015
Disclaimer:
The above opinions given constitute general market commentary, and do not constitute the opinion or advice of IC Markets or any form of personal or investment advice.
Any opinions, news, research, analyses, prices, other information, or links to third-party sites contained on this website are provided on an "as-is" basis, are intended only to be informative, is not an advice nor a recommendation, nor research, or a record of our trading prices, or an offer of, or solicitation for a transaction in any financial instrument and thus should not be treated as such. The information provided does not involve any specific investment objectives, financial situation and needs of any specific person who may receive it. Please be aware, that past performance is not a reliable indicator of future performance and/or results. Past Performance or Forward-looking scenarios based upon the reasonable beliefs of the third-party provider are not a guarantee of future performance. Actual results may differ materially from those anticipated in forward-looking or past performance statements. IC Markets makes no representation or warranty and assumes no liability as to the accuracy or completeness of the information provided, nor any loss arising from any investment based on a recommendation, forecast or any information supplied by any third-party.

USDCAD: A Sell Opportunity You Can't MissLooking at the USDCAD chart, we can see that price is moving within a descending channel with lower highs. Currently, price is testing the upper boundary of this channel. In the past, sellers have successfully defended this level multiple times, and the current market structure suggests we may see another rejection here.
If that happens, setting up a short position would be straightforward. Our target would be around 1.38150, a reasonable objective based on this setup, where a price retracement or even a strong decline could occur. The current trend remains bearish, and in descending channels like this, going with the trend is generally a better strategy than fighting it.
Until buyers convincingly break this descending channel, sellers remain in control, and the opportunity to trade with the trend is still very clear.
Do you see it this way as well?

USDCAD Bounce back showing bullish consolidation momentumUSDCAD is currently showing bullish consolidation momentum after bouncing from recent lows. The pair is trending upward with an initial If the price holds above recent support and continues to maintain upward structure, buyers are likely to stay in control, favouring further upside toward the 1.3880 resistance zone.
A rejection from resistance levels could trigger a short-term pullback. However, unless the price breaks decisively below recent lows, the broader momentum remains in favour of the upside.
Bias: Overall, the technical structure favours bullish momentum, with short-term corrections offering potential buying opportunities.
You any find more details in the chart.
Trade wisely best Of Luc.
Ps; Support with like and comments for better analysis Thanks for Supporting.

Double Blow for the USD/CAD MarketDouble Blow for the USD/CAD Market
Today, the USD/CAD market faces a “double blow” from central banks:
→ At 16:45 GMT+3, the Bank of Canada will announce its decision. The rate is expected to be cut from 2.75% to 2.50%.
→ At 21:00 GMT+3, the Federal Reserve will follow with its own rate announcement.
Both events will be accompanied by statements from the central bank chairmen on future outlooks, and the USD/CAD market is likely to experience heightened volatility today.
Technical Analysis of the USD/CAD Chart
When analysing the USD/CAD chart earlier this month, we noted the formation of a symmetrical narrowing triangle (a sign of balance between supply and demand), bounded by:
→ a long-term descending channel (red), which has been in place since early February;
→ a short-term channel (blue), shaped by price fluctuations since mid-summer.
At that time, we suggested that supply and demand forces would keep USD/CAD in a temporary state of equilibrium until today.
Since then:
→ the price has reversed sharply from the upper boundary of the triangle (marked with an arrow);
→ on the eve of key announcements, the pair is attempting to consolidate below the lower boundary, signalling bearish pressure (in other words, a shift in balance in favour of supply).
Key observations:
→ the aggressive nature of the September support breakout (S);
→ the decline towards the critical 1.3725 level, which has acted as support since August.
Given the above, we could assume that the market is leaning bearish. Today’s announcements could trigger a downward impulse in USD/CAD – in this context, the chart may be interpreted through:
→ a potential breakout of the bearish flag pattern (formed by the blue channel);
→ prospects for the resumption of the broader downtrend within the red channel.
This article represents the opinion of the Companies operating under the FXOpen brand only. It is not to be construed as an offer, solicitation, or recommendation with respect to products and services provided by the Companies operating under the FXOpen brand, nor is it to be considered financial advice.

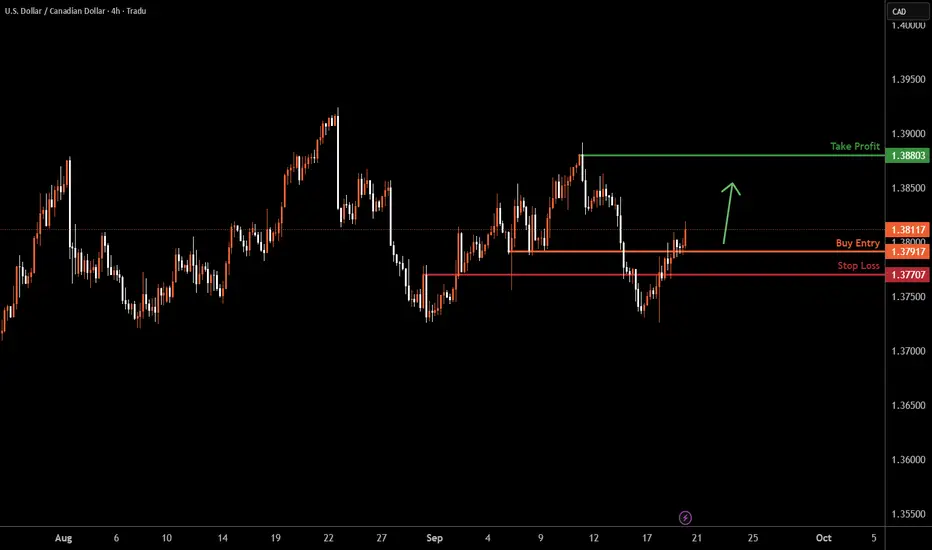
USDCAD H4 | Bullish reversalUSD/CAD has bounced off the buy entry which is an overlap support and could rise from this leve to the upside.
Buy entry is at 1.3791, which is a pullback support.
Stop loss is at 1.3770, whichis a pullback support.
Take profit is at 1.3880, which acts as a swing high resistance.
High Risk Investment Warning
Trading Forex/CFDs on margin carries a high level of risk and may not be suitable for all investors. Leverage can work against you.
Stratos Markets Limited (tradu.com ):
CFDs are complex instruments and come with a high risk of losing money rapidly due to leverage. 65% of retail investor accounts lose money when trading CFDs with this provider. You should consider whether you understand how CFDs work and whether you can afford to take the high risk of losing your money.
Stratos Europe Ltd (tradu.com ):
CFDs are complex instruments and come with a high risk of losing money rapidly due to leverage. 66% of retail investor accounts lose money when trading CFDs with this provider. You should consider whether you understand how CFDs work and whether you can afford to take the high risk of losing your money.
Stratos Global LLC (tradu.com ):
Losses can exceed deposits.
Please be advised that the information presented on TradingView is provided to Tradu (‘Company’, ‘we’) by a third-party provider (‘TFA Global Pte Ltd’). Please be reminded that you are solely responsible for the trading decisions on your account. There is a very high degree of risk involved in trading. Any information and/or content is intended entirely for research, educational and informational purposes only and does not constitute investment or consultation advice or investment strategy. The information is not tailored to the investment needs of any specific person and therefore does not involve a consideration of any of the investment objectives, financial situation or needs of any viewer that may receive it. Kindly also note that past performance is not a reliable indicator of future results. Actual results may differ materially from those anticipated in forward-looking or past performance statements. We assume no liability as to the accuracy or completeness of any of the information and/or content provided herein and the Company cannot be held responsible for any omission, mistake nor for any loss or damage including without limitation to any loss of profit which may arise from reliance on any information supplied by TFA Global Pte Ltd.
The speaker(s) is neither an employee, agent nor representative of Tradu and is therefore acting independently. The opinions given are their own, constitute general market commentary, and do not constitute the opinion or advice of Tradu or any form of personal or investment advice. Tradu neither endorses nor guarantees offerings of third-party speakers, nor is Tradu responsible for the content, veracity or opinions of third-party speakers, presenters or participants.
Will USD/CAD Finally Respect the PRZ?Price is pressing right into a Potential Reversal Zone (PRZ) that lines up perfectly with an AB=CD completion and a long-standing resistance shelf on the 1-hour chart.
The market has been grinding higher for days, but the structure is hinting that the next decisive move may be down—not up.
Here’s why I’m interested, but still waiting for confirmation before pulling the trigger.
🔍 Technical Setup
Pair / TF: USD/CAD – 1 Hour
Trend: Short-term bullish, but extended and showing fatigue
Pattern: AB=CD harmonic completion (no other harmonic pattern)
Key Zones:
PRZ / Resistance: 1.3865 – 1.3875
Support / Trigger area: 1.3830
Structure Clue: If price breaks the latest Higher Low (HL) and prints a fresh Lower Low (LL), it signals that buyers are losing grip and sellers may step in with force.
Divergence: RSI(14) shows bearish divergence (price making higher highs while RSI makes lower highs) — a classic early-warning sign that upside momentum is fading.
🌐 Sentiment & Fundamentals
Retail Sentiment (myfxbook): 32 % short / 68 % long → majority long means there’s fuel for a quick stop-driven drop if price reverses.
USD Index (DXY): bearish bias after recent Fed remarks about a slower pace of hikes and cooling inflation signals.
CAD Index: bullish tone, supported by firm crude oil demand and a Bank of Canada still talking hawkish.
Macro Backdrop:
US–Canada 2-year yield spread has narrowed slightly, favoring CAD strength.
Crude oil holding above key supports strengthens the Canadian dollar further.
These fundamental drivers add conviction to a bearish bias if technical confirmation appears.
🛠️ Trade Plan (only if conditions trigger)
Entry (Sell Stop): 1.38308 — waiting for HL break and a clean LL close to confirm sellers in control.
Stop Loss: 1.38584 (just above PRZ and recent highs).
Target (TP1): 1.38032
Position Size: 0.5 lot (on ~USD 10 K account).
Risk/Reward: 1 : 1 (~$100 risk for ~$100 reward).
Risk Management: If price never breaks HL and instead keeps climbing, no trade is taken — capital stays safe.
🎯 Bias
Although the short-term trend is still technically up, the confluence of PRZ resistance, AB=CD completion, bearish RSI divergence, bearish USD index, and bullish CAD index keeps my bias cautiously bearish — but only with breakdown confirmation.
💡 Takeaway
This is a wait-for-breakdown idea, not a blind short.
If price slices through 1.3830, the door opens for a quick momentum drop toward 1.3810 (and possibly 1.3785 if oil strength continues).
If it doesn’t, I stay flat and safe.
💬 Share Your View
What’s your take on USD/CAD here? Drop your thoughts in the comments and let’s discuss the levels.
✅ Follow me for more trade ideas and signals — stay ahead of key setups like this one.
⚠️ Disclaimer
This analysis is for educational purposes only and does not constitute financial advice.
Trading involves risk — always do your own research and manage risk carefully. Past performance ≠ future results.
#USDCAD #forex #forextrading #fxtrader #priceaction #technicalanalysis #fundamentalanalysis #ABCDpattern #harmonicpattern #RSIdivergence #bearishdivergence #PRZ #potentialreversalzone #supportandresistance #chartanalysis #tradingsetup #tradeplan #riskmanagement #forexsignals #forexstrategy #currencytrading #majorpairs #dxy #crudeoil #canadiandollar #usdollar #tradingview #marketanalysis #daytrader #swingtrader #priceactiontrader #smartmoneyconcepts #liquiditygrab #lowerlow #higherlow #bearishsetup #shortsetup #fxsignals #forexeducation #tradewithplan #waitforconfirmation


USDCAD Breakdown Ahead? Seasonality & COT Divergence1. Retail Sentiment
59% short vs. 41% long: retail traders are moderately short on USD/CAD.
This leaves room for a potential upside squeeze, but positioning is not extreme, so the contrarian signal remains only partial.
2. COT Report
US Dollar (COT):
Large Speculators net short USD (–5,558 contracts).
Commercials net long USD (+6,642 contracts).
→ Speculators are unloading USD, pointing to structural weakness.
Canadian Dollar (COT):
Large Speculators net short CAD (–108,917 contracts).
Commercials net long CAD (+115,041 contracts).
→ A classic pattern: commercials are buying CAD while speculators remain heavily short. Historically, such extreme divergence often precedes CAD appreciation phases.
COT Summary:
USD: weakness from speculators.
CAD: commercials strongly long, speculators extremely short.
→ Clear divergence: potential CAD strength, bearish bias for USD/CAD.
3. Seasonality
September has historically been bearish for USD/CAD:
–0.37% over the last 20 years.
Also negative on 10- and 2-year averages, more mixed on 5 years.
The second half of the month tends to favor CAD strength.
4. Technical Outlook
Supply Zone: 1.3850–1.3900 (key resistance repeatedly tested and rejected).
Demand Zone: 1.3700–1.3720 (first short target), followed by 1.3600–1.3650.
Structure:
Strong rejection from the 1.3890 area.
Lower highs forming.
50–100–200 MAs in bearish confluence.
Daily rejection candle, confirming downside continuation potential.
5. Trading Plan
Bias: Bearish (short USD/CAD).
Setup:
Short on pullbacks to 1.3840–1.3860.
Target 1: 1.3720.
Target 2: 1.3650.
Invalidation: daily close above 1.3900.
Confluences:
✔ Retail moderately short → room for squeeze, but not extreme.
✔ COT: weak USD + strong CAD commercials → bullish CAD signal.
✔ Seasonality: September historically bearish for USD/CAD.
✔ Technicals: rejection at supply + bearish structure.

USDCAD Will Fall! Short!
Take a look at our analysis for USDCAD.
Time Frame: 1D
Current Trend: Bearish
Sentiment: Overbought (based on 7-period RSI)
Forecast: Bearish
The price is testing a key resistance 1.382.
Taking into consideration the current market trend & overbought RSI, chances will be high to see a bearish movement to the downside at least to 1.373 level.
P.S
Please, note that an oversold/overbought condition can last for a long time, and therefore being oversold/overbought doesn't mean a price rally will come soon, or at all.
Like and subscribe and comment my ideas if you enjoy them!

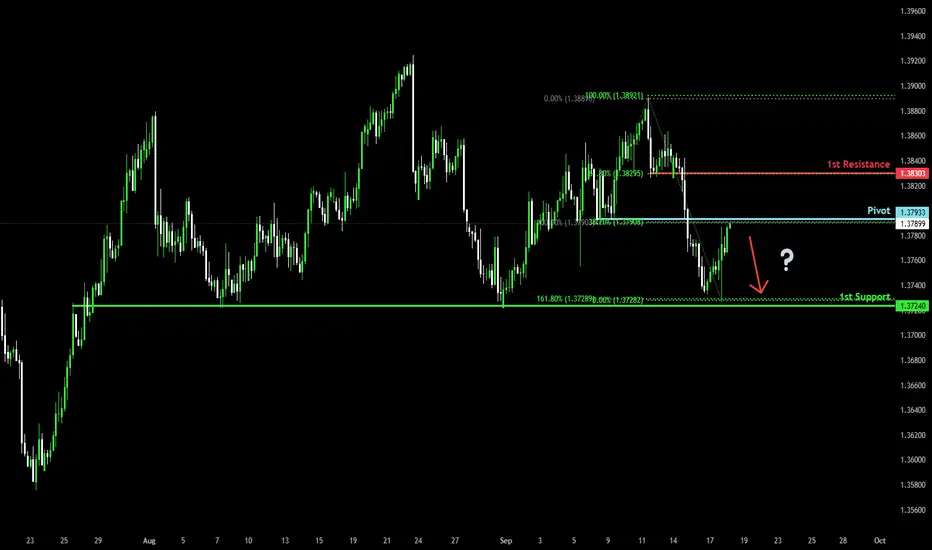
Could the Loonie reverse from here?The price is rising towards the pivot which acts as a pullback resistance that aligns with the 38.2% Fibonacci retracement and could reverse to the 1st support.
Pivot: 1.3793
1st Support: 1.3724
1st Resistance: 1.3830
Disclaimer:
The above opinions given constitute general market commentary, and do not constitute the opinion or advice of IC Markets or any form of personal or investment advice.
Any opinions, news, research, analyses, prices, other information, or links to third-party sites contained on this website are provided on an "as-is" basis, are intended only to be informative, is not an advice nor a recommendation, nor research, or a record of our trading prices, or an offer of, or solicitation for a transaction in any financial instrument and thus should not be treated as such. The information provided does not involve any specific investment objectives, financial situation and needs of any specific person who may receive it. Please be aware, that past performance is not a reliable indicator of future performance and/or results. Past Performance or Forward-looking scenarios based upon the reasonable beliefs of the third-party provider are not a guarantee of future performance. Actual results may differ materially from those anticipated in forward-looking or past performance statements. IC Markets makes no representation or warranty and assumes no liability as to the accuracy or completeness of the information provided, nor any loss arising from any investment based on a recommendation, forecast or any information supplied by any third-party.
USDCAD: Will Start Falling! Here is Why:
Looking at the chart of USDCAD right now we are seeing some interesting price action on the lower timeframes. Thus a local move down seems to be quite likely.
Disclosure: I am part of Trade Nation's Influencer program and receive a monthly fee for using their TradingView charts in my analysis.
❤️ Please, support our work with like & comment! ❤️

Sell USDCAD USDCAD Bearish Idea. It seems as though the entire USD index is negative today. A bearish flag can be seen on the 4hr chart on USDCAD this Tuesday.
