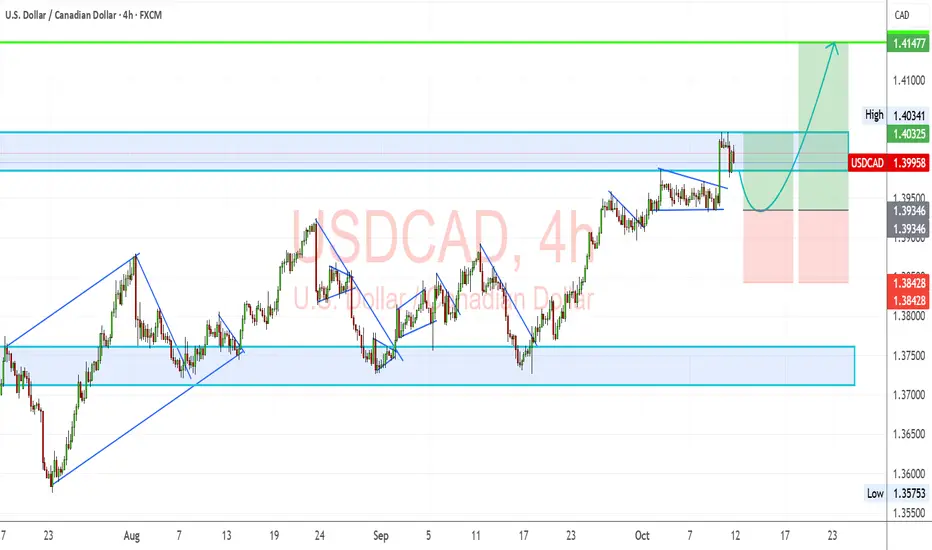
USDCAD H4 | Potential Bullish ContinuationBased on the H4 chart analysis, we could see the price fall to the buy entry, which is a pullback support that lines up with the 23.6% Fibonacci retracement and could bounce from this level to the upside.
Buy entry is at 1.3966, which is a pullback support that lines up with the 23.6% Fibonacci retracement.
Stop loss is at 1.3917, which is an overlap support that aligns with the 38.2% Fibonacci retracement.
Take profit is at 1.4093, which is a pullback resistance that aligns with the 61.8% Fibonacci retracement.
High Risk Investment Warning
Trading Forex/CFDs on margin carries a high level of risk and may not be suitable for all investors. Leverage can work against you.
Stratos Markets Limited (tradu.com ):
CFDs are complex instruments and come with a high risk of losing money rapidly due to leverage. 65% of retail investor accounts lose money when trading CFDs with this provider. You should consider whether you understand how CFDs work and whether you can afford to take the high risk of losing your money.
Stratos Europe Ltd (tradu.com ):
CFDs are complex instruments and come with a high risk of losing money rapidly due to leverage. 66% of retail investor accounts lose money when trading CFDs with this provider. You should consider whether you understand how CFDs work and whether you can afford to take the high risk of losing your money.
Stratos Global LLC (tradu.com ):
Losses can exceed deposits.
Please be advised that the information presented on TradingView is provided to Tradu (‘Company’, ‘we’) by a third-party provider (‘TFA Global Pte Ltd’). Please be reminded that you are solely responsible for the trading decisions on your account. There is a very high degree of risk involved in trading. Any information and/or content is intended entirely for research, educational and informational purposes only and does not constitute investment or consultation advice or investment strategy. The information is not tailored to the investment needs of any specific person and therefore does not involve a consideration of any of the investment objectives, financial situation or needs of any viewer that may receive it. Kindly also note that past performance is not a reliable indicator of future results. Actual results may differ materially from those anticipated in forward-looking or past performance statements. We assume no liability as to the accuracy or completeness of any of the information and/or content provided herein and the Company cannot be held responsible for any omission, mistake nor for any loss or damage including without limitation to any loss of profit which may arise from reliance on any information supplied by TFA Global Pte Ltd.
The speaker(s) is neither an employee, agent nor representative of Tradu and is therefore acting independently. The opinions given are their own, constitute general market commentary, and do not constitute the opinion or advice of Tradu or any form of personal or investment advice. Tradu neither endorses nor guarantees offerings of third-party speakers, nor is Tradu responsible for the content, veracity or opinions of third-party speakers, presenters or participants.
Trade ideas

USDCAD | Bullish Continuation Awaits Smart Money ConfirmationPair: USDCAD
Bias: Bullish
HTF Overview:
Higher timeframe remains decisively bullish, with structure continuing to break significant highs. The overall momentum still supports upside delivery, showing smart money maintaining control of the directional flow.
MTF Insight:
Currently waiting for sell-side liquidity to be taken before looking for fresh long opportunities. Price has a decisional and an extreme order block marked — ideal zones for potential mitigations once liquidity is swept. These areas will serve as key points of interest for the next phase of continuation.
LTF Confirmation:
After liquidity is cleared and price falls into one of the OB zones, I’ll be watching for a lower timeframe change of character. Once the lower high is breached, I’ll refine entry within that bullish leg for precision buys.
Entry Zone:
Decisional → Extreme OB range after liquidity sweep.
Targets:
Liquidity above recent highs aligning with the higher timeframe continuation move.
Mindset Note:
Patience until mitigation. Let smart money lead direction — the best trades come when timing and structure are in full alignment.

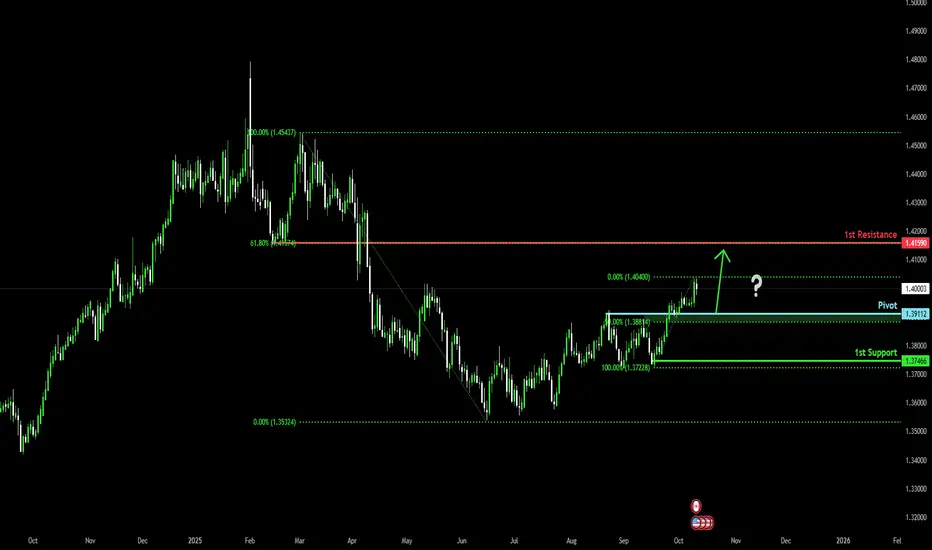
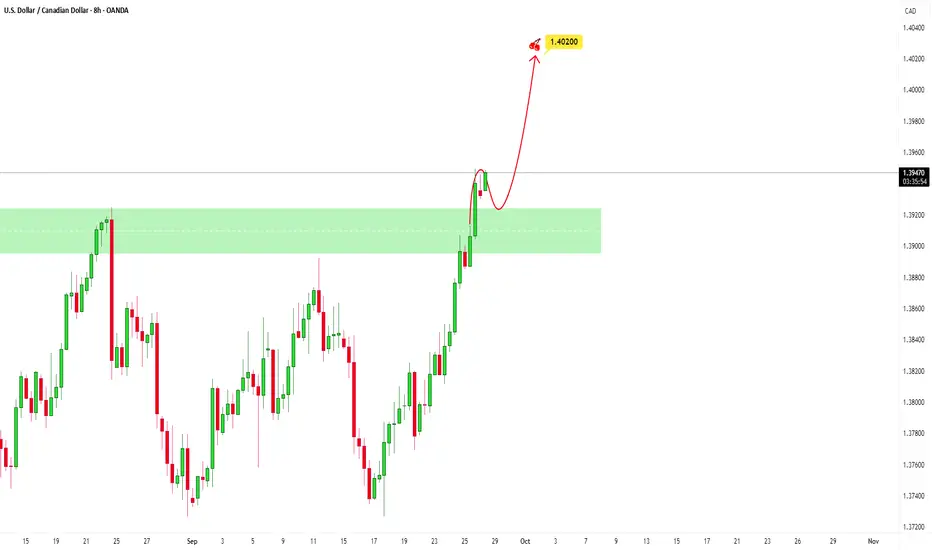
Bullish bounce off pullback support?The Loonie (USD/CAD) is falling towards the pivot which acts as a pullback support and could bounce to the pullback resistance that aligns with the 61.8% Fibonacci retracement.
Pivot: 1.3911
1st Support: 1.3746
1st Resistance: 1.4159
Disclaimer:
The above opinions given constitute general market commentary, and do not constitute the opinion or advice of IC Markets or any form of personal or investment advice.
Any opinions, news, research, analyses, prices, other information, or links to third-party sites contained on this website are provided on an "as-is" basis, are intended only to be informative, is not an advice nor a recommendation, nor research, or a record of our trading prices, or an offer of, or solicitation for a transaction in any financial instrument and thus should not be treated as such. The information provided does not involve any specific investment objectives, financial situation and needs of any specific person who may receive it. Please be aware, that past performance is not a reliable indicator of future performance and/or results. Past Performance or Forward-looking scenarios based upon the reasonable beliefs of the third-party provider are not a guarantee of future performance. Actual results may differ materially from those anticipated in forward-looking or past performance statements. IC Markets makes no representation or warranty and assumes no liability as to the accuracy or completeness of the information provided, nor any loss arising from any investment based on a recommendation, forecast or any information supplied by any third-party.
USDCAD--LONG--bullish continuation
--monthly bullish
--weekly bullish
--entry and tp levels are as shown on the chart

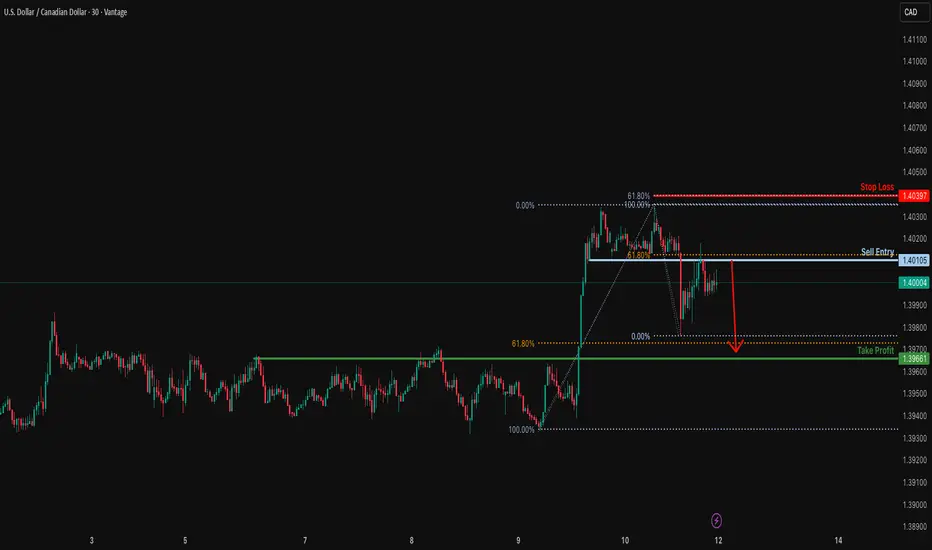
Could we see a drop from here?USD/CAD is reacting off the resistance level which is a pullback resistance that aligns with the 61.8% Fibonacci retracement and could potentially drop from this level to ur take profit.
Entry: 1.4010
Why we like it:
There is a pullback resistance level that lines up with the 61.8% Fibonacci retracement.
Stop loss: 1.4039
Why we like it:
There is a resistance level at the 61.8% Fibonacci projection.
Take profit: 1.3966
Why we like it:
There is a pullback support that is slightly below the 61.8% Fibonacci retracement.
Enjoying your TradingView experience? Review us!
Please be advised that the information presented on TradingView is provided to Vantage (‘Vantage Global Limited’, ‘we’) by a third-party provider (‘Everest Fortune Group’). Please be reminded that you are solely responsible for the trading decisions on your account. There is a very high degree of risk involved in trading. Any information and/or content is intended entirely for research, educational and informational purposes only and does not constitute investment or consultation advice or investment strategy. The information is not tailored to the investment needs of any specific person and therefore does not involve a consideration of any of the investment objectives, financial situation or needs of any viewer that may receive it. Kindly also note that past performance is not a reliable indicator of future results. Actual results may differ materially from those anticipated in forward-looking or past performance statements. We assume no liability as to the accuracy or completeness of any of the information and/or content provided herein and the Company cannot be held responsible for any omission, mistake nor for any loss or damage including without limitation to any loss of profit which may arise from reliance on any information supplied by Everest Fortune Group.
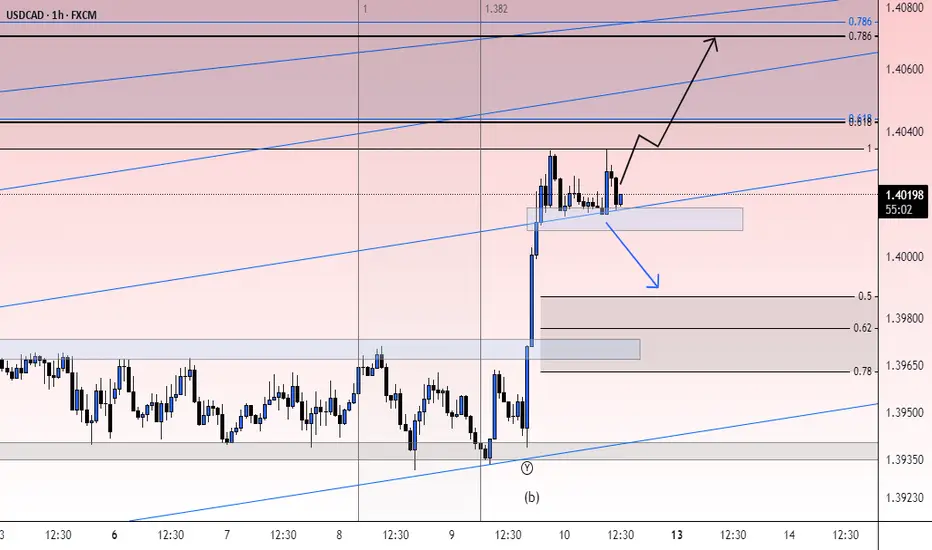
USD/CAD WILL HAVE A BIG MOVE NEXT WEEK, SEE HEREAs we can see first there is a flip zone where the price is currently above the take, there is also an imbalance that has been created near the demand zone. For next week we will watch until the price reaches the fvg and also give it an entry before looking for a buy opportunity. That's all for now.

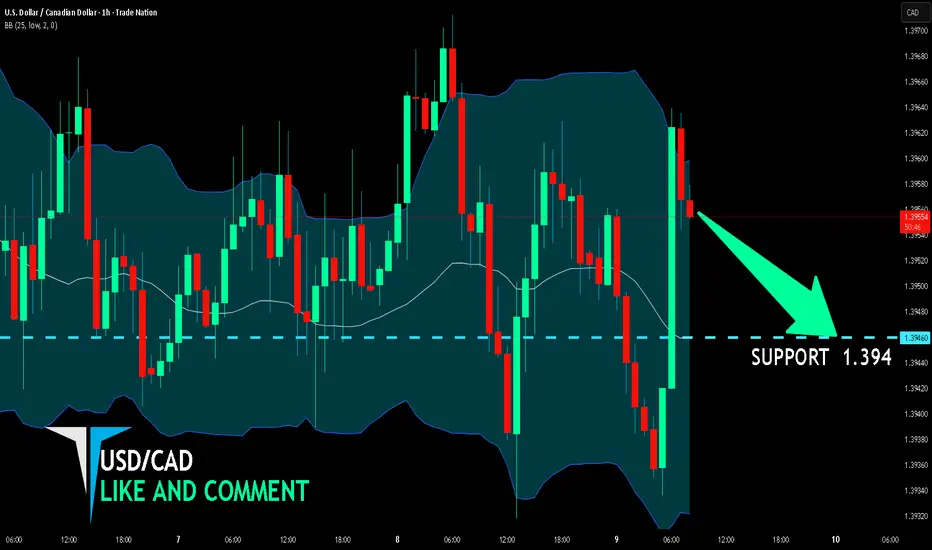
USDCAD Will Fall! Short!
Here is our detailed technical review for USDCAD.
Time Frame: 9h
Current Trend: Bearish
Sentiment: Overbought (based on 7-period RSI)
Forecast: Bearish
The market is testing a major horizontal structure 1.400.
Taking into consideration the structure & trend analysis, I believe that the market will reach 1.393 level soon.
P.S
We determine oversold/overbought condition with RSI indicator.
When it drops below 30 - the market is considered to be oversold.
When it bounces above 70 - the market is considered to be overbought.
Like and subscribe and comment my ideas if you enjoy them!

USDCAD Dollar Building as Loonie Struggles with Oil & Weak DataUSDCAD has surged into a key resistance zone, showing resilience even against temporary pullbacks. The pair is benefiting from broad USD strength as the Fed maintains a cautious stance on rate cuts, while the Canadian dollar is weighed down by weaker labor data and softer oil demand. Price action suggests the market is gearing up for another bullish extension if buyers can defend current support.
Current Bias
Bullish – upward momentum is intact with strong support holding above 1.3930 and potential continuation toward higher resistance.
Key Fundamental Drivers
USD Strength: Supported by sticky US inflation and a Fed reluctant to accelerate cuts.
CAD Weakness: Canada’s job market recovery remains patchy, with unemployment elevated and wage growth cooling.
Oil Prices: Recent volatility in crude undermines CAD, which typically benefits from higher energy prices.
Macro Context
Interest Rate Expectations: Fed holding rates steady longer, BoC facing pressure to ease further if labor market slack persists.
Economic Growth Trends: US growth remains steady, Canada showing signs of stagnation.
Commodity Flows: Oil fluctuations weigh directly on CAD; weaker demand outlook adds to downside risk.
Geopolitical Themes: Global tariff disputes and risk aversion support USD safe-haven flows at the expense of CAD.
Primary Risk to the Trend
A sharp rebound in oil prices or stronger-than-expected Canadian inflation data could strengthen CAD and cap USD gains.
Most Critical Upcoming News/Event
Canada CPI (Oct 22) will be critical for BoC expectations.
US CPI and Fed speeches remain key for dollar direction.
Leader/Lagger Dynamics
USDCAD is more of a lagger, reacting to USD moves and oil-driven CAD flows. It follows broader USD direction but can influence CAD crosses like CADJPY and EURCAD.
Key Levels
Support Levels:
1.3930 (short-term support)
1.3842 (structural support)
Resistance Levels:
1.4035 (near-term resistance)
1.4147 (major target)
Stop Loss (SL): 1.3842
Take Profit (TP): 1.4147
Summary: Bias and Watchpoints
USDCAD bias is bullish, with buyers defending support and positioning for another leg higher. The fundamental backdrop of a stronger USD and weaker CAD underpins the move, with oil prices adding a bearish weight to the Canadian dollar. The setup looks favorable for continuation toward 1.4147, provided support at 1.3930 holds. Stop loss sits at 1.3842 to protect against a deeper correction, while the take profit is set at 1.4147. The pair remains a lagger, following USD strength and oil dynamics, making US and Canadian inflation data the most important watchpoints ahead.
USDCADI'm in a short position now for a very small lot size, as the downtrend is not strong yet, possibly price would find 1.40600 level before moving down. I plan to hold this position for a while. 1.417 I would sell more.
USDCAD ; Retracement And Short..?USDCAD have been scaling on a circle of uptrend with higher highs and lows, respecting the resistance as we can spot in the structure. we may encounter a movement below this zone with target towards the support area at 1.3783.
Meanwhile a possible breakout above the resistance would trigger more rise resuming its bullish climb.
At this point the availability chances of trade is to sell at the resistance and buy at the support.
Like and follow
Thanks for reading.

#USDCAD: Price to continue remain bullish! Let's wait and watchDear traders,
I hope you all are doing well.
The USDCAD pair has been extremely bullish since the CAD currency began to decline. We now have an excellent opportunity to rise, with the potential for the price to reverse in good time. This analysis is based solely on the current market conditions and price behaviour, so it may differ from your own views. The target is a swing, and you can adjust it according to your own analysis. Please use this analysis for educational purposes only.
Good luck and trade safely!
Team Setupsfx_

USDCAD SHORT BUY The Canadian dollar weakened past 1.400 per US dollar, reaching the lowest since early April, amid a stronger dollar and declining oil prices. Meanwhile, traders assessed the latest Fed minutes suggesting further rate cuts later this year, as uncertainty over the US government shutdown persisted. In Canada, attention turns to the official September employment report on Friday, which is expected to show further labour market weakness, with the unemployment rate rising to 7.2% from 7.1%. The data could provide fresh insights into the Bank of Canada’s rate outlook. On the trade front, President Donald Trump said during Carney’s visit to the White House that he expects the US and Canada will eventually reach a trade deal, but provided few details on timing or terms

possibility of uptrend The price is expected to consolidate above the support range and then continue the upward trend. If the price breaks the support range, a downward trend to the specified support levels will be possible.
Stop!Loss|Market View: USDCAD🙌 Stop!Loss team welcomes you❗️
In this post, we're going to talk about the near-term outlook for the USDCAD currency pair☝️
Potential trade setup:
🔔Entry level: 1.39754
💰TP: 1.40513
⛔️SL: 1.39279
"Market View" - a brief analysis of trading instruments, covering the most important aspects of the FOREX market.
👇 In the comments 👇 you can type the trading instrument you'd like to analyze, and we'll talk about it in our next posts.
💬 Description: The bullish potential is still alive for USDCAD. Currently, we are seeing active price accumulation near short-term resistance at 1.39580, which indicates buyers are taking the initiative. A potential buy trade is being considered based on a breakout of the upper accumulation boundary. In the mid-term, growth to 1.42000 and 1.43000 is expected.
Thanks for your support 🚀
Profits for all ✅
❗️ Updates on this idea can be found below 👇

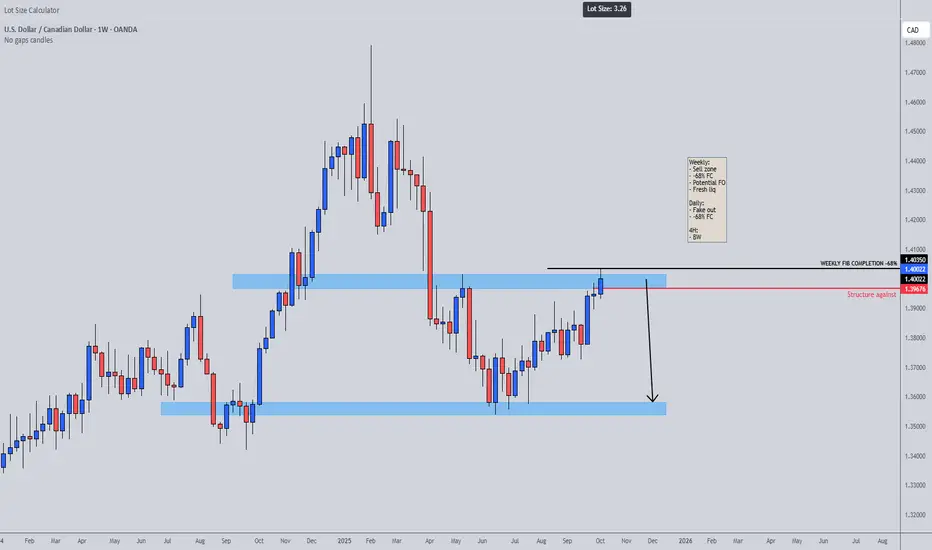
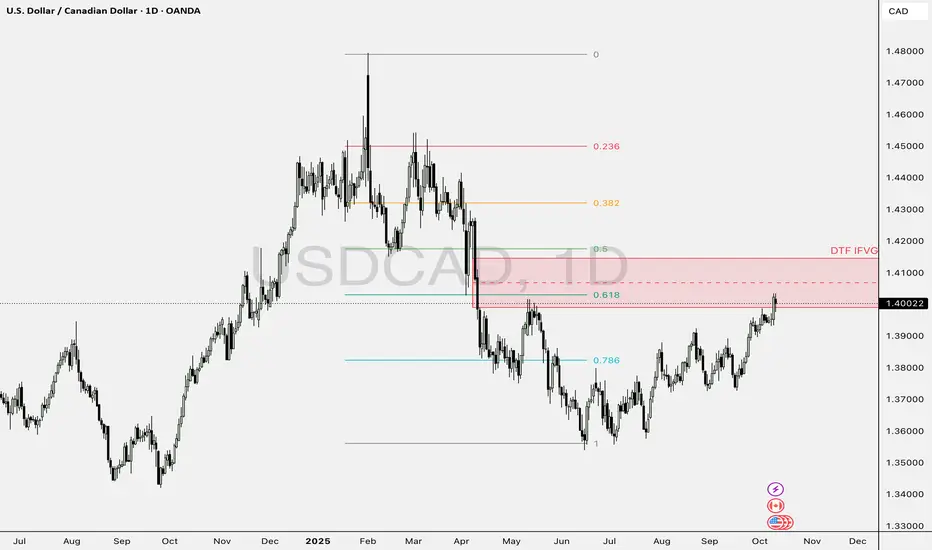
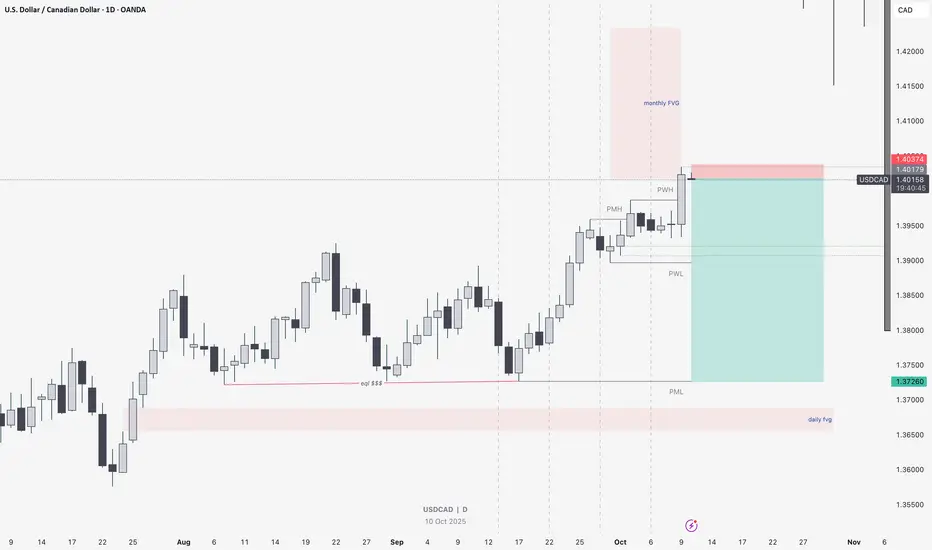
USD/CAD Short Setup from Monthly Fair Value Gap RejectionPrice has tapped into the monthly FVG (Fair Value Gap) around the 1.4050 area, aligning with a potential liquidity sweep above the previous week’s high (PWH).
If lower timeframes (H4 or H1) confirm a bearish shift in market structure or displacement, I’ll be looking for short entries targeting the previous monthly low (PML) at 1.3726, which also aligns with equal lows and a daily FVG resting below.
The setup idea follows the premise that the market has reached a premium level after engineering liquidity above the highs and is likely to rebalance towards the discount zone where liquidity and inefficiencies remain unfilled.
Confluence:
• Monthly FVG tapped
• Liquidity sweep above previous week’s high
• Potential bearish structure shift on lower timeframe
• Untapped daily FVG below at 1.37 zone
If price fails to show bearish confirmation and breaks cleanly above the monthly FVG, this idea becomes invalid.
USD/CAD: Important Breakout📈USDCAD formed a high-momentum bullish candle yesterday, on a 4-hour time frame,
This candle closed above a significant horizontal resistance level.
The violated structure and a prominent ascending trend line now create a contracting demand zone, which is the area where the next bullish movement is anticipated to begin.
The subsequent resistance level is at 1.3986.

08-10-2025 _ Short Term Bullish Idea _ USDCAD H11- Price is moving in a rising channel.
2- Price has bounced up from Support / Resistance Zone.
3- Price is consolidating and has retested 200 MA.
4- Bullish Flag pattern
5- AB = CD expectation, retesting the top of the rising channel.

USDCAD remains bullish, showing signs of strengtheningUSDCAD remains bullish, showing signs of strengthening. After a successful breakout, the pair has completed a minor correction phase, and price accumulation in the current zone suggests potential for further upside movement.
Although the U.S. dollar remains relatively weak in the broader context, the technical setup still favors the bulls. The main fundamental risk to USD strength at the moment comes from Donald Trump’s tariff policies, which could introduce volatility if escalated further. Additionally, the U.S. government shutdown, now in its second week, has so far had limited market impact.
Overall, the USD appears stronger than before, and as long as the price stays above key support levels, a bullish scenario remains in play. If bullish momentum continues, resistance near 1.40007 could be the next significant upside target.
You may find more details in the chart.
Trade wisely best of Luck.
Ps. Support with like and comments for more better analysis Thanks for Support.

USDCAD Could continue higherBuyers managed to break price above the key resistance zone, showing strong conviction as they pushed through the area with strength.
If price pulls back into the broken level and buyers successfully defend it, holding above and rejecting downside attempts, that becomes our long confirmation. The retest confirms the level has flipped from resistance into new support, and it's ready for the next bullish leg upward.
USDCAD 15M – Bearish Correction Setup 📉 OANDA:USDCAD
Structure | Trend | Key Reaction Zones
Price is respecting a descending trendline, rejecting multiple times near 1.3960–1.3965, showing exhaustion after minor pullbacks. The structure remains bearish with lower highs forming consistently.
Market Overview
USDCAD is currently consolidating below resistance, forming a corrective pattern within the descending structure. A clean break below 1.3949 would confirm downside momentum targeting the 1.3920–1.3930 demand zone, where strong buyers may appear for short-term reversals.
Key Scenarios
✅ Bearish Case 📉 → 🎯 Target 1: 1.3942 | 🎯 Target 2: 1.3920
❌ Bullish Case 🚀 → Break and close above 1.3965 could invalidate the setup and push toward 1.3971 resistance.
Current Levels to Watch
Resistance 🔴: 1.3965 – 1.3971
Support 🟢: 1.3942 – 1.3920
⚠️ Disclaimer: This analysis is for educational purposes only. Not financial advice.

Evening Forecast on USDCAD 9/10/2025Hello, this is my evening Forecast on USDCAD. Curous for your feedback and guidance

USD/CAD BEARS WILL DOMINATE THE MARKET|SHORT
Hello, Friends!
We are going short on the USD/CAD with the target of 1.394 level, because the pair is overbought and will soon hit the resistance line above. We deduced the overbought condition from the price being near to the upper BB band. However, we should use low risk here because the 1W TF is green and gives us a counter-signal.
Disclosure: I am part of Trade Nation's Influencer program and receive a monthly fee for using their TradingView charts in my analysis.
✅LIKE AND COMMENT MY IDEAS✅