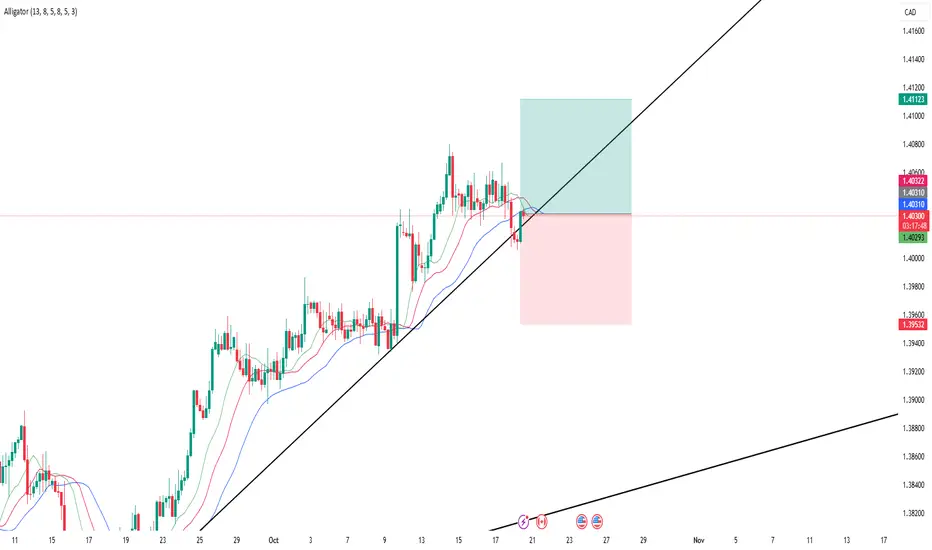
USDCAD Will Go Lower! Short!
Here is our detailed technical review for USDCAD.
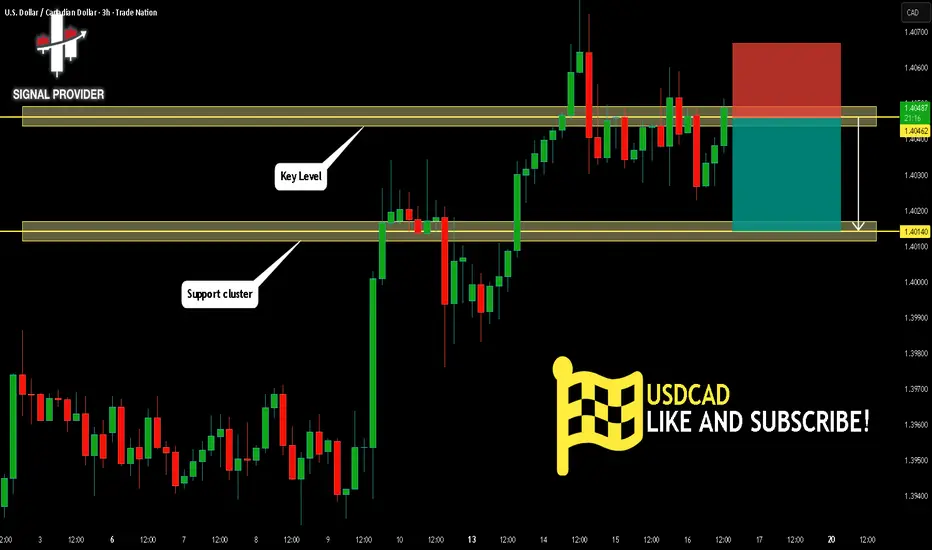
Time Frame: 3h
Current Trend: Bearish
Sentiment: Overbought (based on 7-period RSI)
Forecast: Bearish
The market is on a crucial zone of supply 1.404.
The above-mentioned technicals clearly indicate the dominance of sellers on the market. I recommend shorting the instrument, aiming at 1.401 level.
P.S
Overbought describes a period of time where there has been a significant and consistent upward move in price over a period of time without much pullback.
Like and subscribe and comment my ideas if you enjoy them!
U.S. Dollar / Canadian Dollar
No trades
Trade ideas
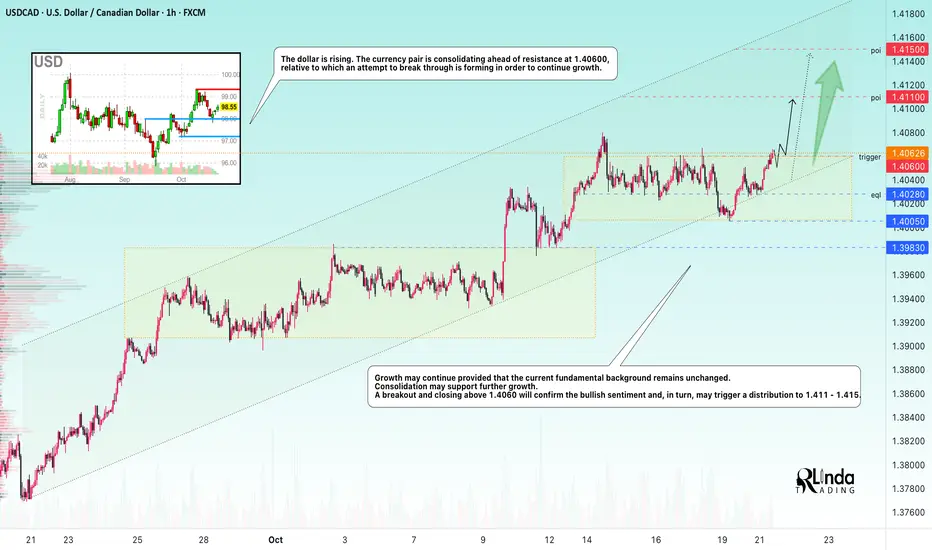
USDCAD → Attempt to break through resistance to continue growth FX:USDCAD is attempting to break through consolidation resistance within an uptrend. Growth in the dollar index may support the current trend.
The dollar is rising. The currency pair is consolidating ahead of resistance at 1.40600, against which it is attempting to break through in order to continue growing.
The growth may continue if the current fundamental background remains unchanged. Consolidation may support further growth. A breakout and closing above 1.4060 will confirm the bullish sentiment and, in turn, may trigger a distribution to 1.411 - 1.415.
Resistance levels: 1.4060
Support levels: 1.4028, 1.4005
The trend is bullish, with virtually no pullback after the growth, only consolidation, which is technically a positive sign. A breakout of the specified consolidation resistance could trigger distribution to areas of interest.
Best regards, R. Linda!
Heading into swing high resistance?The Loonie (USD/CAD) is rising towards the pivot which has been identified as a swing high resistance and could reverse to the 1st support.
Pivot: 1.4076
1st Support: 1.4033
1st Resistance: 1.4096
Disclaimer:
The above opinions given constitute general market commentary, and do not constitute the opinion or advice of IC Markets or any form of personal or investment advice.
Any opinions, news, research, analyses, prices, other information, or links to third-party sites contained on this website are provided on an "as-is" basis, are intended only to be informative, is not an advice nor a recommendation, nor research, or a record of our trading prices, or an offer of, or solicitation for a transaction in any financial instrument and thus should not be treated as such. The information provided does not involve any specific investment objectives, financial situation and needs of any specific person who may receive it. Please be aware, that past performance is not a reliable indicator of future performance and/or results. Past Performance or Forward-looking scenarios based upon the reasonable beliefs of the third-party provider are not a guarantee of future performance. Actual results may differ materially from those anticipated in forward-looking or past performance statements. IC Markets makes no representation or warranty and assumes no liability as to the accuracy or completeness of the information provided, nor any loss arising from any investment based on a recommendation, forecast or any information supplied by any third-party.

Lingrid | USDCAD Contraction Leading to Bullish BreakoutFX:USDCAD continues to respect its upward channel, consolidating after multiple tests of the ascending trendline that define the current bullish structure. The confluence near 1.4036 aligns with dynamic support, suggesting buyers may soon attempt another push toward the 1.4100 resistance. A sustained move above this level could extend momentum toward the upper boundary of the channel. The overall compression phase indicates market preparation for a breakout continuation.
⚠️ Risks:
A breakdown below 1.4030 may invalidate the bullish scenario.
Strong CPI data or oil price rally could pressure USD and reverse gains.
Broader risk sentiment shifts may limit upside potential.
If this idea resonates with you or you have your own opinion, traders, hit the comments. I’m excited to read your thoughts!

USD/CAD (U.S. Dollar / Canadian Dollar) 4-hour..USD/CAD (U.S. Dollar / Canadian Dollar) 4-hour..
Current price: Around 1.4060
Trend: Strong uptrend, respecting an ascending trendline.
Ichimoku Cloud: Price is above the cloud — confirming bullish momentum.
Pattern: Breakout above consolidation, moving toward a marked resistance.
📈 Target Point (as shown on my chart):
The blue arrow and label mark a target point around 1.4120 – 1.4130
✅ Summary:
Entry zone: Around 1.4050–1.4060 (post-breakout retest)
Target: 1.4120 – 1.4130
Stop-loss suggestion: Below 1.4020 (just under the support/cloud)
This projection looks like a measured move breakout continuation within the ascending channel.

USDCAD Holds Bullish Ground Above 1.40The USDCAD pair is holding below the upper boundary of an ascending channel that extends from the June 2025 lows, while maintaining a position above key support at 1.4000 — a previous resistance level turned support.
The 1.4080 mark represents a critical resistance zone, aligning with:
• The upper channel boundary.
• The trendline connecting highs from July to August.
• The 0.44 Fibonacci retracement of the downtrend between January and July 2025.
With the bullish hold persisting amid limited economic data, the scenarios are:
o A hold above the upper boundary and 1.41 mark would confirm a bullish continuation toward 1.4180 and 1.4300.
o A failure to hold above 1.40 (the channel’s mid-zone) could extend the decline toward the lower boundary at 1.3880, offering potential support.
o A decisive break below that level would open the door to the next support near 1.3750.
Written by Razan Hilal, CMT

USDCAD 1H LongTrendline overall bullish on Higher Timeframes.
Price bounced from 4H trendline.
RR 1:1

1.40 Appears Pivotal For USD/CADUSD/CAD remains in an established uptrend on the daily chart, although momentum showed signs of turning lower on Friday. Still, the 1.40 handle and monthly R1 pivot sit close by as a key support zone, making this area pivotal for both bulls and bears in the near term.
If the support zone holds, the bias favours a move toward 1.41, near the monthly R2 pivot. However, a break below 1.40 would shift focus to the high-volume node (HVN) at 1.3948, where bears may look to extend downside pressure. Given the prevailing uptrend, bulls may continue to watch for evidence of a swing low before re-entering.
Matt Simpson, Market Analyst at City Index and Forex.com

USDCAD: Bearish Continuation & Short Signal
USDCAD
- Classic bearish formation
- Our team expects fall
SUGGESTED TRADE:
Swing Trade
Sell USDCAD
Entry Level - 1.4040
Sl - 1.4047
Tp - 1.4028
Our Risk - 1%
Start protection of your profits from lower levels
Disclosure: I am part of Trade Nation's Influencer program and receive a monthly fee for using their TradingView charts in my analysis.
❤️ Please, support our work with like & comment! ❤️

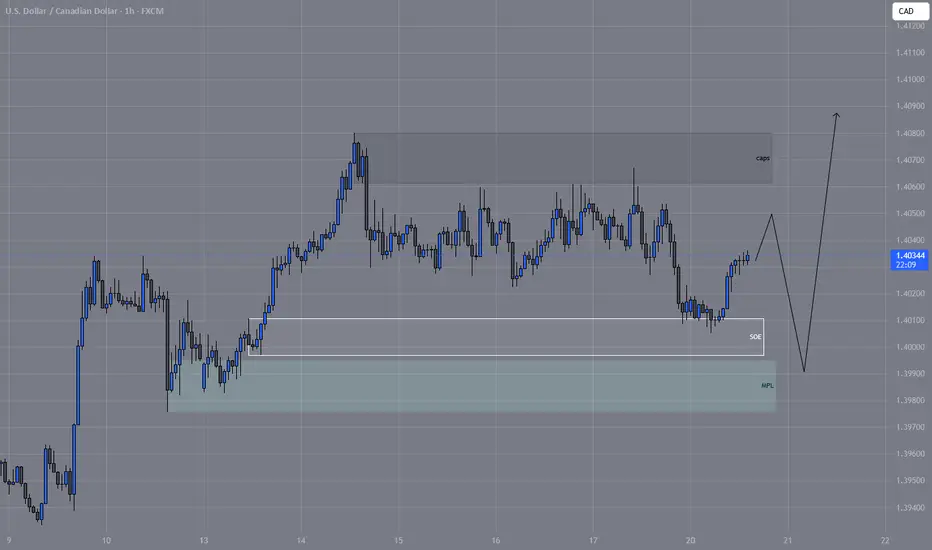
Upward movement in usdcadFor this pair, since it has broken out of the soe range, we expect the price to move out of a stronger range called the mpl. Personally, I would wait for the price to reach this range and then enter a buy trade.
USDCAD Is Very Bullish! Buy!
Please, check our technical outlook for USDCAD.
Time Frame: 1D
Current Trend: Bullish
Sentiment: Oversold (based on 7-period RSI)
Forecast: Bullish
The market is approaching a significant support area 1.403.
The underlined horizontal cluster clearly indicates a highly probable bullish movement with target 1.414 level.
P.S
We determine oversold/overbought condition with RSI indicator.
When it drops below 30 - the market is considered to be oversold.
When it bounces above 70 - the market is considered to be overbought.
Like and subscribe and comment my ideas if you enjoy them!

20.10.25 USD/CAD BuyBig Picture:
We are in an overall uptrend.
Daily (Higher Time Frame):
There is a downtrend moving into the Weekly Demand zone. Once price reached this Weekly Demand, buyers stepped in and shifted the direction to the upside — forming a bell curve structure.
The nearest Daily Demand zone is defined by a Rally (leg in), Base, and Rally (leg out) pattern. This zone is fresh, meaning it hasn’t reacted to a previous zone, and it hasn’t been violated yet.
4-Hour (Lower Time Frame):
We currently have a level-on-top-of-level setup, both of which fall within the higher time frame demand area.
I will focus on the first level and use it as my risk zone. If my stop loss gets triggered, I’ll wait for confirmation from price action before setting up another buy position.
Once my target is reached, I’ll move my stop loss to break-even (BE) and close 75% of the position. I’ll then trail the stop on the remaining 25%.

USDCADOverall Trend: Bullish
Key Support Zone: 1.4000 → 1.3950
Target Zone: 1.4150 – 1.4165
Probability of Reaching the Target: Around 65% to 70%
USDCAD- TRADE IDEAI’ve entered a buy position on USD/CAD as the pair is maintaining a bullish market structure on the higher timeframes. The daily chart shows clear bullish momentum, while the 4-hour timeframe confirms a series of higher highs (HH) and higher lows (HL), indicating a healthy uptrend continuation.
The price recently retested the ascending trendline and is showing signs of rejection, suggesting strong buyer interest at this level. Additionally, the Alligator indicator is starting to realign in a bullish formation, supporting potential upward movement.
My entry aligns with the trendline support and structure-based confluence, with a target towards the previous swing high zone, while maintaining a well-defined risk-to-reward ratio.
USDCAD H1 | Bearish ReversalBased on the H1 chart analysis, we can see that the price is reacting off the sell entry, which is a pullback resistance that aligns with the 50% Fibonacci retracement and could drop from this level to the downside.
Sell entry is at 1.4033, which is a pullback resistance that aligns with the 50% Fibonacci retracement.
Stop loss is at 1.4058, which is a multi swing high resistance.
Take profit is at 1.3997, which is a pullback support.
High Risk Investment Warning
Trading Forex/CFDs on margin carries a high level of risk and may not be suitable for all investors. Leverage can work against you.
Stratos Markets Limited (tradu.com ):
CFDs are complex instruments and come with a high risk of losing money rapidly due to leverage. 65% of retail investor accounts lose money when trading CFDs with this provider. You should consider whether you understand how CFDs work and whether you can afford to take the high risk of losing your money.
Stratos Europe Ltd (tradu.com ):
CFDs are complex instruments and come with a high risk of losing money rapidly due to leverage. 66% of retail investor accounts lose money when trading CFDs with this provider. You should consider whether you understand how CFDs work and whether you can afford to take the high risk of losing your money.
Stratos Global LLC (tradu.com ):
Losses can exceed deposits.
Please be advised that the information presented on TradingView is provided to Tradu (‘Company’, ‘we’) by a third-party provider (‘TFA Global Pte Ltd’). Please be reminded that you are solely responsible for the trading decisions on your account. There is a very high degree of risk involved in trading. Any information and/or content is intended entirely for research, educational and informational purposes only and does not constitute investment or consultation advice or investment strategy. The information is not tailored to the investment needs of any specific person and therefore does not involve a consideration of any of the investment objectives, financial situation or needs of any viewer that may receive it. Kindly also note that past performance is not a reliable indicator of future results. Actual results may differ materially from those anticipated in forward-looking or past performance statements. We assume no liability as to the accuracy or completeness of any of the information and/or content provided herein and the Company cannot be held responsible for any omission, mistake nor for any loss or damage including without limitation to any loss of profit which may arise from reliance on any information supplied by TFA Global Pte Ltd.
The speaker(s) is neither an employee, agent nor representative of Tradu and is therefore acting independently. The opinions given are their own, constitute general market commentary, and do not constitute the opinion or advice of Tradu or any form of personal or investment advice. Tradu neither endorses nor guarantees offerings of third-party speakers, nor is Tradu responsible for the content, veracity or opinions of third-party speakers, presenters or participants.

USD/CAD BEARISH The USD/CAD pair is currently exhibiting signs of bearish momentum, with potential downside targeting the 1.40200 level. This zone may act as a critical decision point.
Disclaimer: This analysis is for informational purposes only and does not constitute financial advice. Trading forex involves significant risk and may not be suitable for all investors. Always conduct your own research or consult a licensed financial advisor before making investment decisions.

USDCAD possible bearish for 1.3955-60friday daily candle broke and closed below previous three days low i.e. 1.4022. pattern is bearish in 4h time frame, now seems forming a daily bearish pattern as well. supply area to short usdcad 1.4040-4065. stop loss: 1.4085-90. target might be 1.3955-60

USD/CAD: Bearish Reversal Confirmed!?The 📉USDCAD pair has broken and closed below a significant intraday horizontal support level.
The blue area, which is underlined, is also the neckline of a cup and handle pattern.
This violation suggests the potential for a continued downward movement.
The subsequent support level is anticipated to be at 1.3985.

Bullish momentum to extend?The Loonie (USD/CAD is falling towards the pivot which has been identifed as a pullback support and could bounce to the 61.8% Fibonacci resistance.
Pivot: 1.3908
1st Support: 1.3742
1st Resistance: 1.4166
Disclaimer:
The above opinions given constitute general market commentary, and do not constitute the opinion or advice of IC Markets or any form of personal or investment advice.
Any opinions, news, research, analyses, prices, other information, or links to third-party sites contained on this website are provided on an "as-is" basis, are intended only to be informative, is not an advice nor a recommendation, nor research, or a record of our trading prices, or an offer of, or solicitation for a transaction in any financial instrument and thus should not be treated as such. The information provided does not involve any specific investment objectives, financial situation and needs of any specific person who may receive it. Please be aware, that past performance is not a reliable indicator of future performance and/or results. Past Performance or Forward-looking scenarios based upon the reasonable beliefs of the third-party provider are not a guarantee of future performance. Actual results may differ materially from those anticipated in forward-looking or past performance statements. IC Markets makes no representation or warranty and assumes no liability as to the accuracy or completeness of the information provided, nor any loss arising from any investment based on a recommendation, forecast or any information supplied by any third-party.

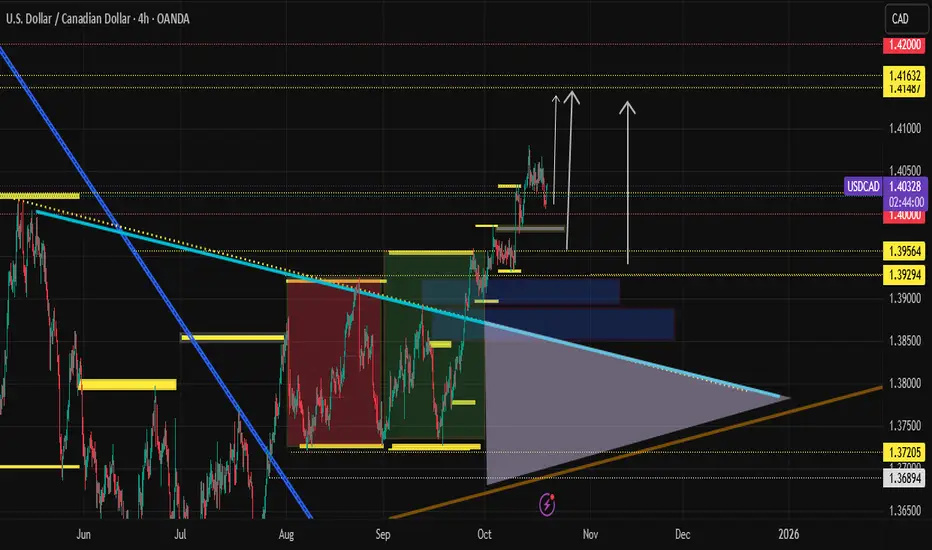
USDCAD may increase the bullish momentum USDCAD is moving inside of a rising wedge above the dynamic support zone and may resume the upswing this week, as the US dollar index may get support after softening rhetoric of Donald Trump. Yields of 30-year bonds of Canada have declined, but with less volatility than for the US treasuries.
The weakness of Crude oil futures pressures CAD against the USD, and focuses traders on the long side of USDCAD in the near future. The position of the price of USDCAD is above 200-day moving average, which boosts the bullish momentum for this currency pair.
Don't forget - this is just the idea, always do your own research and never forget to manage your risk!


Using Higher Timeframe Analysis to Predict the Next USDCAD MoveIn today’s breakdown, we’re taking a closer look at the USDCAD and a potential advanced pattern formation that could set up a strong opportunity for a bullish trend continuation.
While the pattern itself provides a valid trading setup, the real value in this analysis comes from understanding why it fits within the bigger picture. Too often, traders focus solely on the smaller details — the exact entry, the perfect target, or the idea of squeezing a few more pips out of a trade. But real consistency comes from aligning your short-term opportunities with the overall market direction.
The Power of Higher Timeframe Analysis
Before identifying the pattern, I started by analyzing the higher timeframe charts. This allowed me to make a longer-term directional prediction based on market structure, trend dynamics, and key levels of support and resistance. By establishing that the broader trend was bullish, any advanced pattern that aligned with that direction immediately carried more weight.
Instead of being greedy and shooting for oversized targets based on gut or emotion, I was able to structure a trade plan that fit within the flow of the market. This type of top-down analysis not only increases confidence but also helps manage risk by filtering out trades that go against the dominant trend.
The Takeaway
The key lesson here is simple:
Don’t rely on feel or hope when setting your targets or building your trade ideas. Use higher timeframe analysis to create a logical framework for your decisions. When your short-term setups align with the broader market direction, you’re trading with the trend — not against it.
By combining technical precision with higher timeframe context, you’ll find that your trades become more consistent, more predictable, and far less stressful.
Please leave any questions or comments below & I wish you guys a safe & profitable week of trading ahead.
Akil

USDCAD Trading IdeaBased on Simple Technical Analysis ( Trendline + Support & Resistance )
Risk Disclaimer:
Please be advised that I am not telling anyone how to spend or invest their money. Take all of my analysis as my own opinion, as entertainment, and at your own risk. I assume no responsibility or liability for any errors or omissions in the content of this page, and they are for educational purposes only. Any action you take on the information in this analysis is strictly at your own risk. There is a very high degree of risk involved in trading. Past results are not indicative of future returns. Good luck :-)
