Heading into major resistance?USD/CAD is rising towards the resistance level which is an overlap resistance that aligns with the 50% Fibonacci retracement and could reverse from this level to our take profit.
Entry: 1.4024
Why we like it:
There is an overlap resistance that aligns with the 50% Fibonacci retracement.
Stop loss: 1.4061
Why we like it:
There is a swing high resistance level.
Take profit: 1.3969
Why we like it:
There is a pullback support level.
Enjoying your TradingView experience? Review us!
Please be advised that the information presented on TradingView is provided to Vantage (‘Vantage Global Limited’, ‘we’) by a third-party provider (‘Everest Fortune Group’). Please be reminded that you are solely responsible for the trading decisions on your account. There is a very high degree of risk involved in trading. Any information and/or content is intended entirely for research, educational and informational purposes only and does not constitute investment or consultation advice or investment strategy. The information is not tailored to the investment needs of any specific person and therefore does not involve a consideration of any of the investment objectives, financial situation or needs of any viewer that may receive it. Kindly also note that past performance is not a reliable indicator of future results. Actual results may differ materially from those anticipated in forward-looking or past performance statements. We assume no liability as to the accuracy or completeness of any of the information and/or content provided herein and the Company cannot be held responsible for any omission, mistake nor for any loss or damage including without limitation to any loss of profit which may arise from reliance on any information supplied by Everest Fortune Group.
Trade ideas

USDCAD FREE SIGNAL|LONG|
✅USDCAD after tapping into the refined 4H demand level, price shows a bullish rejection candle, suggesting a potential long setup targeting the next short-term high. Smart money likely accumulating below liquidity pools.
—————————
Entry: 1.3944
Stop Loss: 1.3931
Take Profit: 1.3958
Time Frame: 4H
Setup Risk: High
—————————
LONG🚀
✅Like and subscribe to never miss a new idea!✅

USDCAD sell NowIt is time to sell the USDCAD from a supply zone . given strong rejection and I'm selling with 2% risk and target is 4%.

USD/CAD BEARS ARE GAINING STRENGTH|SHORT
Hello, Friends!
We are now examining the USD/CAD pair and we can see that the pair is going up locally while also being in a uptrend on the 1W TF. But there is also a powerful signal from the BB upper band being nearby, indicating that the pair is overbought so we can go short from the resistance line above and a target at 1.396 level.
Disclosure: I am part of Trade Nation's Influencer program and receive a monthly fee for using their TradingView charts in my analysis.
✅LIKE AND COMMENT MY IDEAS✅

Smart Money Levels on USD/CAD – What’s Next for the Loonie?“USD/CAD – The LOONIE Profit Playbook (Swing/Day Trade) 🚀💰”
📋 Description:
Dear Ladies & Gentleman (Thief OG’s),
Here’s the plan for our favourite cross, USD/CAD – “The Loonie”:
Plan: Bullish bias (with a setup for a potential bearish flip if you like to dance with the other side)
Entry (Bullish):
Pullback-1: 1.39400
Pullback-2: 1.39000
Enter at a dip into one of those levels, let the market breathe, then ride the wave.
Stop Loss:
This is Thief SL at 1.38800 — place your stop after the pullback level you used.
Target (Bullish):
Our target zone: 1.41000 — watch for strong resistance, overbought signals & a possible trap. Escape with profit when you see the signs.
Entry (Bearish):
If you prefer the short side: you may enter anywhere, but keep sharp eyes on pullback zones and the target levels below.
Bearish Targets: 1.39400 & 1.39000
🔍 More to watch – Related Pairs & Correlations:
OANDA:USDCHF (often moves inversely with USD/CAD)
OANDA:AUDUSD (commodity-linked crosses, relevant when commodities shift)
OANDA:CADJPY (Canadian dollar strength/weakness can show up across CAD pairs)
Watch how CAD strength or USD strength flows across pairs. When CAD weakens, USD/CAD rises — when CAD strengthens, USD/CAD dips.
⚠️ Note:
Dear Ladies & Gentleman (Thief OG’s), I am not recommending you set only my stop-loss or take-profit rules. It’s your own choice — make money, then take money — at your own risk.
✨ Footer:
“If you find value in my analysis, a 👍 and 🚀 boost is much appreciated — it helps me share more setups with the community!”
📌 Disclaimer:
This is Thief style trading strategy just for fun.
#USDCAD #Forex #SwingTrade #DayTrade #Loonie #ForexSetup #ThiefTrader #TradingViewIdeas #ForexAnalysis #CurrencyPairs

USDCAD - SELL - TP 1.39495 (short term)Hello,
1 HR started Bearish Mode.
So, I decide SELL
SL : 1.40108
TP1 : 1.39793
TP : 1.39495
But, USD is showed still Stronger than the other pair. We need to wait the Bearish confirmation.
Good Luck.

Is the USD/CAD Re-Accumulation Zone the Next Bullish Launchpad?💰 USD/CAD “THE LOONIE” — Forex Market Profit Playbook (Swing/Day Trade)
📊 Plan:
BULLISH Bias confirmed by Re-Accumulation Zone (Smart Money activity detected!)
The “Thief Strategy” hunts liquidity smartly — using layered limit buys at key levels to capture institutional footprints without chasing candles.
🎯 Entry Plan (Layering Strategy Style)
The Thief strategy uses multiple buy limit layers — a smart method to scale into a position without full exposure at once.
Buy Limit Layers:
1️⃣ 1.39800
2️⃣ 1.39900
3️⃣ 1.40000
4️⃣ 1.40200
💡 You can adjust or increase the limit layers based on your own trade risk and capital exposure.
🛡️ Stop Loss (SL):
📍 Suggested protective stop: 1.39600
Not financial advice — each trader’s risk tolerance may vary. Manage risk wisely like a pro!
💵 Target (Take Profit Zone):
🎯 1.41300 — The “Police Barricade” (major resistance area).
This zone may act as a strong barrier due to overbought conditions and potential liquidity traps. Take your profits smartly and escape before the cops arrive! 🚓💨
⚠️ Notes to Thief OGs:
Dear Ladies & Gentlemen (Thief OGs) — this isn’t a signal, it’s a playbook idea. You’re free to adjust entries, SLs, and TPs based on your own analysis and money management plan.
Trade smart. Take profits wisely. Risk what you can afford to lose. 🧠💼
🔍 Related Pairs to Watch:
TVC:DXY (US Dollar Index) → USD strength driver, watch for momentum continuation.
BLACKBULL:WTI (Crude Oil) → Strong inverse correlation with CAD; rising oil often boosts CAD (bearish USD/CAD).
FX:USDCNH → USD sentiment barometer — positive correlation with USD/CAD.
OANDA:AUDCAD / OANDA:NZDCAD → Cross-check for CAD sentiment confirmation across commodity pairs.
🧭 Key Catalysts & Correlations:
USD fundamentals: Fed stance, CPI, and bond yields continue to influence direction.
CAD sentiment: Oil price movement and BoC tone will shape the medium-term bias.
Risk sentiment: Strong equity rally = weaker USD; risk-off tone = stronger USD.
✨ “If you find value in my analysis, a 👍 and 🚀 boost is much appreciated — it helps me share more setups with the community!”
📜 Disclaimer: This is a Thief-style trading strategy shared for educational and entertainment purposes only — not financial advice. Trade responsibly and with discipline.
#USDCAD #Forex #SwingTrade #DayTrade #SmartMoney #Reaccumulation #PriceAction #LiquidityHunt #TradingStrategy #MarketPlaybook #FXAnalysis #DollarIndex #ThiefStrategy #TradingViewIdeas #BullishSetup #ForexCommunity

USDCAD corrective pullback supported at 1.3900The USDCAD remains in a bullish trend, with recent price action showing signs of a corrective pullback within the broader uptrend.
Support Zone: 1.3900 – a key level from previous consolidation. Price is currently testing or approaching this level.
A bullish rebound from 1.3900 would confirm ongoing upside momentum, with potential targets at:
1.3977 – initial resistance
1.3990 – psychological and structural level
1.4010 – extended resistance on the longer-term chart
Bearish Scenario:
A confirmed break and daily close below 1.3900 would weaken the bullish outlook and suggest deeper downside risk toward:
1.3890 – minor support
1.3864 – stronger support and potential demand zone
Outlook:
Bullish bias remains intact while the USDCAD holds above 1.3900. A sustained break below this level could shift momentum to the downside in the short term.
This communication is for informational purposes only and should not be viewed as any form of recommendation as to a particular course of action or as investment advice. It is not intended as an offer or solicitation for the purchase or sale of any financial instrument or as an official confirmation of any transaction. Opinions, estimates and assumptions expressed herein are made as of the date of this communication and are subject to change without notice. This communication has been prepared based upon information, including market prices, data and other information, believed to be reliable; however, Trade Nation does not warrant its completeness or accuracy. All market prices and market data contained in or attached to this communication are indicative and subject to change without notice.

USD cad Trade IdeaPrice is currently holding strong at a support level that price has respected before. Price ended up switching directions at the level telling me the range seems to be in continuation. Entry for me was a break and retest with a clean bullish candle. The 15m, 1hr and 4hr are all bullish candles at the moment so if all goes well we could expect the daily to end in a bullish candle as well. Looking for a 1:3rr on this set up. We'll see what happens. It's NFP week so I'm looking to catch my trades early in the week, Thursday the latest.


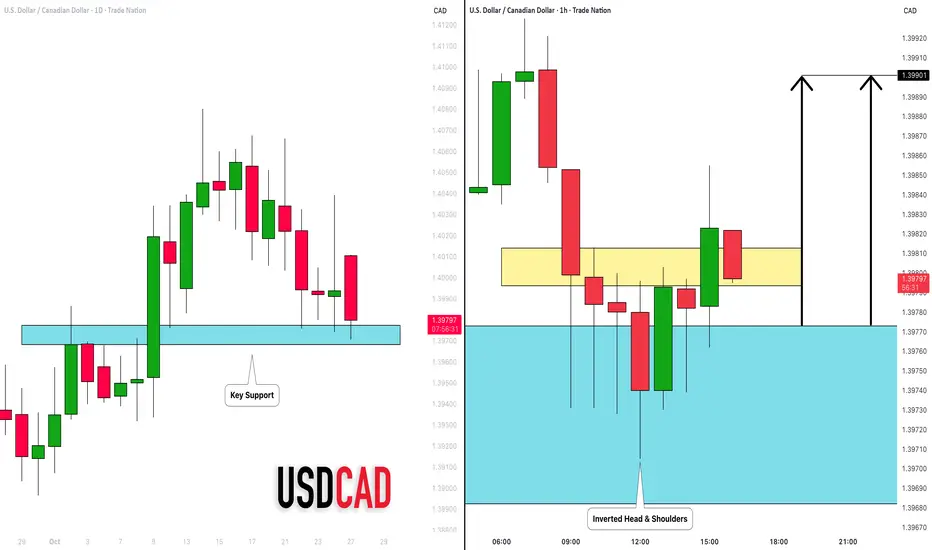
USDCAD: Pullback Trade From Support 🇺🇸🇨🇦
There is a high chance that USDCAD will pull back
from the underlined key horizontal support.
A formation of an inverted head and shoulders pattern on an hourly
time frame suggests a strong buying interest.
Goal - 1.399
❤️Please, support my work with like, thank you!❤️
I am part of Trade Nation's Influencer program and receive a monthly fee for using their TradingView charts in my analysis.
USD/CAD LONG 3 drives off major support at 1.3980 , current bullish engulfing formed off support, targeting last area of resistance

Market Analysis: USD/CAD Declines As Dollar Sees Mixed FlowsMarket Analysis: USD/CAD Declines As Dollar Sees Mixed Flows
USD/CAD declined and now consolidates below 1.4000.
Important Takeaways for USD/CAD Analysis Today
- USD/CAD started a fresh decline after it failed to surpass 1.4065.
- There was a break below a key bullish trend line with support at 1.3995 on the hourly chart.
USD/CAD Technical Analysis
On the hourly chart of USD/CAD, the pair climbed toward 1.4065 before the bears appeared. The US Dollar formed a swing high near 1.4065 and recently declined below 1.4020 against the Canadian Dollar.
There was a break below a key bullish trend line with support at 1.3995. Finally, there was also a close below the 50-hour simple moving average and 1.4000. The bulls are now active near 1.3970. The pair is now consolidating losses below the 23.6% Fib retracement level of the downward move from the 1.4039 swing high to the 1.3978 swing low.
If there is a fresh increase, the pair could face resistance near 1.4000 and the 50-hour simple moving average. The first major pivot level is 1.4015 and the 61.8% Fib retracement.
The next stop for the bulls on the USD/CAD chart could be 1.4040. If there is an upside break above 1.4040, the pair could rise toward 1.4070. A close above 1.4070 might start a steady increase toward 1.4150.
If there is another decline, the pair might find bids near 1.3970. The first major support is near 1.3950. A close below the 1.3950 level might trigger a strong decline. In the stated case, USD/CAD might test 1.3880. Any more losses may possibly open the doors for a drop to 1.3840.
This article represents the opinion of the Companies operating under the FXOpen brand only. It is not to be construed as an offer, solicitation, or recommendation with respect to products and services provided by the Companies operating under the FXOpen brand, nor is it to be considered financial advice.

USD/CAD – Key Area Breakout SetupAnalysis:
Price is currently consolidating within a defined zone (highlighted area). This zone is acting as a critical decision point where either buyers or sellers will take control. The market is showing indecision, and a clear break of this area will determine the next directional move.
Scenario 1 – Bullish Break:
If price breaks above the top of this zone (~1.3997), it could trigger a strong upward move toward the next resistance at ~1.4021. Look for confirmation with bullish momentum and potential retests of the breakout level for entry.
Scenario 2 – Bearish Break:
If price breaks below the bottom of this zone (~1.3951), it may initiate a downward continuation toward the next support. Watch for selling pressure to validate the breakout and consider retests for entry opportunities.
Trade Plan:
Entry: Break and retest of the zone
Stop Loss: Opposite side of the breakout zone
Take Profit: Next key support/resistance level
Concept:
This is a breakout and retest strategy. The highlighted area is your reference for bias. Do not take trades inside the zone unless a clear breakout is confirmed.

USDCAD Breaks Out After CPI – The Bullish Wave Is Rising!Hello traders!
USDCAD is showing strong bullish momentum after tonight’s U.S. economic data release. The annual CPI rose to 3.1% , higher than the forecast of 2.9% , signaling persistent inflation pressure and suggesting that the Fed may delay rate cuts . This has boosted the U.S. dollar, providing solid support for USDCAD to move higher.
On the H1 chart, price has broken above both the EMA34 and EMA89 resistance zones while holding firm above the key psychological level of 1.4000. This indicates a shift from consolidation to a short-term bullish phase. The current price structure is forming a W-pattern, with the next target around 1.4030.
If price continues to stay above 1.4000, buying pressure could drive USDCAD to break the upper boundary of the descending channel, opening the way toward 1.4050–1.4100. The overall short-term trend remains mildly bullish , supported by stronger-than-expected U.S. CPI data and the renewed strength of the USD.

USD/CAD Holding Support as Bulls Face Fed / BoC Rate Decisions USD/CAD is trading just above support early in the week with the Bank of Canada on tap Wednesday.
Initial support rests with the 2022 high at 1.3978 with the 200-day moving average converging on pitchfork support just lower at 1.3957- losses would need to be limited to this slope IF price is heading higher on this stretch.
Initial resistance is eyed with the 38.2% retracement of the yearly range at 1.4019 with a close above the monthly high-day close (HDC) at 1.4045 needed to mark resumption of the July uptrend. Subsequent resistance objective eyed at 1.41 and the 50% retracement / November high at 1.4166/78.
A break below this formation would threaten a decline back towards the October open at 1.3920 with critical support seen at the 2022 high close / 2023 high at 1.3881/99.
Keep in mind the Bank of Canada & Fed interest rate decisions are on tap Wednesday- stay nimble into the release and watch the weekly / monthly close on Friday for guidance here.
-MB


USD/CAD Declines Amid a Flurry of Market NewsUSD/CAD Declines Amid a Flurry of Market News
The Canadian dollar strengthened against the U.S. dollar today, pushing USD/CAD down to 1.39750 – a level that acted as resistance in early October but has since turned into support.
The pair’s fluctuations come amid a busy news backdrop. On Friday:
→ President Trump announced the suspension of trade talks with Canada, reportedly due to his dissatisfaction with Canadian advertising campaigns using Ronald Reagan’s image to criticise tariffs.
→ The CPI report came in weaker than expected. According to Forex Factory, U.S. annual inflation stood at 3.0%, compared with the 3.1% forecast by analysts.
This week could bring heightened volatility as markets await two key rate decisions on Wednesday:
→ At 16:45 GMT+3, the Bank of Canada is expected to cut its policy rate from 2.50% to 2.25%;
→ At 21:00 GMT+3, the Federal Reserve is forecast to lower the Federal Funds Rate from 4.25% to 4.0%.
Both announcements will be accompanied by policy statements that could significantly influence USD/CAD price action.
Technical Analysis: USD/CAD Chart
Last month’s analysis highlighted two key structures:
→ A red long-term descending channel originating in early February;
→ A blue ascending channel formed by price swings since mid-summer.
Since then:
→ Bulls managed to break above the red channel’s upper boundary;
→ The price consolidated around the median line of the blue channel in early October.
From a bearish perspective:
→ The price failed to hold above the psychological level of 1.4000;
→ A sequence of lower highs forms a descending trendline.
From a bullish perspective:
→ The blue channel remains intact;
→ 1.39750 serves as support;
→ An additional support zone lies just below, near the breakout point of the red channel where buying pressure was previously strong.
Given these factors, the red trendline may represent a corrective pattern within the broader bullish structure. Whether buyers can resume the uptrend successfully will largely depend on the upcoming central bank decisions and any further statements from President Trump.
This article represents the opinion of the Companies operating under the FXOpen brand only. It is not to be construed as an offer, solicitation, or recommendation with respect to products and services provided by the Companies operating under the FXOpen brand, nor is it to be considered financial advice.


USDCAD BiasSweep of Previous Day high to mitigate OB.
If the setup fails which is likely, then I'll wait to enter aggressively at 1.40801.
Manage risk if interested.

USDCAD Expected Growth! BUY!
My dear subscribers,
USDCAD looks like it will make a good move, and here are the details:
The market is trading on 1.3993 pivot level.
Bias - Bullish
My Stop Loss - 1.3986
Technical Indicators: Both Super Trend & Pivot HL indicate a highly probable Bullish continuation.
Target - 1.4007
About Used Indicators:
The average true range (ATR) plays an important role in 'Supertrend' as the indicator uses ATR to calculate its value. The ATR indicator signals the degree of price volatility.
Disclosure: I am part of Trade Nation's Influencer program and receive a monthly fee for using their TradingView charts in my analysis.
———————————
WISH YOU ALL LUCK

USDCAD | Bearish Reversal Forming at Overlap ResistanceBased on the M30, we can see that the price is reacting off the sell entry whic is an overlap resistance and could drop from this level to the downside.
Sell entry is at 1.4004, which is an overlap resistance.
Stop loss is at 1.4019, which is a pullback resistance that aligns with the 61.8% Fibonacci retracement.
Take profit is at 1.3978, which is a multi swing low support.
Stratos Markets Limited (tradu.com ):
CFDs are complex instruments and come with a high risk of losing money rapidly due to leverage. 68% of retail investor accounts lose money when trading CFDs with this provider. You should consider whether you understand how CFDs work and whether you can afford to take the high risk of losing your money.
Stratos Europe Ltd (tradu.com ):
CFDs are complex instruments and come with a high risk of losing money rapidly due to leverage. 70% of retail investor accounts lose money when trading CFDs with this provider. You should consider whether you understand how CFDs work and whether you can afford to take the high risk of losing your money.

USDCAD TRADE SETUPWait for break and retest the entry level then take a trade for Sell otherwise skip this setup
