Dollar - Yuan: topDonald Trump 46=7th president of the United States in Nov2024. Dollar - Yuan: top developing very well. High probability. First target is 6.
US Dollar/Chinese Yuan
No trades
Market insights

USD/CNH: The Trade War Pressure Point
USD/CNH is at the centre of the tariff war. A three-year resistance zone near 7.35/7.32 has failed once again. This repeated failure shows strategic resistance by Chinese policymakers or macro selling pressure.
Support Levels: 7.27 and 7.25 must hold. A drop through these levels could spark a move to 7.20 and 7.17.
Geopolitical Lens: China may begin allowing Yuan appreciation to avoid excessive inflation from import tariffs. This could shock the USD/CNH lower and stoke global de-dollarization narratives.

US-China Trade War: Impacts on Financial Markets
The trade war between the United States and China has reached unprecedented levels, with the imposition of reciprocal tariffs that are upsetting the global economic balance. China has recently increased tariffs on American products up to 50%, while President Trump has temporarily suspended tariffs for three months, trying to negotiate with other nations. This scenario is generating strong volatility in the financial markets and profoundly affecting the Forex market.
Analysis of the Impacts on Financial Markets
Stock Markets: The main world stock exchanges are recording significant fluctuations. Asian and European indices have suffered drastic drops, reflecting investor uncertainty.
Raw Materials: The price of oil and precious metals shows instability, with oscillations that reflect global nervousness. Gold, considered a safe haven, is gaining ground, exceeding the threshold of 3,000 dollars.
Economic Sectors: Sectors such as technology and agriculture are particularly hard hit, with export restrictions and rising production costs.
Impact on Forex
The trade war is directly impacting the currency market:
US Dollar (USD): The dollar is coming under pressure due to economic uncertainty and recession fears in the United States. The Federal Reserve may be forced to cut interest rates further.
Chinese Yuan (CNY): The yuan is under pressure, with the risk of lower exports to the US and a slowdown in Chinese economic growth.
Safe Haven Currencies: The Swiss Franc (CHF) and the Japanese Yen (JPY) are gaining ground, as investors seek stability amid global volatility.
Commodity Currencies: The Australian Dollar (AUD) and the Canadian Dollar (CAD) could be negatively impacted by fluctuations in international trade.
Forex Strategies for Traders
In a context of high volatility, traders must adopt targeted strategies:
Constant Monitoring: Follow the developments of the trade war and the decisions of central banks.
Diversification: Invest in safe haven currencies to reduce risk.
Technical Analysis: Use analysis tools to identify trading opportunities based on market movements.
Risk Management: Set stop-loss and take-profit to protect capital.
This situation requires attention and flexibility from traders, who must adapt their strategies to the new market dynamics. If you need further insights or a specific analysis on a currency, I am here to help!

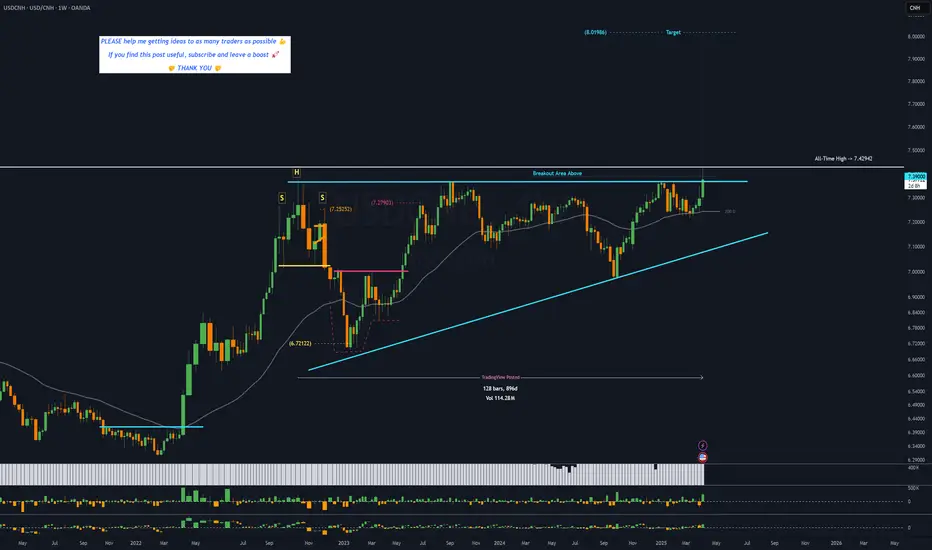
USDCNH - 30 months ASCENDING TRIANGLE══════════════════════════════
Since 2014, my markets approach is to spot
trading opportunities based solely on the
development of
CLASSICAL CHART PATTERNS
🤝Let’s learn and grow together 🤝
══════════════════════════════
Hello Traders ✌
After a careful consideration I came to the conclusion that:
- it is crucial to be quick in alerting you with all the opportunities I spot and often I don't post a good pattern because I don't have the opportunity to write down a proper didactical comment;
- since my parameters to identify a Classical Pattern and its scenario are very well defined, many of my comments were and would be redundant;
- the information that I think is important is very simple and can easily be understood just by looking at charts;
For these reasons and hoping to give you a better help, I decided to write comments only when something very specific or interesting shows up, otherwise all the information is shown on the chart.
Thank you all for your support
🔎🔎🔎 ALWAYS REMEMBER
"A pattern IS NOT a Pattern until the breakout is completed. Before that moment it is just a bunch of colorful candlesticks on a chart of your watchlist"
═════════════════════════════
⚠ DISCLAIMER ⚠
Breakout Area, Target, Levels, each line drawn on this chart and any other content represent just The Art Of Charting’s personal opinion and it is posted purely for educational purposes. Therefore it must not be taken as a direct or indirect investing recommendations or advices. Entry Point, Initial Stop Loss and Targets depend on your personal and unique Trading Plan Tactics and Money Management rules, Any action taken upon these information is at your own risk.
═════════════════════════════
Time ot use Forward or Option to buy USDCNHThe offshore Chinese yuan (USDCNH) has tested the 7.37 level for the fourth time since October 2022, signaling a potential breakout. Historically, such scenarios often lead to interest rate hikes, as seen with currencies like the Turkish lira, Russian ruble, and Argentine peso during periods of special economic situation. However, trading USD/CNH via CFDs is generally not recommended due to the high risk associated with leveraged products. Investors seeking exposure to this currency pair may consider alternatives such as options or forward contracts, which offer more structured and risk-managed trading strategies.

USDCNH Tests Key Pattern Resistance on PBOC’s Loose Yuan FixThe trade war between China and the U.S. is escalating, and the Chinese yuan is starting to feel the pressure. After the U.S. raised tariffs to a total of 54%, China responded with a 34% increase of its own. Now, Trump has threatened an additional 50% tariff hike if China doesn’t withdraw its retaliation.
It appears unlikely that either side will back down at this stage, and the trade war is set to intensify further.
In addition to retaliating, China is also preparing to defend its economy. According to several news reports, Beijing is planning to frontload stimulus measures aimed at boosting domestic consumption, subsidizing exporters to cushion the blow from reduced U.S. trade, and supporting stock market stability. The People’s Bank of China will likely play a central role in this effort, using tools such as rate adjustments and daily yuan fixings.
The latest yuan fixing came in above 7.20, the highest level since 2023. With this looser fixing and ongoing trade war pressure, USDCNH is pushing higher. The ascending triangle formation which typically breaks to the upside is also supporting bearish bets on the yuan.
If China proceeds with a small and controlled devaluation, as many expect, a breakout from this triangle pattern is likely.
The potential target for the breakout could align with one of the parallel lines of the lower boundary of the formation, which are currently around 7.61 and 7.75, and gradually rising. With time, a move toward 7.80 is well within reach by the end of the year.

China: 34% Tariffs Against US, Impact on Forex Market
Hello, I am Forex Trader Andrea Russo and today I want to talk to you about China's response to US Tariffs. China's recent decision to impose 34% counter-tariffs on US products represents a significant development in trade tensions between the world's two largest economies. This move, which will take effect on April 10, is a direct response to the 10% tariffs imposed by the United States. The announcement has already had repercussions on global markets, with stocks recording sharp declines. In this article, we will analyze the motivations behind this decision, its economic implications and the impact on the Forex market.
Motivations Behind the Counter-Tariffs
China's decision to impose counter-tariffs is a strategic response to the aggressive trade policies of the United States. The 10% tariffs imposed by the US are aimed at correcting what is perceived as an unfair trade deficit and protecting domestic industries. However, China sees these tariffs as a threat to its economic growth and the stability of its exports. The 34% counter-tariffs are therefore an attempt to rebalance the trade balance and put pressure on the United States to review its policies.
Global Economic Implications
The imposition of counter-tariffs has economic implications that go far beyond the two nations involved. Trade tensions can trigger a series of chain reactions that affect the global economy in various ways:
Increased Production Costs: Companies that rely on imports of raw materials and components from the United States will see an increase in production costs, which could be passed on to consumers in the form of higher prices.
Slower Economic Growth: Trade tensions can lead to a slowdown in global economic growth, as companies may reduce investment due to economic uncertainty.
Inflation: Rising prices of imported goods can contribute to inflation, reducing the purchasing power of consumers and increasing costs for businesses.
Forex Market Impact
The Forex market, known for its sensitivity to geopolitical and economic events, is not immune to the effects of the trade tensions between China and the United States. Here are some of the main impacts:
US Dollar Volatility: The increase in tariffs could weaken the US dollar, as trade tensions tend to reduce investor confidence. Demand for US goods could decrease, negatively impacting the value of the dollar.
Strengthening of the Chinese Yuan: China could see a strengthening of the yuan, as its economy could be perceived as more stable than that of the United States in this context of trade tensions.
Federal Reserve Monetary Policy: The Federal Reserve could be forced to review its monetary policy, with possible interest rate cuts to mitigate the economic impact of the tariffs. This could further impact the Forex market, increasing volatility.
Conclusion
China's decision to impose counter-tariffs of 34% on US products represents a significant development in the trade tensions between the world's two largest economies. The economic implications of this move are vast and complex, affecting not only national economies but also the global Forex market. Investors and analysts will need to monitor these developments closely to fully understand their implications and adjust their strategies accordingly.

USD/CNH Breakout – Strength Following PMI DataWe are witnessing a breakout in USD/CNH, with CNH being significantly impacted by tariff developments. Following the release of USD PMI data, the dollar is showing renewed strength, reinforcing bullish momentum.
After a liquidity sweep, USD/CNH has gained traction, and today’s price action has formed a strong engulfing bar, signaling continued upside potential. With this confirmation, the pair is poised for further gains as buyers step in.

USD/CNH Near Pivotal Support – AUD, NZD Implications LoomUSD/CNH isn’t everyone’s favourite pair to trade, but it should be on your radar if you dabble in AUD/USD or NZD/USD. Its correlation coefficient with AUD/USD ranges from -0.72 to -0.96 across timeframes from five days to six months, while for NZD/USD, it sits between -0.78 and -0.95. That suggests a strong relationship when comparing performance against the U.S. dollar, especially in the very near and longer term.
That’s noteworthy given where USD/CNH sits on the charts, teetering just above 7.2345—a level where bearish moves have repeatedly fizzled in recent months. However, with momentum indicators biased lower, another attempt may have more success.
A sustained push below 7.2345 could encourage additional bears to join the break, particularly if minor support at 7.2130 gives way. While the 200DMA sits in between, price action has largely ignored it recently, showing far more interaction with the 50-day equivalent. That makes it worth noting but not a major barrier.
Below 7.2130, there’s little visible support until 7.1400—a level that capped gains for extended periods last October before the U.S. presidential election. If 7.2345 holds firm, traders may look for a potential retest of recent range highs around 7.3000 and the 50-DMA.
Good luck!
DS

Elliott Waves SHows That Gold Is Turning South For Corrective ReGold started the year bullish with a strong extended leg to the upside close to 3k, but the move looks impulsive and may have found a temporary top near 2950. The reversal this week is coming from an ending diagonal, with the price now attempting to break the lower trendline support of the bullish channel. This suggests gold could be entering a corrective wave 4, likely unfolding in three waves. For those looking to join the trend, it’s better to wait for a deeper correction and a retest of lower support in this wave four pullback. Supports are at 2864 and 2789
At the same time, keep an eye on USD/CNH—if it pushes higher now for wave four, to retest its 2022 highs, gold could remain sideways for a while. In such case the new opportunities to rejoin the gold uptrend may come after USD/CNH completes its recovery from the 2024 lows, possibly around 7.40.
GH

USDCNHDollar is strengthening after opening bearish. We can see selling liquidity trapped or being squeezed.

USDCNH Trade Setup - Bearish Target Zones📉 USDCNH Trade Setup - Bearish Target Zones 📉
Price is testing a key level—watching for a move toward 7.248 and potentially 7.240 before the deadline.
🔹 Current Price: 7.256
🔹 Target 1: 7.248
🔹 Target 2: 7.240
🔹 Deadline: Feb 23, 22:00 UTC
Will sellers take control and push price lower? Let’s see how it plays out! 🔥 Drop your analysis below! 👇🏼
#USDCNH #ForexTrading #TechnicalAnalysis #PriceAction #TradeSetup #MarketMoves #TradingStrategy

China-US Tariffs: Impact on Forex
Hello, I am professional trader Andrea Russo and today I want to talk to you about a hot topic that is shaking up global markets: the introduction of new tariffs by China towards the United States and the impact that this news is having on the Forex market.
A New Chapter in the US-China Trade War
For weeks, the investment world has been monitoring the evolution of tensions between two of the world's largest economies: the United States and China. After months of negotiations, China has decided to implement new tariffs on US products, intensifying the trade war that began a few years ago. The news had an immediate effect on global markets and, as always, Forex is one of the markets most sensitive to these geopolitical developments.
Direct Impact on USD Currency Pairs
The US dollar (USD) suffered a strong backlash after the announcement. In fact, the tariffs can reduce US exports to China, negatively affecting the US trade balance and fueling uncertainty among investors. The immediate result? A weakening of the dollar against several currencies.
The most affected currency pairs were:
EUR/USD: The euro gained ground, rising to levels not seen in weeks. Economic uncertainty resulting from tariffs has prompted investors to flee to currencies deemed safer, such as the euro.
GBP/USD: The British pound followed a similar trajectory, gaining against the dollar. Although Brexit remains a hot topic, the weakness of the dollar has given the British currency some respite.
USD/JPY: The Japanese yen, traditionally considered a safe haven, benefited from the uncertainty, appreciating against the dollar. A flow of capital into Japan was a direct result of the change in risk perception.
Effects on the Chinese RMB
The Chinese currency, the renminbi (RMB), has also fluctuated significantly. While China is trying to limit the effect of tariffs on its domestic market, the market response has been cautious. In particular, investors are preparing for a possible controlled devaluation of the renminbi, with the intention of maintaining the competitiveness of Chinese exports, which could suffer from higher tariffs.
The Role of Central Banks
Another factor that cannot be ignored in this context is the approach of central banks. The US Federal Reserve (Fed) could decide to review its monetary policies to counter the negative effects of tariffs on the dollar. We could see an easing of monetary policy or even a reduction in interest rates, unless the Fed wants to contain the rising inflation caused by tariffs.
On the other hand, the People’s Bank of China (PBoC) could be forced to take measures to support the Chinese economy. The possibility of a currency intervention could have significant effects not only on Forex, but also on other asset classes such as commodities and stock markets.
How to Capitalize on the Situation in Forex Trading
The developments surrounding the US-China trade war are a boon for Forex traders, provided they are able to carefully monitor the news and react quickly. Here are some strategies to consider:
Breakout Trades: The news of the tariffs has triggered significant movements, and experienced traders can look to enter breakout trades on the most volatile currency pairs. This involves looking to enter long or short positions when a currency pair breaks out of certain support or resistance levels.
Risk-Based Strategies: The uncertainties surrounding the trade war can force traders to be more selective in their trades. Careful risk management strategies, such as risk-reward ratios and stop-loss orders, are essential to navigate the turbulent waters.
Monitoring Central Bank Statements: Any signals from the Fed or the PBoC are crucial. Traders should be prepared to react quickly to any changes in monetary policies, as they can immediately impact the value of the currencies involved.
Final Thoughts
China’s decision to impose new tariffs on the United States marks a new phase in the trade war between the two economic powers. In an already volatile Forex market, this move adds further uncertainty, with the USD likely to face a period of weakness while other emerging currencies, such as the renminbi, could suffer mixed effects.
Happy trading to all.
Andrea Russo

Trade War Begins? China Strikes Back with TariffsIn what could be the beginning of a trade war, China's retaliatory import taxes on certain U.S. goods are set to take effect on Monday.
Beijing has imposed a 15% tariff on coal and liquefied natural gas, along with a 10% tariff on crude oil, agricultural machinery, and pickup trucks. It has also introduced export controls on 25 rare metals critical to electronics and military equipment.
On Friday, U.S. President Donald Trump announced plans for new reciprocal tariffs but delayed imposing duties on small-value packages from China until a processing system is in place. Ending the exemption for these imports, and subjecting them to the new 10% tariff, could generate $53 billion in federal tax revenue, according to the Tax Foundation.
In 2023, U.S. customs processed over 1 billion small packages, up from 134 million in 2015, with about 4 million shipments arriving daily, many via platforms like Shein and Temu.

USD/CNH Chart Sees Spike in Volatility Due to TariffsUSD/CNH Chart Sees Spike in Volatility Due to Tariffs
In response to the Trump administration's 10% tariff on Chinese goods, Beijing vowed to challenge the decision at the World Trade Organization.
Moreover, Chinese authorities have:
→ imposed retaliatory tariffs of 15% on US coal and liquefied gas, and 10% tariffs on oil and agricultural machinery;
→ launched an investigation into Google for potential anti-competitive practices.
These recent developments have triggered a spike in volatility for the Chinese yuan against the US dollar. As the USD/CNH chart shows today, the ATR indicator is at its highest level since early November, when Trump celebrated his election victory.
On 9 January, in our analysis of the USD/CNH exchange rate, we noted:
→ the importance of the 7.35 level, which had acted as resistance for several months;
→ according to Wang Tao, chief economist at UBS China, the yuan may weaken to 7.6 per dollar by the end of 2025 if the Trump administration imposes higher tariffs.
Today's technical analysis of the USD/CNH chart shows:
→ the rate is supported by the lower boundary of an expanded ascending channel (shown in blue);
→ the 7.35 level continues to act as resistance (as indicated by the red arrow).
Thus, at the beginning of February 2025, we may witness the formation of a narrowing triangle (shown by the black lines), and a breakout could lead to a significant trend movement. How realistic this assumption is largely depends on how the ongoing tariff conflict between the US and China develops.
Trade on TradingView with FXOpen. Consider opening an account and access over 700 markets with tight spreads from 0.0 pips and low commissions from $1.50 per lot.
This article represents the opinion of the Companies operating under the FXOpen brand only. It is not to be construed as an offer, solicitation, or recommendation with respect to products and services provided by the Companies operating under the FXOpen brand, nor is it to be considered financial advice.

Dollar-yuan’s momentum decreases after better Chinese dataMuch stronger GDP and exports from China gave some support to the offshore yuan in the last few days but not enough to realise a notable recovery. There remains some concern over the job market in China while traders are also widely anticipating negativity from new American tariffs in the next few months.
USDCNH hasn’t made a clear new high in 2025 and remains close to the 18-year high around ¥7.37, so traders should be aware that a false breakout is quite likely in this situation. There’s no longer an overbought signal from the slow stochastic but at around 70 this remains close to the zone of buying saturation.
Both the 20 and 50 SMAs are important dynamic areas of support, having supported the uptrend in the fourth quarter of 2024. Static supports might occur around ¥7.30 and ¥7.19.
How the price moves in the next few days depends mainly on the potential for escalation of economic disputes between the USA and China. Traders will also monitor the statement from the People’s Bank of China on 20 January for more context on its outlook for the economy.
This is my personal opinion which does not represent the opinion of Exness. This is not a recommendation to trade.

WHATS FLOWING: USDCNH (KEY LEVEL)The USDCNH chart reveals a potential trend continuation as the pair approaches key resistance levels. The upward momentum is supported by steady higher lows, and the recent price action appears to be aligning with Fibonacci retracement zones, suggesting areas of possible reversal or breakout. The overall structure indicates that traders might keep a close watch for a breakout above resistance or a pullback to support levels, which could present trading opportunities. The bottom indicator reflects a strengthening trend correlation. Let’s monitor this flow for further confirmation in the coming sessions!
Trading leverage is a powerful tool that amplifies your exposure to financial markets by allowing you to control a larger position than your initial capital. Essentially, leverage is a loan provided by your broker that enables you to maximize potential profits without tying up substantial amounts of capital. However, it also magnifies losses, making effective risk management crucial.

USD/CNH Near Key Resistance: 2025 OutlookUSD/CNH Near Key Resistance: 2025 Outlook
As shown by today’s USD/CNH chart:
→ the pair is trading around 7.35 yuan per US dollar;
→ historically, this level has acted as resistance, pushing the exchange rate lower in autumn 2022 and autumn 2023, as bulls briefly broke above but failed to sustain gains.
The current approach to this resistance level is partly driven by expectations of US President-elect Donald Trump’s policies, which in 2025 may include imposing trade tariffs and adopting measures likely to strengthen the USD further.
According to Reuters:
→ China holds approximately $3 trillion in foreign exchange reserves, giving it ample power to defend the yuan;
→ Wang Tao, Chief Economist at UBS for China, expects the USD/CNH rate to remain controlled near 7.4 yuan per dollar during the first half of 2025. However, if high tariffs are introduced by Trump’s administration, the yuan could weaken to 7.6 per dollar by the end of 2025.
Technical analysis of the USD/CNH chart reveals:
→ price fluctuations are forming a large contracting triangle, with higher lows in 2023 and 2024 indicating stronger demand;
→ an upward trend structure, highlighted in blue, emerged in late 2024;
→ a grey arrow points to the trend direction calculated using linear regression.
Thus, in early 2025, another attempt at a bullish breakout above 7.35 may occur, though resistance from bears could cause short-term pullbacks towards the lower blue trend line. Given Wang’s bullish outlook and supporting technical signals, it is reasonable to expect bulls to gain control of the 7.35 level during 2025.
This article represents the opinion of the Companies operating under the FXOpen brand only. It is not to be construed as an offer, solicitation, or recommendation with respect to products and services provided by the Companies operating under the FXOpen brand, nor is it to be considered financial advice.

The next few months will be crucial for USDCNHCurrencies play a pivotal role in the trading game, as in importers from China. They buy goods from US and pay in USD , therefore if the CNH is depreciating 2013, that means their costs will get higher. In 2013, 6 yuan equal to 1 USD , fast forward 11 years later, it is now 7.3 yuan to 1 USD. That is almost 11.8% depreciation on a YOY basis for the last 11 years.
Someone has to bear the costs and it is naturally the final ends of the straw, from wholesalers to retailers to final consumers.......
Some supporting article :https://www.msn.com/en-ph/money/economy/china-s-exports-slow-imports-decline-in-november/ar-AA1vHpLN
Will I trade this pair? Very unlikely as there were no historical data to show it will breaks above the current 7.3 price level. If it does and as predicted by analysts that it will goes to 8, then the risk reward ratio is very good.
Please DYODD

USDCNH: UPDATE FROM LASTCALLPrevious posting of 3 of 3 down is negated because of overlap of minor ii exceeded the start of i. The structure now suggests a probable wave a and wave b are formed and a downswing for wave c.
There are other possible outcome from this current structure which is also a possible triangle pattern. if so, then the latest low must not be breached and has bullish implication.
Watch for development

USDCNH: Triangle Pattern Targets 8.03 Consolidation on the weekly chart has shaped the well-known Triangular pattern (yellow).
Watch the breakout of the upside barrier around 7.3650 for confirmation.
The target is located at the height of the widest part of Triangle added to the upside of the pattern. It's 8.03 CNH/$1

USDCNH Going Up Hi there,
USDCNH is above the RSI level of 50 and the RSI moving average, indicating a bullish trend as it heads toward the supply area.
If the price breaks through the supply area, it could potentially rise even higher. However, I anticipate a possible rejection at that level, which may bring prices down to the 6.6-6.5 range.
Have a great week,
K.

USDCNY | Market outlook
The USD/CNY strengthened on Tuesday as a stronger U.S. dollar and concerns over a weak Chinese economy put pressure on the Yuan.
Recent data from China revealed that manufacturing activity fell to a six-month low in August, while growth in new home prices also slowed during the same period.
Additionally, the property sector has yet to respond positively to Beijing's series of stimulus measures, continuing to drag down the overall economy.
