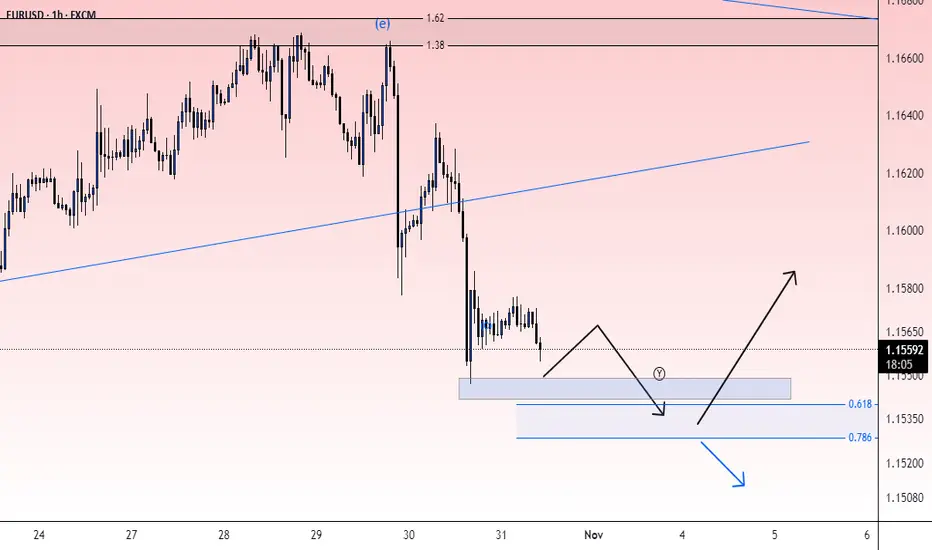
Euro Holds Support as Buyers Eye Recovery Ahead of Fed DecisionEURUSD has rebounded from a key support zone after forming a higher low on the 1H timeframe. The pair remains within a bullish corrective structure, signaling potential for further upside as long as the support area holds. A short-term push toward the resistance zone is likely as momentum builds ahead of major U.S. events.
Key Levels:
Buy Entry: 1.16333
Take Profit: 1.16573
Stop Loss: 1.16194
Reasoning:
Technically, the price is reacting strongly from the support area with bullish momentum showing early signs of continuation. The 1H chart suggests a potential shift in structure favoring buyers.
Fundamentally, traders await the FOMC statement and Federal Funds Rate decision, which could weigh on USD sentiment, potentially supporting EUR strength in the short term.
Disclaimer:
This analysis is for educational purposes only and does not constitute financial advice.
Trade ideas

SHORT (EURUSD)Supply and demand factors seem likely, as this chart shows, a risk-to-reward ratio of 1 to 4.

EURUSD SELLEURUSD H4 CHART
Hello Traders. If you find this analysis useful, please support me with your likes and comments.
If you have another analysis at this pair, please share in comments, I will be glad to discuss with you.

EURUSD: two possible scenarios for buy setupEURUSD: two possible scenarios for buy setup. EURUSD will have a bullish move, either with correction, or with continuation move.
Cheers

EUR-USD Bearish Breakout! Sell!
Hello,Traders!
EURUSD has broken below the horizontal supply area, confirming a bearish structure shift. A short-term pullback could provide premium entries toward the next liquidity pool below.Time Frame 4H.
Sell!
Comment and subscribe to help us grow!
Check out other forecasts below too!
Disclosure: I am part of Trade Nation's Influencer program and receive a monthly fee for using their TradingView charts in my analysis.

SELL EURUSDI am selling EURUSD right now. I do feel this will fall way lower so will continue to add positions depending on the movement over the next few days

EUR/USD: Bearish Pullback to 1.155?FX:EURUSD is flashing bearish signals on the 4-hour chart , where price is respecting a downward trendline with successive lower highs, indicating ongoing weakness and potential for further downside as sellers maintain control near the resistance zone. This setup points to a classic continuation pattern if the trendline holds as resistance.
Entry zone between 1.168-1.170 for a short position. Target at 1.155 near the support zone, offering a risk-reward ratio greater than 1:2.5 . Set a stop loss on a close above 1.1745 to protect against an upside break. Look for confirmation on a breakdown below the entry with rising volume, amid persistent USD strength over the EUR.
Fundamentally , this week features key GDP releases from the Eurozone (Q3 flash on October 29) and the US (Q3 advanced on October 30). Additionally, the upcoming meeting between Trump and Xi could lead to a US-China trade agreement or lack thereof, significantly impacting markets. 💡
📝 Trade Plan:
🎯 Entry Zone: 1.168 – 1.170 (short setup near resistance)
❌ Stop Loss: Close above 1.1745
✅ Target: 1.155 (support zone)
💎 Risk-to-Reward: Greater than 1:2.5, offering a high-quality short opportunity within the prevailing bearish trend.
What's your outlook on this setup? Drop your thoughts

EURUSD | Bias Shift & QML Zone in FocusThe previous setup has been invalidated as the market showed a clear Change of Character (ChoCh), flipping the structure and order flow to bullish.
With that shift, my bias has now turned bullish, and I’ve marked the QML (Quasimodo Level) zone as my area of interest.
I’ll be waiting for price to tap into this zone and show confirmation before considering any execution.
Adaptability is part of discipline — the market evolves, and so should the bias.
⚠️ Disclaimer: This analysis is for educational purposes only. Always manage your risk and trade responsibly.

Potential Short: EURUSD, 1H.Potential short setup on 1H EURUSD. Always do your own analysis before took someone else.

Market Insights with Gary Thomson: 27 - 31 OctoberMarket Insights with Gary Thomson: US and Canada Rate Decisions, Earnings Reports & Trade Tensions
In this video, we’ll explore the key economic events and market trends, shaping the financial landscape. Get ready for insights into financial markets to help you navigate the week ahead. Let’s dive in!
In this episode of Market Insights, Gary Thomson unpacks the strategic implications of the week’s most critical events driving global markets.
👉 Key topics covered in this episode:
— US Interest Rate Decision
— Canada Interest Rate Decision
— Corporate Earnings Reports
— Trade Tensions
Gain insights to strengthen your trading knowledge.
This video represents the opinion of the Companies operating under the FXOpen brand only. It is not to be construed as an offer, solicitation, or recommendation with respect to products and services provided by the Companies operating under the FXOpen brand, nor is it to be considered financial advice.

6E - EUR/USD // SHORT SETUP [Short-Term]Context
The market maintains a short-term bearish structure.
In the previous update, we observed a structural realignment across all horizons, but sellers have now regained control. Price is developing a new short-term dealing range to the downside, targeting long-term demand to assess whether buyers can regain initiative.
Global Macro
United States
Inflation: 3% (above forecast)
Interest Rate: 4% (-0.25%)
Real Rate: 1%
→ Positive real yields continue to support USD strength and sustain the current yield advantage.
Euro Area / Germany
Inflation: 2.3% (above forecast)
Interest Rate: 2.15% (unchanged)
Real Rate: -0.15%
→ Negative real yields weigh on the euro, reinforcing the divergence in policy stance relative to the Fed.
The yield differential continues to improve in favor of the USD following the Fed’s hawkish cut.
The COT Report remains unavailable during the ongoing U.S. government shutdown.
Price Action
A clear breakdown and acceptance of the previous short-term dealing range confirms the bearish bias.
Price is currently trading below the Value Area Low (VAL), indicating an imbalanced market.
The primary supply zone sits immediately above the LVN, aligning with the VWAP — forming an institutional area for potential repositioning.
This structure suggests a controlled continuation phase, with sellers likely to defend that zone upon retest.
Volume Analysis
Volume distribution shows a cluster of selling aggression inside the supply zone, reinforcing short-side dominance.
Below the VAL, the market remains in downward price discovery, seeking efficiency toward the long-term demand zone near 1.1550.
Setup
Bias: Short
Trigger: Wyckoff redistribution within the zone
Zone: Supply zone above LVN + VWAP confluence
RRR: ≈ 3.5
Target: LVN below 1.1550

EURUSD Short 10/28Details are in the chart.
- Clear downtrend with established LH & LL.
- Fakeout of current structure. Bearish flag waiting to descend. Need to shakeout more sellers.
- MACD Free fall.
If you can get good at one thing in the FOREX space, it should be technical analysis. It tells all, before any new fundamentals are known.
Alex

New Lower Low ExpectedEUR is trending down and is likely to hit 1.14500 anytime soon. 1.14500 is new target area.


EUR/USD Slide Begins! Market Flow Shifts Bearish🎯 EUR/USD "THE FIBER" 🔥 | Cash Flow Heist Strategy (Swing/Day Trade)
📊 MARKET SETUP
🐻 Bias: BEARISH CONFIRMED
✅ Technical Confirmation: Triangular Moving Average Breakout
⚡ Strategy Type: The Thief Layering Method
🎯 THE HEIST PLAN (Entry Strategy)
🔫 Thief Style = Layered Limit Orders
Instead of one entry, we're placing multiple sell limit orders to catch the best average price:
Suggested Entry Layers:
🎯 Layer 1: 1.17000
🎯 Layer 2: 1.16800
🎯 Layer 3: 1.16500
🎯 Layer 4: 1.16300
Note: You can add more layers based on your account size and risk appetite. This is NY session pricing strategy.
🛡️ RISK MANAGEMENT
🚨 Stop Loss: 1.17300
💰 Take Profit Target: 1.15400
⚠️ IMPORTANT DISCLAIMER:
Dear Ladies & Gentlemen (Thief OG's) - These are MY levels for reference only. Always manage your own risk! If you see profit, secure it. Your account, your rules. Don't be greedy when the market pays you! 💵
Why 1.15400 Target?
Strong historical support zone
Oversold conditions likely
Bull trap territory - time to escape with the loot before reversal! 🏃♂️💨
🔗 CORRELATED PAIRS TO WATCH
Keep your eyes on these connected moves:
📈 Positive Correlation (Move together):
EURGBP
- Euro strength indicator
EURJPY
- Risk sentiment gauge
EURCHF
- Safe haven flow monitor
📉 Inverse Correlation (Move opposite):
DXY
(US Dollar Index) - The boss! Strong DXY = Weak EUR/USD
GBPUSD
- Cable follows Fiber's lead often
AUDUSD
- Risk-on/risk-off cousin
💡 Pro Tip: If DXY breaks higher while EUR indices weaken, this setup gets SPICY! 🌶️
🎓 KEY TECHNICAL POINTS
✅ Triangular MA Breakout = Momentum shift confirmed
✅ Multi-layer entries = Better average cost & lower risk per position
✅ 1.17300 SL = Tight stop above resistance
✅ 1.15400 TP = Major support + psychological level
✅ Risk:Reward = Solid 2:1+ depending on entry layers
📍 Current Levels (Oct 8, 2025):
Weekly High: 1.177
Weekly Low: 1.1663
Trend: Bearish pressure continuing
⚠️ FINAL DISCLAIMER
🎭 This is "Thief Style" trading strategy - created for educational and entertainment purposes only!
This analysis represents my personal trading approach and should NOT be considered financial advice. Trading forex carries substantial risk. Past performance does not guarantee future results. Always:
Do your own analysis
Risk only what you can afford to lose
Use proper position sizing
Never trade with borrowed money
YOU are responsible for YOUR trading decisions! 🎰
✨ If you find value in my analysis, a 👍 and 🚀 boost is much appreciated — it helps me share more setups with the community!
#EURUSD #Forex #TradingStrategy #SwingTrading #DayTrading #ForexSignals #TechnicalAnalysis #PriceAction #ForexTrading #CurrencyTrading #FiberSetup #ThiefStrategy #LayeredEntry #ForexCommunity #TradingView #ForexIdeas

EUR/USD BEARISH CONTINUATION SETUP BELOW SUPPLY ZONE🔍 Key Observations:
1. Market Structure:
The chart shows a clear break of structure (BOS) to the downside, confirming bearish control.
Multiple CHoCH points show the transition from a bullish correction to renewed bearish pressure.
2. Supply Zone Rejection:
Price retraced into a supply zone (around 1.1535–1.1565) and got rejected.
This zone aligns with a premium entry area, ideal for short positions.
3. Entry & Risk Management:
Entry: Around 1.1533–1.1535
Stop Loss: Above 1.1565 (previous minor high / invalidation level)
First Target (TP1): 1.1501 – short-term liquidity pool
Second Target (TP2): 1.1461 – next demand zone / deeper liquidity area
4. Smart Money Flow:
The sequence shows liquidity sweep of minor highs followed by a strong displacement candle downward.
Suggests institutional selling resuming after retracement.
5. Momentum Outlook:
Unless the price breaks above 1.1565, the bearish trend remains intact.
Any pullback toward 1.1540–1.1550 can provide another sell opportunity.
📉 Bearish Trade Plan Summary:
Bias: Bearish
Entry Zone: 1.1533 – 1.1535
Stop Loss: 1.1565
Target 1: 1.1501
Target 2: 1.1461

EURUSD FRGNT Daily Forecast -Q4 | W44 | D30| Y25 |📅 Q4 | W44 | D30| Y25 |
📊 EURUSD FRGNT Daily Forecast
🔍 Analysis Approach:
I’m applying Smart Money Concepts, focusing on:
Identifying Points of Interest on the Higher Time Frames (HTFs) 🕰️
Using those POIs to define a clear trading range 📐
Refining those zones on Lower Time Frames (LTFs) 🔎
Waiting for a Break of Structure (BoS) for confirmation ✅
This method allows me to stay precise, disciplined, and aligned with the market narrative, rather than chasing price.
💡 My Motto:
"Capital management, discipline, and consistency in your trading edge."
A positive risk-to-reward ratio, paired with a high win rate, is the backbone of any solid trading plan 📈🔐
⚠️ Losses?
They’re part of the mathematical game of trading 🎲
They don’t define you — they’re necessary, they happen, and we move forward 📊➡️
🙏 I appreciate you taking the time to review my Daily Forecast.
Stay sharp, stay consistent, and protect your capital
— FRNGT 🚀
OANDA:EURUSD

EURUSD Short Term Breakout IdeaEURUSD has two key support levels in the immidiate area: 1.1540 and 1.15. It seems 1.1540 seems to be holding as EURUSD is now moving sideways. If the slope start to change upward, euro bulls might return to game.
It come to my attention than i bet on too big take profit levels recently and current market waves did not support that so this will have a smaller wave target.

EUR/USD Looking bullish strong support zone 1.15500📈 EUR/USD Analysis (1H Timeframe)
The pair is looking bullish from the key support zone around 1.1550 🟩
Momentum is building up, and buyers seem to be stepping in.
🎯 Resistance Levels to Watch:
1️⃣ 1.1580
2️⃣ 1.1620
3️⃣ 1.1630
If bullish momentum continues, a break above these zones could open the door for further upside moves 🚀
💬 What’s your outlook on EUR/USD?
👇 Like, Follow & Share for more market insights and updates! 💹

possibility of uptrend Given the price behavior in the specified support area, it is expected that a trend change will take place and we will witness the beginning of the upward trend.

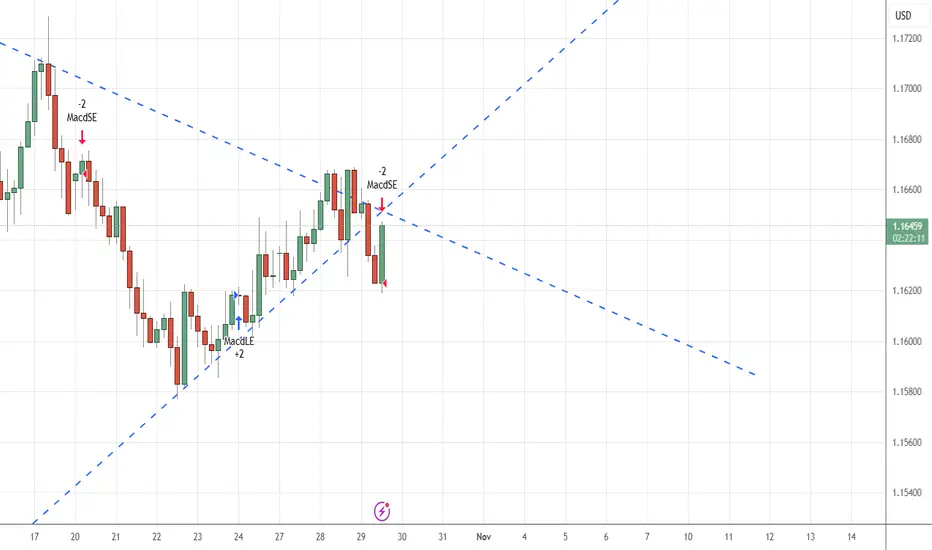
EURUSD 4H - Bearish Wedge Break Break confirmed below the ascendBased on the MACD signals and price action, the EURUSD has broken below the support trendline of the ascending wedge pattern on the 4-hour chart. This breakdown is a classic bearish reversal signal, indicating that the prior upward momentum has exhausted itself and sellers have taken control. The MACD is likely confirming this move with a bearish crossover and increasing negative momentum.
Critical FOMD Disclaimer & Strategy
⚠️ WARNING: FOMC Meeting Today
Today's primary market driver is the FOMC Meeting and Press Conference, not technical patterns. The high probability of an interest rate cut creates immense volatility and can easily invalidate any technical setup.
If the Fed is Dovish (Cuts rates, hints at more): The USD will likely sell off. This could cause a massive bullish spike, blowing through our stop loss and invalidating the wedge breakdown.
If the Fed is Hawkish (Holds, or signals fewer future cuts): The USD will rally, powerfully accelerating the bearish breakdown.
Therefore, the recommended strategy is to WAIT for the FOMC volatility to settle before entering. The technical levels below provide a framework for a potential trade after the news, or for those understanding the extreme risks.
EUR/USD – Triangle Breakout After Fed’s Cautious CutThe Fed cut rates by 25 bps, but Powell’s cautious tone killed the dovish mood — hinting this might be the last cut for a while. That shift powered the USD back up, leaving the euro on the defensive.
Technically, EUR/USD broke out below a contracting triangle that had been squeezing price for days. The breakout near 1.1615 shows that the range has resolved to the downside, confirming fresh bearish momentum. As long as the pair trades below 1.1650, I’m eyeing 1.1550–1.1530 as the next target zone.
For me, both sides align perfectly — fundamental disappointment + technical breakout = clean bearish setup.
