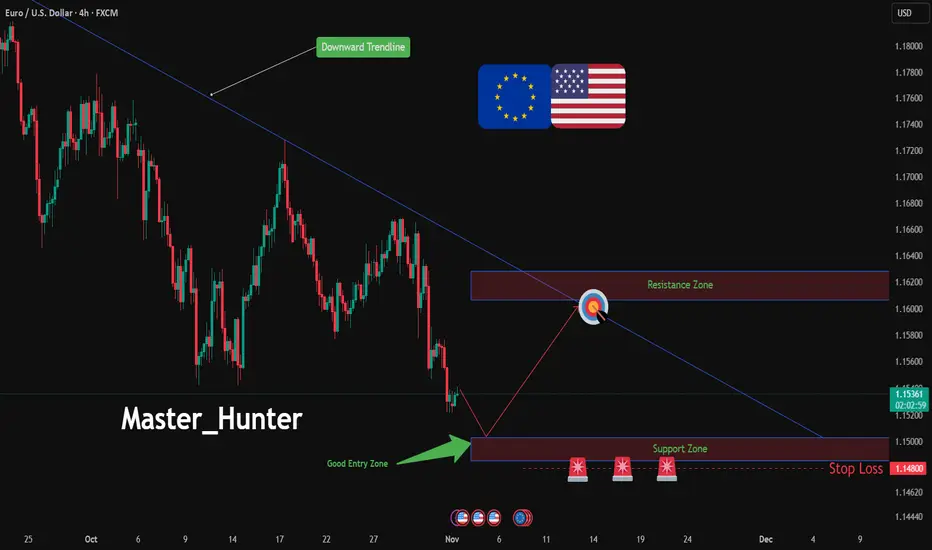
EUR/USD: Bullish Surge to 1.16?As the previous analysis worked exactly as predicted, FX:EURUSD is gearing up for a bullish breakout on the 4-hour chart , with price bouncing firmly off a key support zone and upward trendline, forming higher lows that signal strengthening buyer momentum and potential reversal from recent downtrend pressures. This confluence at the entry zone offers a high-conviction long setup.
Entry between 1.14850-1.15 for a buy position. Target at 1.16 near resistance, delivering a risk-reward ratio greater than 1:4 . Set a stop loss on a close below 1.148 to protect against downside breaks. 🌟 Look for confirmation with a strong bullish candle and rising volume above the entry, capitalizing on EUR resilience.
Fundamentally , this week brings significant news for both EUR and USD—key releases include Eurozone PMI data, US Nonfarm Payrolls, and ongoing FOMC rate decision fallout, all capable of driving sharp moves in the pair. 💡
📝 Trade Plan:
✅ Entry Zone: 1.14850 – 1.1500 (buy near support/trendline)
❌ Stop Loss: Close below 1.1480
🎯 Target: 1.1600 (major resistance zone)
💎 Risk-to-Reward: > 1:4, making this an attractive long opportunity for technical traders.
What's your play on this setup? Drop your thoughts below! 👇
Trade ideas
Weak U.S. PMI – EURUSD Ready to Bounce from the Bottom!Hello traders,
The market is entering an exciting phase! As the U.S. PMI numbers continue to signal “fatigue,” the USD is losing momentum, while EURUSD quietly prepares for a strong rebound from the lows. This isn’t just a technical setup — it’s the market’s pulse before a potential breakout.
The U.S. ISM Manufacturing PMI is projected at 49.4, still below the 50 threshold — a clear sign that the manufacturing sector remains in contraction. As the U.S. economy weakens, the USD loses strength , creating favorable conditions for EURUSD to recover in the short term.
On the 4H timeframe, EURUSD continues to move within a descending channel, but the price structure is showing encouraging signals. The 1.15000 zone is a solid support, aligning perfectly with the channel’s lower boundary.
If the price holds above 1.15000, there’s a strong chance EURUSD could rebound toward 1.16000, which coincides with the upper edge of the channel.
👉 Preferred Scenario:
Wait for a small retest around 1.15000, then buy following the recovery trend, targeting 1.16000.
The USD is weakening — and this might be the perfect moment for the bulls to regain control.

EURUSD Plunges: Hawkish Fed Crushes the Euro?Hey traders, let’s take a look at EURUSD — the market is revealing an exciting opportunity for the sellers!
After the September meeting, the Fed emphasized its “data-dependent” stance, signaling it’s not ready to ease policy while the U.S. economy remains solid. This reinforces expectations that the USD will stay strong , as the Fed could keep interest rates higher for longer. As the dollar gains momentum, EURUSD faces clear downward pressure.
On the H4 chart, the price is clinging to a descending trendline that has rejected three previous attempts to break higher — each touch has been sharply sold off. Currently, EURUSD trades around 1.1560, below the 1.1600 resistance, which acts as a potential bull trap . The likely scenario: a mild pullback toward 1.1600 before continuing lower to the 1.1520 support zone. A break below that level could open the door toward 1.1450.
In summary, the overall trend for EURUSD remains bearish . With the Fed maintaining its hawkish stance, every rebound is simply a chance for sellers to enter at better prices. Stay disciplined, follow the trend — the market rewards those who have patience!

EUR/USD: Short-Term Rebound Eyes 1.1610–1.1710 Before ResistanceEUR/USD is nearing the 1.1500 psychological support, with signs of a short-term bullish A-B-C recovery forming within the broader downtrend. Early buying pressure suggests a possible move toward the 1.1610–1.1710 resistance zone before sellers return.
Momentum favors a corrective rebound, but the pair remains confined to the descending channel structure.
⚠️ Risks:
– NFP and unemployment data could halt the recovery.
– PCE volatility may drive sharp moves.
– A break below 1.1500 would invalidate this bullish setup.

SELL EURUSDI am selling EURUSD right now. I do feel this will fall way lower so will continue to add positions depending on the movement over the next few days

EURUSD Daily Outlook — Bearish Retracement Toward Sell-Side Liqu
On the monthly timeframe, EURUSD still holds a bullish target, but before the next major upward leg, I believe the market needs a retracement phase.
Looking at the daily timeframe, the structure currently supports a bearish bias. Price has been respecting bearish PD Arrays while failing to sustain bullish PD Arrays, suggesting that bearish order flow remains dominant for now.
In my view, we can expect the market to move downward toward the sell-side liquidity before any potential bullish continuation begins.
💌It is my honor to share your comments with me💌
🔎 DYOR
💡Wait for the update!

Lingrid | EURUSD Key Support Zone Hold Brief Bull MoveThe price perfectly fulfilled my previous idea . FX:EURUSD is approaching the key psychological level near 1.1500, signaling a short-term bullish move may occur within the broader downtrend. Price action shows a potential A-B-C recovery structure forming above the support zone, supported by early buying pressure from lower levels. If momentum continues, the pair could retest the 1.1610–1.1710 resistance range before facing renewed selling interest. Overall, buyers might attempt a corrective rebound toward the upper boundary of the descending channel.
⚠️ Risks:
NFP data could cap the rebound and resume downside momentum.
Upcoming Unemployment Rate and PCE may increase volatility..
A breakdown below 1.1500 would invalidate the short-term bullish scenario.
If this idea resonates with you or you have your own opinion, traders, hit the comments. I’m excited to read your thoughts!

EURUSD positioning for bearish moveFOMC released with strong USD, causing EURUSD drop with breakout structure in H4 & H1 timeframe.
Asian market observed price slowly retrace as seller profit taking, fulfilled the imbalance caused by high impact news. The liquidity area below works as a magnet to the price. Therefore, i'm looking for sell opportunity only aligned with the trend (Lower low---Lower high---lower low---lower high).
I'm waiting for any reversal pattern in the lower time frame.
Please calculate your own risk & reward if you want to follow.
Happy trading & good luck

EUR/USD Outlook: Buyers Regain ControlThe EUR/USD market is beginning to show early signs of recovery momentum as sentiment gradually turns constructive. After an extended period of controlled weakness, the pair is attracting renewed interest from institutional participants positioning for a potential upward rotation in the coming sessions.
Market tone has shifted from defensive to cautiously optimistic. Liquidity distribution across recent sessions indicates accumulation behavior at lower price zones, often a precursor to a bullish transition. Traders appear to be building exposure in anticipation of improved Euro-area sentiment and potential easing of dollar strength, both of which may provide the foundation for a broader corrective advance.
Price action suggests that selling pressure is losing effectiveness as downside extensions are quickly absorbed. The slowdown in bearish momentum combined with increased buying participation signals a developing phase of re-accumulation, where stronger hands begin to dominate short-term flows.
Confidence is gradually improving, supported by expectations that market equilibrium is tilting back toward Euro favor. While volatility remains moderate, structural patterns imply that the market may be preparing for a sentiment-driven expansion to the upside. The tone of order flow has shifted toward buy-side liquidity, pointing to a constructive environment for continuation of the upward phase once momentum fully confirms.
In summary, EUR/USD appears to be entering the early stage of a bullish rotation characterized by accumulation, strengthening sentiment, and declining downside conviction. The pair is poised for potential medium-term appreciation as market positioning aligns with renewed optimism toward the Euro’s relative outlook.

EURUSD BUY SETUPI entered this deal
because we have strong zone
If this zone braked it would be signal for changing direction
and this indicate the strong of zone


EURUSD Technical Setup – Bullish Move Incoming?EURUSD ( FX:EURUSD ) is currently positioned near the lower line of a potential descending channel and is hovering around a Support zone($1.1542-$1.1514) . There's also a smaller descending channel that formed last week, which is something we should consider in our EURUSD analysis .
There's a Regular Divergence (RD+) between the two recent lows that EURUSD has made, which is a good sign of a possible reversal.
In terms of Elliott Wave theory , it appears that EURUSD has completed the main wave 5, with the main wave 3 being an Extended wave . A break of the upper line of the descending channel(small) could confirm the end of the main wave 5.
I expect that EURUSD could at least move up toward the next Resistance zone($1.1586-$1.1575) .
Second Target: $1.1597
Stop Loss(SL)= $1.14857
Please respect each other's ideas and express them politely if you agree or disagree.
Euro/U.S. Dollar Analyze (EURUSD), 1-hour time frame.
Be sure to follow the updated ideas.
Do not forget to put a Stop loss for your positions (For every position you want to open).
Please follow your strategy and updates; this is just my Idea, and I will gladly see your ideas in this post.
Please do not forget the ✅' like '✅ button 🙏😊 & Share it with your friends; thanks, and Trade safe.

EURUSD unchangedEURUSD continues to hover around yesterday’s levels, remaining within the range of 1,1528–1,1493.
In case of an upward move, the key resistance level is at 1,1580.
At the current levels, there’s no reason for aggressive entries!

EURUSD: Liquidity Above — Watch for a Risky Long Setup!EURUSD Analysis – Monday, November 4
Welcome traders! 👋
I’m glad to have you here — we’re all learning and growing together in this amazing trading journey.
Let’s dive into today’s analysis on EURUSD 👇
Despite the strong bearish momentum that continues to dominate EURUSD, we could see a short-term risky long opportunity for the upcoming trading day.
Price has recently performed a stop hunt on sell-side liquidity, sweeping below previous lows and confirming potential intent to grab the equal-high liquidity that aligns with Monday’s daily high.
If price retraces and provides a confirmation entry on lower timeframes, traders may look for a short-term long setup targeting that liquidity zone above.
However, this is a counter-trend setup, so managing risk and securing profits quickly is essential.
Stay cautious — as the broader structure remains bearish, this move could simply be a liquidity grab before further continuation to the downside.
📘 Educational Note:
This analysis is for educational and illustrative purposes only.
Always follow your own plan, confirm with your strategy, and manage risk carefully.
Success in trading comes from discipline, patience, and consistency. 💪
🚀 Empowering traders through clarity, confidence & clean charts.
Follow 👉 parisa_tl for more SMC setups and weekly insights 💙.
EURUSD #forexanalysis #smartmoneyconcepts #SMC #forexsetup #liquiditygrab #orderblock #fairvaluegap #POI #priceaction #forexeducation #forextrading #eurusdanalysis #forexcommunity #forexlife #marketstructure #daytrading #forexstrategy #riskmanagement #tradewithconfirmation #fxtrader #technicalanalysis #tradingview #forexinsights

EUR/USD Under PressureEUR/USD Under Pressure
Today, the EUR/USD pair is trading around 1.1560, close to autumn lows. From this week’s high, the pair has fallen by roughly 0.85%, reflecting bearish pressure.
The main factors driving the decline are traders’ reactions to central bank signals:
→ Hawkish Fed rhetoric: On Wednesday, Jerome Powell indicated that further rate cuts are “by no means predetermined.” The Fed continues to see mixed signals from the labour market and inflation data, suggesting it will not rush into easing policy.
→ ECB keeps rates unchanged: Yesterday, the European Central Bank left rates steady. However, markets remain concerned about the slowing economic growth across the eurozone, meaning the ECB cannot afford to tighten policy amid weak activity.
Technical Analysis of EUR/USD
Since mid-September, price movements have formed a descending channel (shown in red). Today, the pair fell below a key support level at 1.1580 (highlighted by arrows).
An earlier attempt to break this support in early October failed — as the pair entered oversold territory below the channel, it formed a double bottom (A–B) before sharply rebounding.
In this context, the 1.15435 level, where the double bottom formed, is significant. The orange-shaded area shows that bulls step in near this level, producing candles with long lower wicks. On shorter timeframes, this behaviour displays signs of a bullish engulfing pattern.
If bears succeed in breaking support, the pair could test the lower boundary of the red channel. Positive news from Donald Trump on progress in trade talks with China could improve the U.S. trade balance, supporting this bearish scenario.
Conversely, if bulls continue defending the 1.1560–1.15435 zone, EUR/USD may rebound, potentially moving towards the QH line.
This article represents the opinion of the Companies operating under the FXOpen brand only. It is not to be construed as an offer, solicitation, or recommendation with respect to products and services provided by the Companies operating under the FXOpen brand, nor is it to be considered financial advice.

EUR/USD 30-Min — Volume Buy & Sell Reversals Triggered Technical Reasons
/ Direction — LONG / Reversal 1.14200
Bullish momentum confirmed through strong candle body.
Structure shifted with higher-low near key demand base.
Volume expanding confirms order-flow alignment upward.
Buyers reclaimed imbalance with sustained clean break.
Algorithm detects rising momentum under low liquidity.
Technical Reasons
/ Direction — SHORT / Reversal 1.15100
Bearish rejection confirmed through sharp candle body.
Lower-high forming beneath resistance supply region.
Volume decreasing confirms exhaustion in price rally.
Sellers regained imbalance with heavy top rejection.
Algorithm detects fading demand and shift to control.
⚙️ Hanzo Alpha Trading Protocol
The Alpha Candle defines the day’s real control zone — the first battle of momentum.
From this origin, the Volume Window reveals where the next precision strike begins.
⚙️ Hanzo Volume Window / Map
Window tracked from 10:30 — mapping true market behavior.
POC alignment exposes institutional bias and breakout potential zones.

Hellena | EUR/USD (4H): SHORT to the support area 1.15419.The situation is quite interesting. I would not like to recommend selling, but judging by the waves, the price should update the minimum of 1.15419 and complete the wave "C" of higher order near the level of 1.15000.
Then the triangle (ABCDE) will continue to develop. And as much as I don't want to, I will insist that the price will continue the downward movement at least to the support area of 1.15419.
Fundamental context
The dollar continues to be under pressure - markets are increasingly laying expectations of a soon Fed rate cut due to signs of a slowdown in the US economy. At the same time, the euro is receiving moderate support due to stability in the eurozone and investors' interest in alternative assets outside the dollar.
In fact, this may lead to some sideways movement, which will be expressed in the triangle (ABCDE).
Manage your capital correctly and competently! Only enter trades based on reliable patterns!

EUR/USD – Triangle Breakout (CPI Data ahead)EUR/USD – Buy Entry (M30- Channel Breakout Pattern)
The EUR/USD Pair, Price has been trading within a Triangle Breakout Pattern on the M30 chart, forming consistent higher highs and higher lows. Price action is now testing the upper boundary of the Pattern, signalling a possible breakout.
✅Market Context:
1️⃣Strong Upward Structure Inside the Pattern.
2️⃣Buyers are showing strength near Resistance.
3️⃣Breakout above the Trendline indicates Momentum continuation toward higher zones.
✅Trade Plan:
Entry: Buy after Confirmed Breakout above the Resistance (m30 candle close above trendline or retest of the breakout).
💰Take Profit (TP): At the Key Zone – a Major Resistance area identified ahead.
🛑Stop Loss (SL): Below the Pattern Structure.
✅Psychological Discipline :
1️⃣Stick to plan – No Revenge Trades.
2️⃣Accept losing trades as Part of the Strategy.
3️⃣Risk only 1–2% of your account balance per trade.
💬 Support the community: If you found this useful, drop a 👍 like and share your thoughts in the comments!
⚠️ Disclaimer: This analysis is for educational purposes only and does not constitute financial advice. Forex trading involves high risk. Trade only with capital you can afford to lose and always do your own research.

Hellena | EUR/USD (4H): LONG to the resistanse area 1.16296.Colleagues, the rather complicated correction suggests that the upward movement is gradually slowing down and I think that we will see a rather confident move towards the 1.16296 area.
The difficulty is that on higher timeframes we are dealing with a ending diagonal, and these are quite complicated figures to analyze.
Nevertheless, I think that there is a probability of reaching the support area of 1.14647 before the upward movement.
Fundamental context
The U.S. dollar is under pressure: weak economic data and expectations of monetary easing are reducing its appeal as a safe-haven asset. The euro is receiving moderate support amid relative stability in the eurozone economy and investor interest in non-dollar assets. These conditions set the stage for a resumption of the EUR/USD pair’s upward move.
Manage your capital correctly and competently! Only enter trades based on reliable patterns!

EURUSD - BEARISH SCENARIOHello traders,
The EURUSD price has reached the resistance zone (1.15363 – 1.15436) and formed a double top pattern — a potential bearish reversal signal.
🔻 Bearish Scenario:
If the market breaks the neckline and closes below it, we can expect a downside movement.
🎯 TARGET: 1.14815

EURUSD rebounds strongly – ready to break higherAfter several days of sideways trading, EURUSD is regaining its momentum , driven by two golden catalysts: a weaker USD following softer U.S. CPI data, and a stronger-than-expected recovery in Germany’s economy. This combination has triggered a broad “risk-on” wave across global markets, pulling the euro back into an upward trajectory.
On the H1 chart, the pair has clearly bounced off the ascending trendline, forming a double bottom pattern — a classic signal of reversal. The EMA 34 and EMA 89 lines are beginning to converge, hinting at stronger bullish momentum ahead. Support around 1.1615 remains firm, while the next target sits near 1.1650, where a potential breakout could unfold.
With the Fed likely to cut rates soon and the ECB pausing further easing , capital flows are gradually shifting back into the euro. With both fundamentals and technicals aligning, EURUSD appears poised for further upside , potentially heading toward 1.1680–1.1700 in the short term.

EURUSD: Dollar strength persistsAs expected, the Fed cut interest rates by another 25 basis points at the FOMC meeting held on Wednesday. The interest rates are currently in a range of 3,75% to 4,0%. Although there are market expectations that another rate cut could occur in December, Fed Chair Powell commented that a reduction is “not a foregone conclusion”. On the risk side, Chair Powell emphasized that inflation could remain at higher levels, while at the same time the labor market is showing signs of softening. The US Government continues to be in the state of a “shutdown” in which sense, there is still a lack of important macro data for the US economy.
The ECB also had a meeting last week, without a change in the level of interest rates. The ECB president Lagarde called the level of interest rates a “good place”. Regarding risks to the economy, Lagarde mentioned supply chain disruptions or bottlenecks that could arise from the latest tensions between the EU and China over microchips and rare earth minerals. She also mentioned risks of inflation coming from the services sector. As for other posted macro data, the Ifo Business Climate in October in Germany reached 88,4, which was in line with market expectations. The GfK Consumer Confidence in November in Germany was -24,1, a bit higher from previous months -22,5. The Unemployment rate in Germany in October remained flat at 6,3%, while the same indicator for the Euro Zone was also at 6,3%. The GDP Growth rate in Germany flash for Q3 was estimated at 0% for the quarter and 0,3% on a yearly basis. Figures were in line with the market consensus. The GDP Growth rate in the Euro Zone, flash for Q3, was estimated at 0,2% for the quarter and 1,3% y/y. Both figures were better from market estimates of 0,1% q/q and 1,1% y/y. The preliminary inflation rate in Germany in October is 0,3% m/m and 2,3% y/y. The Inflation rate in the Euro Zone in October was 0,2% for the month leading to 2,1% y/y, while core inflation stood at 2,4% y/y.
Markets favored the US Dollar over the Euro during the previous week, despite a relatively shorter range in which the currency pair was traded. The pair reached the highest weekly level at 1,1665 while the lowest one was reached on Friday at 1,1522. The RSI closed the week at the level of 37, but the clear oversold market side has not been reached during the week. The MA 50 slowly converges toward the MA200, however, there is still a higher distance between two lines, postponing the potential cross.
Charts are showing that the eurusd currency pair found some short term supporting level at 1,1520. However, on a longer scale this level does not represent a significant line for the currency pair, so further moves could be expected in the coming period. There is some probability of a short term correction toward the upside. In this sense, the 1,16 resistance level could be tested for one more time. On the opposite side, a break from the current 1,1520 level would lead the currency pair toward the 1,1450 with some probability for a short test of the 1,14 support level within the next few weeks. The currency pair last tested this level in July this year.
Important news to watch during the week ahead are:
EUR: Factory Orders in Germany in September, Industrial Production in Germany in September, Retail Sales in September in the Euro Zone, Balance of Trade in September for Germany,
USD: ISM Manufacturing PMI in October, ISM services PMI in October, University of Michigan Consumer Sentiment preliminary for November.

EURUSD Weekly Forecast
My outlook for next week is still bearish, until we hit the area that started the whole upward move.
October ended with a swing high forming and a bearish candle close, which means we might see a fourth continuation candle.
Since the weekly candle broke through the EQL, we're probably going to get a pullback to the bearish 4-hour FVG early next week, then the drop should continue toward the EQL.
The main thing that could slow this down is a big bearish daily FVG; that will be some strong resistance. We really need to watch the price action there.
