EURUSD Channel Down topped. Sell Signal.The EURUSD pair has been trading within a 1-month Channel Down since the September 16 High and last Friday it got rejected on its top and just above the 4H MA200 (orange trend-line). As long as it doesn't break higher, this is technically the pricing of the new Lower High.
Lower Highs tend to initiate Bearish Legs within such patterns. The two already formed before have declined by around -2.00%. As a result, our Target is 1.15000, which again will be valid as long as no new High is made.
-------------------------------------------------------------------------------
** Please LIKE 👍, FOLLOW ✅, SHARE 🙌 and COMMENT ✍ if you enjoy this idea! Also share your ideas and charts in the comments section below! This is best way to keep it relevant, support us, keep the content here free and allow the idea to reach as many people as possible. **
-------------------------------------------------------------------------------
💸💸💸💸💸💸
👇 👇 👇 👇 👇 👇
Trade ideas

Analyzing Market Structure, Order Blocks, and Liquidity: A EUR/UBased on the technical analysis and annotations provided on the EURUSD 1-hour chart, here are the possible entry areas for long and short positions.
This analysis is based on "Smart Money Concepts" (SMC) principles like Break of Structure (BOS), Order Blocks (OB), and Liquidity Sweeps (LS) indicated on your chart.
Potential Long (Buy) Entry
The chart identifies a clear area of interest for a long position, based on a recent bullish shift in market structure.
Reasoning: The price created a "Swing Low" and then rallied, causing a bullish "Break of Structure" (BOS). In this trading style, traders look to buy when the price pulls back into the demand zone or "Order Block" (OB) that initiated this break.
Area of Interest: The chart has explicitly marked a large green box labeled "H4 OB" (a 4-Hour Order Block), which sits directly on top of the "Swing Low." This is the primary demand zone.
Possible Entry Price: The potential long entry zone is the entire area defined by this green box, which is approximately between $1.1536 (the "Swing Low") and $1.1590 (the top of the H4 OB).
Potential Short (Sell) Entry
A short position would be based on the idea that the overall bearish trend (as seen from the "Swing High" and multiple downside "BOS") is still in effect, and the recent rally was just a pullback.
Reasoning: The most recent rally (starting from the "Swing Low") stopped and reversed after running into a key supply level. This level is marked with "LS" (Liquidity Sweep), indicating that price swept the liquidity resting above a previous high before turning lower.
Area of Interest: The most logical supply zone for a short entry is this recent high, where the liquidity sweep occurred.
Possible Entry Price: A potential short entry would be on a retest of this supply zone, which is approximately at $1.1715 - $1.1720.

Nothing to do on EUR/USD but Wait - A BIG Move is Coming! 10/20In today´s video I explain how this chops comes really as no surprise as we remain within the moving averages until the markets decides what to do.
In the mean time, unless you´re a pro scalper, I recommend taking the day to prepare for this upcoming breakout. For this you´ll need to know what to look for, this video also explains briefly how this will come to pass, both in case of a bullish or a bearish scenario
As always if you have any questions don´t hesitate to ask


EURUSD: Bulls Are Winning! Long!
My dear friends,
Today we will analyse EURUSD together☺️
The market is at an inflection zone and price has now reached an area around 1.16566 where previous reversals or breakouts have occurred.And a price reaction that we are seeing on multiple timeframes here could signal the next move up so we can enter on confirmation, and target the next key level of 1.16659.Stop-loss is recommended beyond the inflection zone.
❤️Sending you lots of Love and Hugs❤️

EURUSD 1HR OUTLOOKThe market having formed head and shoulder we wait for a retest at the neckline
If the market rejects the resistance at the neckline we wait for a retest and enter long
If the market breaks the resistance ,we wait for a retest at the support of the neckline and enter short
Om both cases target a 1:3 RR

EURUSD Massive Long! BUY!
My dear friends,
Please, find my technical outlook for EURUSD below:
The instrument tests an important psychological level 1.1649
Bias - Bullish
Technical Indicators: Supper Trend gives a precise Bullish signal, while Pivot Point HL predicts price changes and potential reversals in the market.
Target - 1.1677
Recommended Stop Loss - 1.1633
About Used Indicators:
Super-trend indicator is more useful in trending markets where there are clear uptrends and downtrends in price.
Disclosure: I am part of Trade Nation's Influencer program and receive a monthly fee for using their TradingView charts in my analysis.
———————————
WISH YOU ALL LUCK

EUR/USD (15-Minute Timeframe) - LONGTrading Idea: EUR/USD (15-Minute Timeframe)
This setup focuses on a Liquidity Sweep and Last Breakdown Low (LBL) concept.
Market Context:
The market has been in a downward structure, forming lower highs and lower lows. After a strong bearish leg, price consolidated near the previous structural low area, indicating potential liquidity buildup below that level.
Key Levels & Concepts:
LBL (Last Breakdown Low):
The LBL marks the point where price previously broke structure to the downside, creating a key area of interest for potential liquidity grabs.
As shown, price swept liquidity below this level, grabbing stop-losses of early buyers before reacting sharply upward.
Liquidity Sweep (xxx Liquidity Sweep xxx):
Price made a false move below the LBL to collect liquidity, then reversed, signaling potential short-term bullish intent or relief rally.
Equal Highs (Label “1”):
The prior equal highs around 1.1675 acted as liquidity resting above, serving as a clear target for the market before the next bearish continuation.
Trading Idea:
Scenario 1 (Bullish Reversal):
If price holds above the LBL after the liquidity sweep and confirms a higher low on the lower timeframe, it may push back toward the equal highs at 1.1675 for a short-term retracement play.
Scenario 2 (Bearish Continuation):
If price fails to sustain above LBL and reclaims the liquidity zone (gray area), it signals continuation to the downside, targeting lower liquidity zones around 1.1635–1.1640.
Bias:
Short-term bearish, until a confirmed break and retest above 1.1675.

EURUSD – Structure Analysis (4H Chart)EURUSD – Structure Analysis (4H Chart)
On the EURUSD chart you can find a well-defined structure analysis with key support and resistance areas highlighted.
At the moment, the pair is trading near 1.1650, positioned between a support zone at 1.1630 and a resistance zone around 1.1720.
If price holds above 1.1630, we could see a short-term bullish move toward 1.1720, followed by 1.1770–1.1785, and possibly 1.1870, which is the upper resistance zone.
However, if EURUSD fails to stay above 1.1630, a deeper correction may take place. The next support levels are found at 1.1547 and 1.1400.
Overall, the structure shows that EURUSD is currently at a decision point — holding above support favors a bullish continuation, while a break below could open the door for further downside movement.
You may find more details in the chart!
Thank you and Good Luck!
❤️PS: Please support with a like or comment if you find this analysis useful for your trading day❤️

SELL EURUSD - Amazing low risk high reward trade!Based on our deep analysis we can see that EUR/USD will head to the downside. Great time to sell - it has broken major support levels + trends. It is also struggling to break past powerful resistance levels & fibonacci levels.

EUR/USD - Long BIAS Analysis EUR/USD Long Bias Analysis 💶📈
The price has recently swept significant liquidity levels, including the Previous Day’s Low (PDL), the prior Asian session low, and the London session low.
We also have previous Asia Low and London Low forming EQ Lows right above our POI.
This liquidity grab aligns with a key point of interest (POI), identified as an unfilled Fair Value Gap (FVG) on the daily timeframe.
From this POI, we anticipate a bullish reaction, with price likely to rebound towards out draw on liquidity (DOL), targeting the London session high and an unfilled Sell-side Imbalance Buy-side Inefficiency (SIBI) on the H4 timeframe.

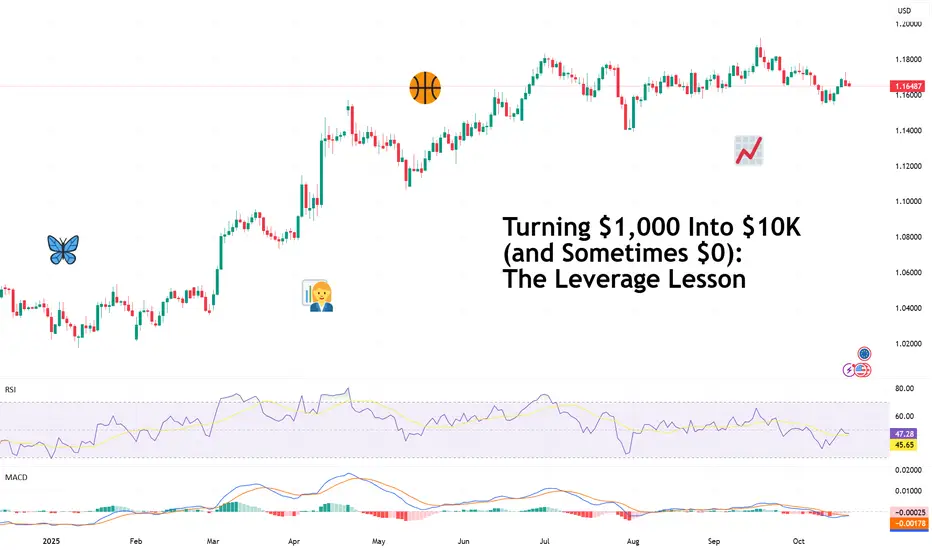
Turning $1,000 Into $10K (and Sometimes $0): The Leverage LessonEvery trader remembers their first brush with leverage — that magical moment when a modest account suddenly feels like a hedge fund.
You deposit $1,000, pop open TradingView, find your broker of choice , and boom — your buying power jumps to $30,000. You feel unstoppable as you imagine all the profits waiting for you out there.
And for a few moments, it works. A 1% move in your favor turns into a 30% gain. You start browsing for a new watch and a place in downtown Lisbon. But as every bruised and battered trader learns, leverage giveth and leverage obliterateth . That same 1% move against you? Game over.
Leverage is the financial equivalent of a sports car: thrilling, powerful, and incredibly dangerous in the wrong hands. Which, let’s be honest, most of us have been at some point.
If you take away anything from this piece, let it be this: if you wipe out 50% of your account, say, go from $1,000 to $500, it will take a 100% gain for you to get back even.
🧨 The Math That Makes (and Breaks) You
What exactly is leverage and what does it do? Leverage simply means you’re borrowing money to amplify your position size. A 1:10 ratio gives you control over $10,000 with just $1,000 of your own capital. The catch? You’re still responsible for all of it — the profits and the losses.
Here’s a general example:
• $1,000 with 1:10 leverage = $10,000 position.
• The market moves +1% = $100 profit. Nice.
• The market moves -1% = $100 loss. Manageable.
• The market moves -10%? That’s your entire $1,000 gone. Margin call city.
The higher your leverage, the narrower your margin for error. One bad candle, one unexpected news release , one mistimed coffee break when you’ve just loaded up ( during earnings , for example) and your performance can become a case study in volatility.
🧠 The Psychology of “More”
Here’s where it gets interesting: most traders don’t blow up their accounts because they misunderstand leverage — they blow up because they only think about the upside, how much they can make.
Leverage feeds every dangerous trading instinct: impatience, overconfidence, revenge trading, FOMO. “Next time we go bigger. Double down. We can make it back.” It makes rational risk management feel boring — and boredom, especially for a new trader, is unbearable.
Successful traders learn to see leverage for what it is: a tool, not a ticket. They understand that doubling down rarely doubles results, and that a steady pace — not speed — is the name of the game.
💡 The Smart Way to Use Leverage
So how do you wield this double-edged sword without losing a hand?
• Start small . New traders shouldn’t touch anything above 1:10 until they’ve mastered consistency.
Even pros rarely use their full leverage. And in the rare instances where they do, it usually ends up with a blowup. If you’d like to read up on the topic, Archegos Capital and LTCM are a good place to start.
• Use stop-losses religiously . A good stop-loss isn’t weakness; it’s insurance.
• Don’t equate margin with opportunity . Just because you can open a $50,000 position doesn’t mean you should.
• Think in percentages, not dollars . Most experienced traders aim to risk no more than 1–3% of their total equity per trade.
• Treat leverage like caffeine . A little sharpens focus. Too much and your hands start shaking and you lose sleep.
Leverage done right is a powerful tool that can help you get to your goals faster, smarter, and with fewer trades. But it can turn against you if you let it.
🪞 The Moral of the Margin Story
Leverage doesn’t make you a better trader. It makes your habits louder. If you trade emotionally, it amplifies your mistakes. If you trade methodically, it amplifies your discipline.
So yes, leverage can turn $1,000 into $10K — or into an expensive lesson in risk management. The deciding factor isn’t the multiplier on your screen; it’s the mindset behind your mouse.
In the end, trading is less about flexing your buying power and more about staying long enough to use it wisely.
Stay sharp, stay humble.
Off to you : What leverage do you usually use? Do you prefer to go 1:30 into forex or 1:10 into equities? Share your approach in the comments!
EUR/USD - Outlook (LTF ranging market)🔥 EUR/USD Outlook Breakdown 🔥
Let’s decode this clean structure — multi-time-frame style with a punch of trader slang 👇
🧭 Weekly Timeframe
We’re chilling just under a long-term bearish resistance trend, and the last few weeks show clear compression beneath that line.
The weekly breakout candle couldn’t sustain upside, hinting sellers are still lurking.
Price holds under 1.1800, keeping HTF (higher-time-frame) structure bearish.
➡️ Eyes on the 1.1500–1.1450 zone as next liquidity grab if momentum kicks in.
📆 Daily Timeframe
Daily shows a ranging market between 1.1750 resistance and 1.1550 support.
We saw a BOS earlier in the structure, but bulls couldn’t follow through.
Multiple rejections from the supply block confirm short-term hesitation.
The support trendline is hanging on — but if it snaps, expect the cascade to begin.
Targets line up clean:
🎯 Target 1: 1.1400
🎯 Target 2: 1.1150
🎯 Target 3: 1.1000
⏰ 8H Timeframe
On the 8H, we’re playing ping-pong inside that same range.
Price grabbed the BSL (Buy-side Liquidity) up top and retraced to the mid-range demand.
Both BH zones are acting as intraday traps — classic indecision setup.
Until we break out clean, expect chop.
➡️ However… here’s the key line:
“HTF supports bearish price action although STF is currently ranging giving unclear direction. HTF will take control.”
That means we’re likely setting up for a fake bullish pop before a strong bearish drive, once HTF order flow dominates.
🎯 Trade Idea
Bias : Bearish (waiting for HTF dominance)
Setup : Sell the fake-out above range highs or on break & retest of 1.1550 support
Targets : 1.1400 → 1.1150 → 1.1000
Invalidation : Daily close above 1.1750
Gameplan : Stay patient — HTF flow will win.
⚡ Summary
EUR/USD is stuck in a rangey mess, but the bigger picture screams bearish.
When HTF takes back control, expect a breakdown toward 1.1400+ zones.
Shorts will be the move once that range floor cracks.

EURUSD possible bullish for 1.1730eurusd formed Eve bottom on 4h time frame chart. 1.1561-43 4hour supply zone. price may dip down few pips for stop loss hunt. may put more risk on 1.1530. sl 1.1520. target: 1.1730

EURUSD Bulls and BearsFor a moment I have softened my consecutive bullish position stance following an observation of recent performance of the pair. Today I maintain that the momentum is fading away unless there is an introduction of a new catalyst as the CPI. Trump already softened the 100% tariff on China which has resulted to a slow down in bullish momentum as opposed to last week. Where the pair is we are likely to experience a short term sell in form of an aim to reverse. But also close to 1.15800 to 1.1500 zone we are likely to experience some buyers with an aim to maintain the bullish trajectory and retest on the reversal.
What I can do for this week given that the month is also coming to an end is focus on buying or selling those key points indicated on my chat towards CPI.

Uptrend in EURUSDThe trend of this currency pair is completely bullish according to the previous analysis, we can expect the price to correct and then move upwards. Personally, I would wait for the price to correct first and then enter the trade.

A retest of a key level on EURUSDA key level is being retested on the EURUSD pair. Moreso, there are liquidities just above the order block. I will wait to see how the order block will react before going in. Happy trading!

A retest of a key level on EURUSDA retest of a key level is about to happen on EURUSD. Moreso, there are liquidities just above the order block. I will wait to see what reactions we would have at that level. If it looks good through and through, it will be a good trade.

EURUSD - Signal#EURUSD - Signal
H4 - Formation of the 3rd wave + trendline retest. Stop loss beyond the 1st wave. If a fractal forms, the stop loss can be moved beyond the 2nd wave.
Entry: 1.16488
TP: 1.15861 - 1.15052 - 1.14269 - 1.13561
Stop: 1.17297 - *1.16779

EUR/USD: Strong Buyer Zone at 1.1561 – Key Long-Term SupportOn EUR/USD, a significant volume cluster formed at 1.1561 before a strong bullish move began. This zone marks where institutional buyers accumulated long positions and drove the price higher. If the market pulls back to this level, it’s likely to act as strong support, as those buyers will likely defend their positions again. I’m watching this area for a potential long opportunity.

EURUSD Overview🔹 Chart Overview
Pair: EUR/USD
Timeframe: 1H
Current Price: ~1.1662
Structure: The pair is consolidating after a recent uptrend, sitting near a support-demand zone (gray area).
🔹 Key Levels
Resistance Zone: 1.1690 – 1.1728 (highlighted in light gray and orange)
Support Zone: 1.1635 – 1.1650 (gray area below current price)
Major Support: 1.1542 (orange line at the bottom)
🔹 Scenario Paths
🟧 Path 1 (Orange – Bullish Scenario)
Price holds above the 1.1635–1.1650 support zone.
It breaks above the minor resistance (~1.1690).
Momentum continues higher toward 1.1728, completing a short-term bullish correction.
After reaching this level, a potential pullback back to the 1.1660 zone is expected.
📈 Interpretation:
If bullish momentum strengthens (possibly from strong EU data or USD weakness), the pair could aim for 1.1728 before retracing. Traders might look for long opportunities near 1.1650 with targets at 1.1720–1.1730.
🟩 Path 2 (Green – Bearish Bounce and Drop)
Price dips into the 1.1635–1.1650 demand zone.
A small bullish bounce occurs, but the rally fails to break 1.1690.
Price then reverses and drops below 1.1630.
📉 Interpretation:
This suggests a bull trap scenario—temporary strength followed by continuation of the downtrend. A break below 1.1630 could target 1.1600 and then 1.1560.
🔵 Path 3 (Blue – Extended Bearish Continuation)
Price briefly tests support (~1.1640) and fails to hold.
Strong downward momentum takes the pair below 1.1600.
The next significant target becomes 1.1542 (major support).
📉 Interpretation:
This path shows a continuation of the broader downtrend. A clean break and close below 1.1630 would confirm bearish control. Sellers may target 1.1560–1.1540 range.
🔹 Overall Market Bias
The pair is at a key decision zone.
As long as 1.1635 holds, short-term bullish recovery (orange path) remains possible.
However, a break below 1.1630 could confirm bearish continuation toward 1.1540 (green/blue paths).

EUR/USD Technical Outlook – Potential Reversal After Cup FormatiAfter forming a rounded bottom (cup pattern) and testing the resistance zone around 1.1710–1.1720, EUR/USD faced strong rejection and started to retrace lower. The rejection confirms that sellers are defending this zone aggressively, while buyers are losing momentum after a steady recovery.
Currently, price is consolidating below the neckline, showing early signs of a bearish continuation. If sellers manage to push below 1.1640, we could see a move toward the next support levels at 1.1600 and 1.1570, aligning with the 0.5–0.618 Fibonacci retracement of the previous bullish leg.
Key technical levels:
Resistance: 1.1710 – 1.1720
Immediate support: 1.1640
Major support: 1.1600 – 1.1570
Trading idea:
Short-term traders may look for a pullback toward 1.1675–1.1690 for potential sell setups, targeting 1.1600 while keeping stops above 1.1725 for a favorable risk-to-reward ratio.
If the bearish momentum weakens and price reclaims 1.1720, it may invalidate the bearish scenario and open the path for a retest of 1.1760.
This structure highlights how market behavior often shifts after a completed cup formation — the breakout failure at the neckline tends to trigger short-term corrections.
Stay disciplined and follow for more daily strategy updates on EUR/USD and major pairs.
