EURUSD: Support & Resistance Analysis for Next Week 🇪🇺🇺🇸
Here is my latest structure analysis
and important supports and resistances for EURUSD
for next week.
Consider these structures for pullback/breakout trading.
❤️Please, support my work with like, thank you!❤️
I am part of Trade Nation's Influencer program and receive a monthly fee for using their TradingView charts in my analysis.
Trade ideas

Santa Rally or Santa Crash? What History SaysSanta Rally or Santa Crash? What History Says About December Volatility?
Every year, traders wait for the “Santa Rally” — the seasonal jump in stocks during the last week of December and the first two trading days of January. But history shows that December isn’t always a calm or bullish month. While the S&P 500 has posted a Santa Rally in about 70% of the past 25 years, several Decembers have still ended in the red, including notable declines in 2002, 2018, and 2022.
Seasonality matters, but macro conditions often dominate. A firm Federal Reserve stance, year-end tax-loss selling, and thin holiday liquidity can all turn December into a more volatile period.
So what could this December bring — a Santa Rally or a Santa Crash? The market may offer gifts, but history reminds us that risk management is the one thing traders can rely on.
Disclaimer: This video represents the opinion of the Companies operating under the FXOpen brand only. It is not to be construed as an offer, solicitation, or recommendation with respect to products and services provided by the Companies operating under the FXOpen brand, nor is it to be considered financial advice.

EURUSD H4 | Bearish ReversalMomentum: Bearish
The price is reacting to the sell entry, which has been identified as pullback resistance.
Sell entry: 1.1599
Pullback resistance
Stop oss: 1.1648
Swing high resistance
Take profit: 1.1534
Overlap support
61.8% Fibonacc retracement
High Risk Investment Warning
Stratos Markets Limited (tradu.com ), Stratos Europe Ltd (tradu.com ):
CFDs are complex instruments and come with a high risk of losing money rapidly due to leverage. 70% of retail investor accounts lose money when trading CFDs with this provider. You should consider whether you understand how CFDs work and whether you can afford to take the high risk of losing your money.
Stratos Global LLC (tradu.com ): Losses can exceed deposits.
Please be advised that the information presented on TradingView is provided to Tradu (‘Company’, ‘we’) by a third-party provider (‘TFA Global Pte Ltd’). Please be reminded that you are solely responsible for the trading decisions on your account. Any information and/or content is intended entirely for research, educational and informational purposes only and does not constitute investment or consultation advice or investment strategy. The information is not tailored to the investment needs of any specific person and therefore does not involve a consideration of any of the investment objectives, financial situation or needs of any viewer that may receive it. Past performance is not a reliable indicator of future results. Actual results may differ materially from those anticipated in forward-looking or past performance statements. We assume no liability as to the accuracy or completeness of any of the information and/or content provided herein and the Company cannot be held responsible for any omission, mistake nor for any loss or damage including without limitation to any loss of profit which may arise from reliance on any information supplied by TFA Global Pte Ltd.

EURUSD SHORT Market structure bearish on HTFs 3
Entry at both Weekly and Daily AOi
Weekly Rejection at AOi
Daily Rejection At AOi
Daily EMA retest
Previous Structure point Daily
Around Psychological Level 1.16000
H4 Candlestick rejection
TP: WHO KNOWS!
Entry 100%
REMEMBER : Trading is a Game Of Probability
: Manage Your Risk
: Be Patient
: Every Moment Is Unique
: Rinse, Wash, Repeat!
: Christ is King.

Hourly EU Analysis EU is currently bullish on the hourly chart. Price is retracing down near an hourly demand zone. As you can see I marked out the swing high and swing low, price does not need to immediately reject the demand zone, its just a good POI to watch but price is still bullish until the swing low I marked out breaks. I would honestly expect price to sweep below the demand zone, grab some extra liquidity and then move back up towards the swing high. Always enter based off lower time frame confirmation.
Trade Safe -Remzy

Another upside move in EURUSD EURUSD is heading toward a fresh test of the 1,1652 level.
In recent days, price has bounced off this zone several times, offering solid opportunities for additional entries.
A break above 1,1652 would confirm the bullish momentum and open the door for new long positions.
Trump stated that he will announce the new FED Chair at the start of the year, but it’s entirely possible he surprises the market earlier.
Keep a close eye on the news and manage your risk!

EURUSD - why am I bearish on the priceWell, thank you for commenting on my ideas on EURUSD. This is what makes the TradingView community unique.
In one of the comments I learned that I am agains the mainstream believing that EURUSD is not going to continue growing (will not hit the next max after 1.19191 on Sep 15th). In this post I would like to provide arguments for which I am bearish in EURUSD, yet keeping in mind that those are just my humble opinions and as such they can be completely wrong.
So, let's do that:
Argument #0 - EURUSD in W1 in in Downtrend since June 2008
Argument #1 - Overbalance - total size of the corrections (marked light blue) are almost equal. Yet the recent correction perfectly is aligned with Garttley pattern (Argument 4).
Argument #2 - The BC parts of the above mentioned corrections are equal too (marked navy blue)
Argument #3 - the recent correction has performed a perfect ABC pattern
Argument #4 - The above mentioned Gartley pattern (I wrote a post on that) has been completed
Argument #5 - last but not least - the price returned exactly on Fibonacci Retracement 161.8 of the most recent correction to the up-movement starting on Sep 30th 2024.
Those argument create a massive Resistance Cluster at 1.17500 - 1.19600.
Altogether I have six argument to believe the local uptrend on EURUSD simply expired. But of course I may be absolutely wrong and EUR will go up from where it is now.
Just my humble opinion

EURUSD Pullback Before Bullish ExpansionQuick Summary
EURUSD is still showing strong bullish momentum, but a short term correction toward 1.15903 is likely before price continues higher to break the previous high. The presence of liquidity and an order block at the retracement zone increases the probability of a sweep before a new bullish push begins.
Full Analysis
The EURUSD continues to maintain its upward structure, and the current price action suggests that a temporary pullback may occur before the next bullish expansion. The level around 1.15903 stands out as a logical correction point
This retracement zone is significant because it contains both resting liquidity and a strong order block. These factors often attract price, as the market tends to sweep liquidity before continuing its primary direction. A sweep in this zone would remove weak hands, fill inefficiencies, and position the pair for a stronger continuation move.
Once liquidity below 1.15903 is taken, the expectation is for EURUSD to resume its bullish trajectory and aim for a break above the previous high. Waiting for a reaction or confirmation at the level can provide a higher quality entry, but the overall bias remains bullish as long as the structure stays intact.

DeGRAM | EURUSD will rise to $1.165 level📊 Technical Analysis
● EUR/USD defended the long-term ascending support line near 1.1490 and is rebounding toward the descending resistance trendline, signalling a shift from compression to early bullish momentum.
● A breakout above 1.1600–1.1650 would confirm a larger trend reversal toward 1.1777, supported by higher lows forming at the structure base.
💡 Fundamental Analysis
● Weakening U.S. data and improving euro-area sentiment continue to favor a medium-term recovery in the pair.
✨ Summary
● Bullish bias above 1.1490. Targets: 1.1650 → 1.1777. Support: 1.1490.
-------------------
Share your opinion in the comments and support the idea with a like. Thanks for your support!

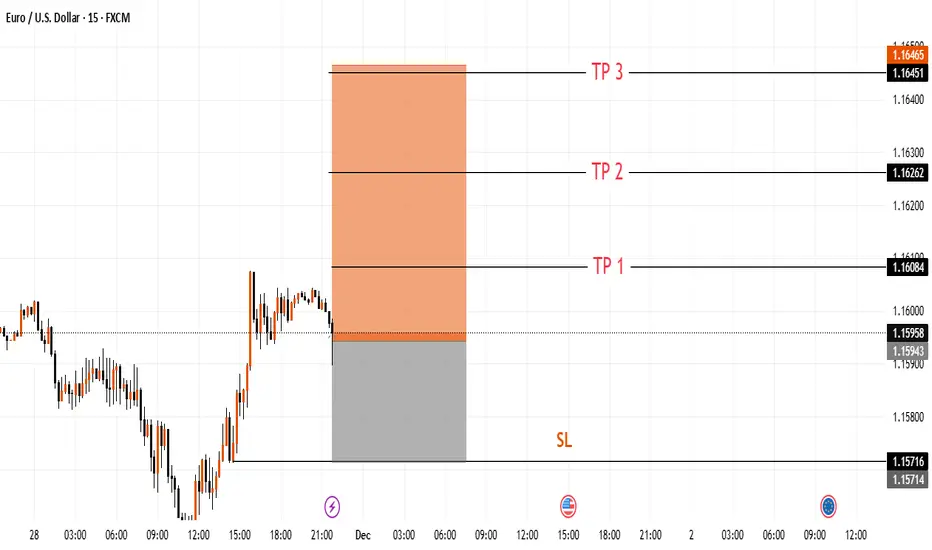
EURUSD Intraday Structure With Marked LevelsThe chart highlights a zone where price recently reacted, with three reference levels drawn above the current area and one lower boundary marked below. This layout helps visualize how price is moving inside the short-term structure and how it has interacted with nearby levels during the session.
EUR/USD) Bearish trend analysis Read The captionSMC Trading point update
Technical analysis of summary for the EUR/USD H1 chart you shared:
---
Overall Bias: Bearish
Market structure and Smart Money Concepts indicate downside continuation after mitigation of a major H4 Fair Value Gap (FVG).
---
Key Technical Points
Price recently rejected a strong H4 supply + FVG zone
Located around 1.1530 – 1.1565
Price trading below both EMA 50 (blue) and EMA 200 (black)
→ Full bearish momentum alignment
Structure
Lower highs & lower lows forming
Bearish correction pattern drawn indicating continuation wave
Rejection from EMAs acting as dynamic resistance
Target Point 1.14540 – 1.14600
Major demand area & liquidity pool
---
Trade Idea Concept
Entry idea:
Wait for a minor pullback for better entries (in the bearish corrective pattern), preferably near EMA 50 or last supply.
Target:
1.14540 zone
Invalidation / SL level:
Break and close above 1.1565 (top of FVG zone) invalidates bearish setup.
---
Smart Money Concept Interpretation
Supply filled & mitigation done
BOS (Break of Structure) confirmed bearish direction
EMAs provide extra confluence
Targeting liquidity sweep under equal lows area
Mr SMC Trading point
---
Summary
EUR/USD shows high probability for continued downside, respecting premium-to-discount move. As long as price remains below 1.1530 – 1.1565, sellers remain in full control.
---
Please support boost 🚀 this analysis

EURUSD"The EUR/USD has the potential to fall (decline) from the price of 1.16132. The critical price level is 1.16219."

$EURUSD BULLISH ANALYSIS (READ CAPTION)Hello Traders! Today is 03 December 2025 Here is today my FX:EURUSD Bullish analysis check chart and send your ideas in comment section
FX:EURUSD working under the range, in there are more chances of a bullish breakout and can pump up. FX:EURUSD current value is 1.16400 and our supporting area is 1.15900 from this position market fully pump on bullish track. If market does not support this area then EURUSD next supporting area will be 1.14900 or 1.14500.
The bullish trend is intact, with potential for further gains towards 1.17000 and beyond. how ever, we may see some selling pressure around 1.18000 and 1.19000. A break above 1.20000 could signal continuation of the bullish trend.
BULLISH SCENARIO:
Pivot Point: (1.16400)
Target 1: (1.17000)
Supply zone: (1.18000)
1st Resistance: (1.19000)
Supporting Area (1.15900)
Strong Support Area: (1.14900 to 1.14500)
Long Term Resistance: (1.20000)
Warning: This Analysis is my personal Opinion. trade at your own risk
If you like my Analysis chart please dont forget to like and comment

30m timeframe contuinuation from elite callwe could see a continuation into 2 zones
1.17 resistance,
-1.18 resistance
the play is already in play. i would look for resistance if you have closed the preious call

Bullish bounce in play?Fiber (EUR/USD) has bounced off the pivot and could rise to the 1st resistance, which acts as a swing high resistance.
Pivot: 1.1597
1st Support: 1.1548
1st Resistance: 1.1709
Disclaimer:
The opinions given above constitute general market commentary and do not constitute the opinion or advice of IC Markets or any form of personal or investment advice.
Any opinions, news, research, analyses, prices, other information, or links to third-party sites contained on this website are provided on an "as-is" basis, are intended to be informative only, and are not advice, a recommendation, research, a record of our trading prices, an offer of, or solicitation for, a transaction in any financial instrument and thus should not be treated as such. The information provided does not involve any specific investment objectives, financial situation, or needs of any specific person who may receive it. Please be aware that past performance is not a reliable indicator of future performance and/or results. Past performance or forward-looking scenarios based upon the reasonable beliefs of the third-party provider are not a guarantee of future performance. Actual results may differ materially from those anticipated in forward-looking or past performance statements. IC Markets makes no representation or warranty and assumes no liability as to the accuracy or completeness of the information provided, nor any loss arising from any investment based on a recommendation, forecast, or any information supplied by any third party.

EURUSD sideways consolidation capped at 1.1580The EURUSD currency pair continues to display a bearish outlook, in line with the prevailing downward trend. Recent price action suggests a corrective pullback, potentially setting up for another move lower if resistance holds.
Key Level: 1.1580
This zone, previously a consolidation area, now acts as a significant resistance level.
Bearish Scenario (rejection at 1.1580):
A failed test and rejection at 1.1580 would likely resume the bearish momentum.
Downside targets include:
1.1490 – Initial support
1.1460 – Intermediate support
1.1440 – Longer-term support level
Bullish Scenario (breakout above 1.1580):
A confirmed breakout and daily close above 1.1580 would invalidate the bearish setup.
In that case, potential upside resistance levels are:
1.1600 – First resistance
1.1650 – Further upside target
Conclusion
EURUSD remains under bearish pressure, with the 1.1580 level acting as a key inflection point. As long as price remains below this level, the bias favours further downside. Traders should watch for price confirmation around that level to assess the next move.
This communication is for informational purposes only and should not be viewed as any form of recommendation as to a particular course of action or as investment advice. It is not intended as an offer or solicitation for the purchase or sale of any financial instrument or as an official confirmation of any transaction. Opinions, estimates and assumptions expressed herein are made as of the date of this communication and are subject to change without notice. This communication has been prepared based upon information, including market prices, data and other information, believed to be reliable; however, Trade Nation does not warrant its completeness or accuracy. All market prices and market data contained in or attached to this communication are indicative and subject to change without notice.

Holding bullish anticipating bearish takeoverBased on market sentiment from the Dollar Index and price action on EU and GU's charts, I expect bulls to hold the market here short-term before getting exhausted in the supply of the recent swing Lower High and giving way for bears to drive price back down to the most recent swing low.

EurUsd 30 Nov 2025 Sell PlanEurUsd 30 Nov 2025 Sell Plan
Swept Previous month high,
Market structure shift,
From bullish to bearish.

EURUSD Mid-term analysisGiven the upward movements of the Euro in the last month of the year, I expect an upward move, but since we were up last week, we need a corrective wave for long trades. So you can look for a long trade setup on lower time frames after the price corrects below 1.15500.

Possible Uptrend Continuation after brief consolidation.That looks like a potential **Bullish Flag/Channel** pattern forming on the EUR/USD 1-hour chart, suggesting a possible continuation of the preceding uptrend after a brief consolidation.
## 📈 Technical Analysis Overview
The chart shows the price consolidating within an upward-sloping channel (the two blue dashed lines) following a strong move up (the **flagpole**). This pattern is typically considered a **continuation pattern**.
* **Pattern:** Bullish Flag (or Ascending Channel/Channel Up).
* **Current Price:** Approximately **1.1566**.
* **Key Support (Bottom of the Channel/Proposed Entry Zone):** The red horizontal line at **1.15638** to **1.15466** (the shaded red box is the Stop-Loss zone). The lower blue dashed line represents dynamic support.
---
## 🎯 Proposed Trade Setup
The trade setup drawn on the chart anticipates a bounce off the lower boundary of the channel and a subsequent breakout to the upside.
### **1. Entry**
* **Potential Buy Zone:** Near the lower blue dashed line and the horizontal support level at approximately **1.15600 - 1.15700** (where the price is currently hovering). The red horizontal line is marked at **1.15638**.
### **2. Stop-Loss (Risk Management)**
* **Stop-Loss (SL) Level:** The red shaded area indicates the Stop-Loss should be placed below the recent swing low and the channel's support. The chart marks the bottom of this zone at **1.15308**. This is the point where the bullish structure is considered invalidated.
### **3. Take-Profit (Target)**
* **Take-Profit (TP) Level:** The target is set in the purple shaded box, which corresponds to the highs of the previous move (the start of the consolidation).
* **TP Zone:** **1.16636** to **1.16800**.
* *Note: A common target for a Flag pattern is to project the length of the flagpole from the point of breakout.*
---
## **🔮 Projected Price Action (The Cyan Path)**
The projected path indicates:
1. A short dip or consolidation to test the channel's lower support (the red zone/lower blue dashed line).
2. A strong **reversal/bounce** from this support.
3. A move up to break out of the top of the channel (the upper blue dashed line).
4. A continuation of the rally toward the main resistance/target zone (the purple box).
The pattern suggests a high-probability trade if the support holds and the upward momentum returns.
Would you like me to find some recent **fundamental news** for the EUR/USD pair that could influence this technical setup?

EURUSD - WEEKLY &DAILY ANALYSIS📈 Sym: #EURUSD | Timeframe: W1 & D1
📊 CHART OVERVIEW:
EURUSD is currently oscillating below both static & dynamic resistance levels, showing consolidation before a potential long-term bullish trend initiation. The structure suggests accumulation for a major upward movement.
🎯 KEY RESISTANCE ZONE:
1.19333 (Major Swing High + Psychological Level)
✅ Break & Close Above = Strong Buy Trigger
🟡 Confirmation on Weekly Close = Higher Conviction
🔧 TECHNICAL OBSERVATIONS:
Daily Chart: Price compression along an ascending trendline (bullish alignment)
Momentum Indicators: RSI showing bullish divergence on higher timeframes
🌍 FUNDAMENTAL CONTEXT:
❗️ FED Rate Decision Watch ❗️
Potential US interest rate cuts could create USD weakness, providing strong tailwinds for EURUSD upward movement. Monitor:
FOMC Statements
US Inflation Data
ECB vs FED Policy Divergence
🎯 TRADE SCENARIOS:
🟢 BULLISH SCENARIO:
Break above 1.19333 with strong candle close
Retest of broken resistance as support
Target: 1.22000 → 1.30000 (Long-term)
🔴 BEARISH SCENARIO:
Rejection from 1.19333 resiSTANCE
⚠️ RISK DISCLAIMER:
Trading forex/CFDs carries HIGH RISK and may not be suitable for all investors. You could lose more than your initial investment. This analysis is for educational/informational purposes only - NOT financial advice.
✅ Always:
Use proper risk management
Set stop losses
Trade only with capital you can afford to lose
Continue your own education before trading
👍 LIKE | 💬 COMMENT | 🔔 FOLLOW
for more detailed analysis and real-time updates!
❓ What's your take on this setup? Share your thoughts below!

EURUSD Approaching a Key Buy ZoneQuick Summary
EURUSD is approaching a potential buy zone near 1.15370 where the pair is expected to take liquidity below the low at 1.15474 before showing a bullish reaction The likely target after the rebound is the break of the descending trendline on the H4 timeframe with the demand zone aligning with the 61 Fibonacci level
Full Analysis
The pair is gradually moving toward an important area around 1.15370 This zone represents a potential point where strong buying pressure may appear The current movement seems focused on collecting liquidity below the low at 1.15474 and once this liquidity is taken the probability of a bullish reaction becomes higher
If the price reacts from this level the next objective will be a move toward breaking the descending trendline on the H4 timeframe This scenario aligns with a previously formed demand zone and converges with the 61 Fibonacci level which adds more strength to the bullish continuation outlook
The main focus now is to wait for a clear reaction from the 1.15370 zone Whether it appears as a strong bounce or a shift in control toward buyers this area is likely to play a key role in guiding the next move of the pair

EURUSD Sell after bullish retracementplanning to sell EURUSD after retrace the 1.15900 level this will be weak area because there are liquidity above but i will sell if i see a clear rejection from this zone + inducement
these 2 other zones are likely the price to rebound from them (the extreme is high probability)
