Trade ideas

EURUSD- SHORTBEARISH DAILY ORDERFLOW WITH A POSSIBLE SIBI FORMATION''
WUD BE COOL IF WE CAN WAIT FOR DAILY CANDLE CLOSURE TO SEE IF ANY IMBALANCE IS CREATED, otherwise that wud be my Daily context area to frame shorts targetimg the Discounted arrays [swig low} and finally the Demand Area
LTF comfirmation entries preferably H1 for swing.

EURUSD: Both Fed and ECB weekThe US inflation figures were in the focus of the market during the previous week. Data posted on Friday showed 0,3% increase in September, bringing the yearly inflation to 3,0%. September's inflation was a bit lower from forecasted 0,4%. Data are also showing cooling core inflation, which reached 0,2% in September and 3,0% on a yearly basis. Friday also brought University of Michigan Consumer Sentiment final figures for October of 53,6, which was a bit lower from expected 55. At the same time, five year inflation expectations were modestly increased to the level of 3,9% from previous 3,7%. As for other macro data posted during the week, the Existing Home Sales in September were by 1,5% higher from the previous month. The figure was much better from forecasted -2,0%. Due to “shutdown” of the US Government, other macro data continue to be unavailable.
The Producers Price Index in Germany in September was holding in a negative territory of -1,7% y/y, which was modestly higher from forecasted -1,9% y/y. The index for the month was at -0,1%. The HCOB Manufacturing PMI Flash for October in Germany was at 49,6, in line with market estimates.
The eurusd currency pair was moving within a relatively shorter range during the previous week. The week started modestly below the 1,17 short-term resistance, and moved down toward the lowest weekly level at 1,1580. During the second half of the week, the 1,16 level has been tested, while the currency pair is closing the week at 1,1626. There has not been a clear trend evident on the charts, which was also reflected in movements of the RSI. The indicator continues to move in a range between levels of 40 and 50. The MA50 continues with its modest converging path toward the MA200, but the distance between lines shows no indications over potential cross in the near term.
Although this week was a little bit in a slow-motion mood on the eurusd market, the week ahead might bring a change. Namely, both the ECB and the Fed will be holding meetings and discussing a potential change in levels of interest rates. The FOMC meeting is scheduled for Wednesday, October 29th, while the ECB meeting will be held on the next day. Considering calming inflation in the US and some weakening of the labour market, investors are increasing odds for another Fed's interest rate cut by 25 basis points. The CME Fed WatchTool currently shows 96% probability for a rate cut. At the same time Reuters investors' pool shows no expectations from market participants that the ECB will make any change in the level of interest rates at this meeting. As per current charts, there is decreased probability for further strengthening of the USD. The level of 1,1550 could be shortly tested. Charts are more oriented toward the upside, and higher probabilities that 1,17 could be tested for one more time, with a potential also for 1,1750.
Important news to watch during the week ahead are:
EUR: Ifo Business Climate in Germany for October, GfK Consumer Confidence in Germany for November, GDP Growth rate in Germany flash for Q3, GDP Growth rate in the Euro Zone flash for Q3, Inflation rate in Germany preliminary for October, ECB Meeting and interest rate decision will be held on Thursday, October 30th, Retail Sales in Germany in September, Inflation rate in the Euro Zone flash for October.
USD: Pending Home Sales in September, FOMC Meeting will be held on Wednesday, October 29th, where Fed will discuss potential interest rate change.

Market Insights with Gary Thomson: 27 - 31 OctoberMarket Insights with Gary Thomson: US and Canada Rate Decisions, Earnings Reports & Trade Tensions
In this video, we’ll explore the key economic events and market trends, shaping the financial landscape. Get ready for insights into financial markets to help you navigate the week ahead. Let’s dive in!
In this episode of Market Insights, Gary Thomson unpacks the strategic implications of the week’s most critical events driving global markets.
👉 Key topics covered in this episode:
— US Interest Rate Decision
— Canada Interest Rate Decision
— Corporate Earnings Reports
— Trade Tensions
Gain insights to strengthen your trading knowledge.
This video represents the opinion of the Companies operating under the FXOpen brand only. It is not to be construed as an offer, solicitation, or recommendation with respect to products and services provided by the Companies operating under the FXOpen brand, nor is it to be considered financial advice.

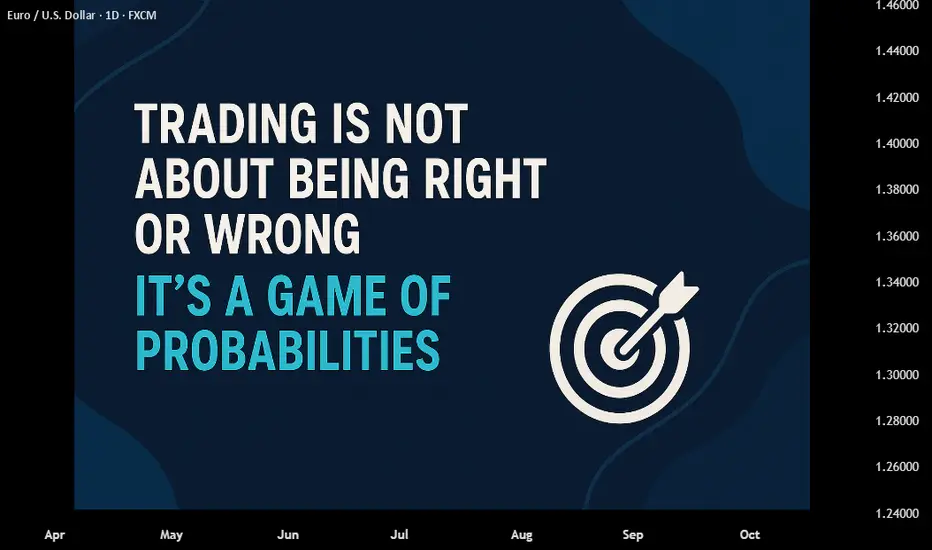
Trading is the Game of ProbabilitiesMost traders start with one simple goal ➜ to be right all the time
🔲Right about the trend.
🔲Right about the breakout.
🔲Right about the trade.
But here’s the truth - 'the market doesn’t care who’s right'.
↳ Even the best analysis fails sometimes.
↳ Even the weakest setup works sometimes.
Because trading isn’t a test of accuracy, it’s a test of managing what is more probable.
↳ Profitable traders don’t chase perfection.
↳ They focus on risk, reward, and consistency.
We can be wrong 6 times out of 10...
And still make money if our winners are bigger than our losers.
↳ Trading success is not about predicting.
↳ It’s about positioning and managing our trade.
We manage risk when the odds are low.
We maximize reward when the odds are high.
The shift happens when we stop trying to be right...
and start thinking in probabilities.
That’s when we stop gambling and start profitable trading.
Are you playing casino or managing your risk?
EURUSD rebounded strongly indicating renewed buying interestThe EUR/USD pair rebounded strongly from the 1.1630 key support level, indicating renewed buying interest at this area. The sharp recovery suggests that bullish momentum is gaining traction as long as price remains above 1.1630.
Technically, sustained trading above the 1.1630 support keeps the bullish bias intact, with potential for a move toward higher resistance zones. A confirmed break and stabilization below 1.1630, however, would invalidate the bullish outlook and could open the door for a deeper correction toward lower support levels. if the price reaction to upwards then next resistance 1.17010 to 1.17500,
You may find more details in the chart.
Trade wisely best of Luck buddies,
Ps; Support with like and comments for better analysis Thanks for Supporting.

EURUSD WEEKLY PERSPECTIVE .EURUSD EXCHANGE RATE WEEKLY CLOSE @ 1.16258
EU10Y =2.625%
ECB RATE DETAILS
Deposit facility rate: 2.00%
Main refinancing operations (MRO) rate: 2.15%
Marginal lending facility rate: 2.40%
The head of the European Central Bank (ECB) is Christine Lagarde.
The upcoming ECB monetary policy meeting is scheduled for October 30, 2025, hosted by Banca d'Italia in Florence, Italy. The ECB will announce its interest rate decision on that day around 13:45 CET, followed by a press conference at 14:30 CET.
Market expectations heavily favor no change in rates at this meeting given recent ECB signals and the current economic outlook.
Christine Lagarde is expected to continue leading the ECB until the end of her term in late 2027, with discussions ongoing about her successor possibly being from Germany.
UNITED STATES OF AMERICA DETAILS
US10Y =4.003%
FEDERAL FUND RATE = 4.0%-4.25%
the current federal funds rate set by the Federal Reserve is in the range of 4.00% to 4.25%, following a 25 basis points rate cut in September 2025. This cut marked the first reduction in interest rates for 2025, prompted by signs of a weakening labor market despite inflation still being above the Fed's 2% target.
The Federal Open Market Committee (FOMC), which directs U.S. monetary policy, projects two additional 25 basis point rate cuts for the remainder of 2025, most likely at the upcoming meeting on Wednesday 29th 2025 by 7:00pm
Federal Funds Rate
4.00% 4.25%
FOMC Statement
FOMC Press Conference
This outlook reflects precautions amid a moderated economic activity environment, slower job gains, and inflation concerns.
The head of the Federal Reserve is Jerome Powell, Powell continues to guide the Fed through complex economic conditions including inflation management and labor market monitoring.
INTEREST RATE DIFFERENTIAL= (EUR-USD) 2.15%-(4.0%-4.25%)=(-1.85%-2.1%) FAVOUR USD
BOND YIELD DIFFERENTIAL=(EURO-USD )=(2.625%-4.003%)=1.378% FAVOUR USD
BUT EURO ECONOMIC OUTLOOK IS STABLE OFFSETTING BONDYIELD AND INTEREST.
The EUR/USD exchange rate movement is influenced significantly by the interest rate differential and bond yield differential between the Eurozone (ECB) and the US (Fed), as well as the uncovered interest parity (UIP) theory.
Interest Rate Differential
The interest rate differential (IRD) between the Federal Reserve and European Central Bank drives currency value shifts.
The Fed federal funds rate stands at 4.00%-4.25%, with an expectation of further cuts.
The ECB main refinancing rate is at 2.15%, having paused rate cuts.
This widening differential favors the USD in carry trade strategies since higher US rates attract capital seeking better returns, resulting in USD strength versus the EUR.
Bond Yield Differential
Similarly, bond yields between US Treasury and Eurozone bonds play a crucial role. US 10-year Treasury yields are generally higher than Eurozone 10-year Bund yields, reinforcing the USD's relative attractiveness. This yield gap reflects differing monetary policy stances and economic outlooks.
Uncovered Interest Parity (UIP)
UIP theory states that expected changes in exchange rates offset interest rate differentials to prevent arbitrage. In practice, if US interest rates remain higher, the USD should appreciate versus EUR to restore parity in forward-looking returns. However, market dynamics, geopolitical risks, and trade flows can cause deviations from UIP in the short to medium term.
CARRY TRADE ADVANTAGE
the carry trade favor USD but any rate cut from the next FOMC MEETING WILL ERODE GAINS AND EURO STABLE ECONOMIC OUTLOOK BACKED MY MARKET STRUCTURE KEEP EURO BUY AS AN OPTION.
TRADE HISTORY IN CONTEXT.
EURUSD on weekly time frame descending trendline connecting Monday 29th 2018,monday 11 jan 2011 feb,and may 2011 finally came back in 2025 and rejected on the weekly descending trendline again at 1.18912 and we close the week on eurusd loss at 1.16258 rate in the fx window.
key demand at 1,4754 will be watched
key demand floor at (1.10275-1.10851)
the application of Fibonacci 50% retracement of that rally will be in the zone 1.10563 as a key buy zone should the federal reserve rate cut gets flip against euro.
#EURUSD #EU10Y #US10Y #DOLLAR

Potential bearish continuation?EUR/USD is rising towards the resistance level, which is a pullback resistance that aligns with the 61.8% Fibonacci retracement and could reverse from this level to our take profit.
Entry: 1.1601
Why we like it:
There is a pullback resistance that aligns with the 61.8% Fibonacci retracement.
Stop loss: 1.1637
Why we like it:
There is an overlap resistance level.
Take profit: 1.1542
Why we like it:
There is a multi-swing low support level.
Enjoying your TradingView experience? Review us!

Sell EURUSDEURUSD seems to be printing a bearish flag on the 4hr chart. It would be interesting to see how price reacts from this area of resistance.

EURUSD SELLEURUSD H4 CHART
Hello Traders. If you find this analysis useful, please support me with your likes and comments.
If you have another analysis at this pair, please share in comments, I will be glad to discuss with you.

Bearish reversal off 61.8% Fibonacci resistance?The Fiber (EUR/USD) is reacting off the pivot, which is a pullback resistance that aligns with the 61.8% Fibonacci retracement and could bounce to the swing high resistance.
Pivot: 1.1668
1st Support: 1.1618
1st Resistance: 1.1710
Disclaimer:
The above opinions given constitute general market commentary, and do not constitute the opinion or advice of IC Markets or any form of personal or investment advice.
Any opinions, news, research, analyses, prices, other information, or links to third-party sites contained on this website are provided on an "as-is" basis, are intended only to be informative, is not an advice nor a recommendation, nor research, or a record of our trading prices, or an offer of, or solicitation for a transaction in any financial instrument and thus should not be treated as such. The information provided does not involve any specific investment objectives, financial situation and needs of any specific person who may receive it. Please be aware, that past performance is not a reliable indicator of future performance and/or results. Past Performance or Forward-looking scenarios based upon the reasonable beliefs of the third-party provider are not a guarantee of future performance. Actual results may differ materially from those anticipated in forward-looking or past performance statements. IC Markets makes no representation or warranty and assumes no liability as to the accuracy or completeness of the information provided, nor any loss arising from any investment based on a recommendation, forecast or any information supplied by any third-party.

Bearish reversal off 50% Fibonacci resistance?EUR/USD could rise towards the resistance level, which is a pullback resistance that aligns with the 50% Fibonacci retracement and could reverse from this level to our take profit.
Entry: 1.1650
Why we like it:
There is. pullback resistance that aligns with the 50% Fibonacci retracement.
Stop loss: 1.1675
Why we like it:
There is a pullback resistance that is slightly above the 61.8% Fibonacci retracement.
Take profit: 1.1619
Why we like it:
There is a pullback support level that aligns with the 38.2% Fibonacci retracement.
Enjoying your TradingView experience? Review us!
Please be advised that the information presented on TradingView is provided to Vantage (‘Vantage Global Limited’, ‘we’) by a third-party provider (‘Everest Fortune Group’). Please be reminded that you are solely responsible for the trading decisions on your account. There is a very high degree of risk involved in trading. Any information and/or content is intended entirely for research, educational and informational purposes only and does not constitute investment or consultation advice or investment strategy. The information is not tailored to the investment needs of any specific person and therefore does not involve a consideration of any of the investment objectives, financial situation or needs of any viewer that may receive it. Kindly also note that past performance is not a reliable indicator of future results. Actual results may differ materially from those anticipated in forward-looking or past performance statements. We assume no liability as to the accuracy or completeness of any of the information and/or content provided herein and the Company cannot be held responsible for any omission, mistake nor for any loss or damage including without limitation to any loss of profit which may arise from reliance on any information supplied by Everest Fortune Group.

Heading into 61.8% Fibonacci resistance?The Fiber (EUR/USD) is rising towards the pivot, which has been identified as an overlap resistance that aligns with the 61.8% Fibonacci retracement and could reverse to the 1st support.
Pivot: 1.1620
1st Support: 1.1541
1st Resistance: 1.6684
Disclaimer:
The above opinions given constitute general market commentary, and do not constitute the opinion or advice of IC Markets or any form of personal or investment advice.
Any opinions, news, research, analyses, prices, other information, or links to third-party sites contained on this website are provided on an "as-is" basis, are intended only to be informative, is not an advice nor a recommendation, nor research, or a record of our trading prices, or an offer of, or solicitation for a transaction in any financial instrument and thus should not be treated as such. The information provided does not involve any specific investment objectives, financial situation and needs of any specific person who may receive it. Please be aware, that past performance is not a reliable indicator of future performance and/or results. Past Performance or Forward-looking scenarios based upon the reasonable beliefs of the third-party provider are not a guarantee of future performance. Actual results may differ materially from those anticipated in forward-looking or past performance statements. IC Markets makes no representation or warranty and assumes no liability as to the accuracy or completeness of the information provided, nor any loss arising from any investment based on a recommendation, forecast or any information supplied by any third-party.

EUR/USD: Bearish Control Holds Below Trendline Resistance ZoneEUR/USD is trading just beneath the descending trendline, showing repeated rejection near 1.16675 and signaling sustained seller strength. The pair remains within a broad descending channel, with each rally met by strong resistance near the upper boundary.
A break below 1.1600 could invite fresh downside pressure toward 1.15400, and possibly 1.15100 if momentum accelerates. Broader sentiment stays bearish as long as price holds below 1.16970, especially with the macro backdrop favoring USD strength.

EURUSD Short 10/28Details are in the chart.
- Clear downtrend with established LH & LL.
- Fakeout of current structure. Bearish flag waiting to descend. Need to shakeout more sellers.
- MACD Free fall.
If you can get good at one thing in the FOREX space, it should be technical analysis. It tells all, before any new fundamentals are known.
Alex

EUR/USD Elliott Wave Update: Wave (iv) Correction UnfoldingThis EUR/USD chart shows the market undergoing a complex corrective phase, labelled as wave (iv), likely forming a triangle pattern (a)-(b)-(c)-(d)-(e) after an impulsive rally. The correction is taking place within a well-defined base channel, suggesting consolidation before a potential breakout into wave (v) targeting higher levels near 1.19–1.20. As long as the channel holds, the Elliott Wave structure supports a bullish continuation once the correction completes.
Keep following for regular breakdowns as the bigger trend unfolds.

Euro Coils Ahead of Fed / ECBEuro plummeted more than 3.1% from the yearly highs with price exhausting into technical support for the past three-weeks and the focus is on possible inflection into this zone with the medium-term risk still weighted to the downside while below the monthly open (1.1734).
Initial weekly support rests with the July low-week close (LWC) / 61.8% retracement of the July advance at 1.1586/93 and is backed by 1.1497-1.1505- a region defined by the March 2020 high, the 2022 high, and the 100% extension of the September decline. Look for a larger reaction there IF reached with a break / weekly close below needed to suggest a more significant high is in place / a larger correction is underway within the broader uptrend. Subsequent support objectives eyed at the Aril high close at 1.1394 with the next major technical consideration eyed at the 2024 high-week close (HWC) / 38.2% retracement of the yearly range at 1.1228/54.
Weekly resistance is eyed at the 1.1747/75- a region defined by the 2025 HWC, the June high-close, and the 61.8% retracement of the September decline. A breach / weekly close above this pivot zone is needed to mark resumption of the broader uptrend with key resistance steady at the 100% extension of the 2022 advance / 38.2% retracement of the broader 2008 decline at 1.1917-1.2020 (area of interest for possible exhaustion / price inflection IF reached. Subsequent resistance eyed at the 2021 HWC at 1.2218 in the event of a breakout.
Bottom line: Euro is trading just above support, and the focus is on inflection off this zone in the days ahead with a weekly close below needed to fuel the next leg of this pullback. From a trading standpoint, rallies should be limited to 1.1734 IF price is heading lower on this stretch with a close below 1.1497 needed to fuel the next leg of the decline.
-MB

EURUSD: Bearish-Neutral. Look For Valid SellsWelcome back to the Weekly Forex Forecast for the week of Oct. 27 - 31st.
The EURUSD is moving sideways since Wednesday. Look for the -FVG to hold price, and to trade lower from.
FOMC is Wed and ECB is Thursday. Be care with new entries before the news is announced.
Enjoy!
May profits be upon you.
Leave any questions or comments in the comment section.
I appreciate any feedback from my viewers!
Like and/or subscribe if you want more accurate analysis.
Thank you so much!
Disclaimer:
I do not provide personal investment advice and I am not a qualified licensed investment advisor.
All information found here, including any ideas, opinions, views, predictions, forecasts, commentaries, suggestions, expressed or implied herein, are for informational, entertainment or educational purposes only and should not be construed as personal investment advice. While the information provided is believed to be accurate, it may include errors or inaccuracies.
I will not and cannot be held liable for any actions you take as a result of anything you read here.
Conduct your own due diligence, or consult a licensed financial advisor or broker before making any and all investment decisions. Any investments, trades, speculations, or decisions made on the basis of any information found on this channel, expressed or implied herein, are committed at your own risk, financial or otherwise.

Short trade
📘 Trade Journal Entry
Pair: EURUSD
Direction: Sell-Side Trade
Date: Thu 30 Oct 25
Time: 3:30 am
Session: London Session AM
Timeframe: 15 Min
🔹 Trade Details
Metric Value
Entry 1.16190
Profit Level (TP) 1.15480 (+0.61%)
Stop Level (SL) 1.16379 (–0.16%)
Risk–Reward (RR) 3.76 R
🔸 Technical Context
Market Structure:
Price printed a lower-high formation following a weak London open. After multiple sweeps above intraday liquidity, the pair shifted structure with a clear CHOCH (15 min) and BOS confirmation.
Key Zones:
Entry Zone: 1.1618 – 1.1620 (Sell-side rejection area / FVG 15 min)
Target Zone: 1.1548 – 1.1540 (Demand + daily low cluster)
Stop Zone: Above previous swing high and adaptive MA crossover
Confluences:
Price rejection at KAMA (adaptive MA) acting as dynamic resistance.
5 min BDS and FVG overlap aligned with premium pricing.
Volume expansion on the bearish impulse post-CHOCH.
Liquidity draw visible below prior daily lows (1.1550 handle).
🔹 Narrative & Bias
The short entry follows a liquidity sweep + structure break model within the London session.
The 15 min CHOCH signalled that buy-side liquidity was exhausted, creating a sell-off aligned with the higher-timeframe narrative of Euro correction and renewed USD demand.
Sentiment Context:
Macro tone supported by stronger USD data and intraday Dollar index recovery.
Euro showing exhaustion after prior session rallies; correlated GBP pairs confirm relative Euro out-performance but broader USD dominance.
Projection:
Expect price to continue seeking sell-side liquidity toward 1.1550 – 1.1540 before consolidation or a retracement into the broken structure zone for potential re-entry.

EURUSD After making a head & shoulder pattern, price has broken the 1.16500 area. I’m expecting a retest of the area before bearish momentum take price back down to the 1.15500 support.

EUR/USD: Bearish Pullback to 1.155?FX:EURUSD is flashing bearish signals on the 4-hour chart , where price is respecting a downward trendline with successive lower highs, indicating ongoing weakness and potential for further downside as sellers maintain control near the resistance zone. This setup points to a classic continuation pattern if the trendline holds as resistance.
Entry zone between 1.168-1.170 for a short position. Target at 1.155 near the support zone, offering a risk-reward ratio greater than 1:2.5 . Set a stop loss on a close above 1.1745 to protect against an upside break. Look for confirmation on a breakdown below the entry with rising volume, amid persistent USD strength over the EUR.
Fundamentally , this week features key GDP releases from the Eurozone (Q3 flash on October 29) and the US (Q3 advanced on October 30). Additionally, the upcoming meeting between Trump and Xi could lead to a US-China trade agreement or lack thereof, significantly impacting markets. 💡
📝 Trade Plan:
🎯 Entry Zone: 1.168 – 1.170 (short setup near resistance)
❌ Stop Loss: Close above 1.1745
✅ Target: 1.155 (support zone)
💎 Risk-to-Reward: Greater than 1:2.5, offering a high-quality short opportunity within the prevailing bearish trend.
What's your outlook on this setup? Drop your thoughts

EUR/USD Looking bullish trend bullish from key support EUR/USD Bullish Setup Alert! 💶💵
The pair is showing strong bullish momentum after rebounding from the key support zone at 1.16300.
📊 On the 1H timeframe, buyers are taking control — price action confirms potential upside continuation!
🎯 Technical Targets:
1️⃣ 1st Target: 1.16600
2️⃣ 2nd Target: 1.17300
⚠️ Always apply proper risk management — protect your capital first! 🛡️
💬 Like 👍 | 💭 Comment | 🔁 Share
Let’s trade smart, not hard! 💪📈

