USD/MXN Extends Decline Within Downward ChannelUSD/MXN continues to trade inside a well-defined descending channel that has contained price action since mid-April. The pair recently bounced from the lower boundary of the channel near 18.20, but remains capped by resistance around the 50-day SMA (18.63). The broader structure remains bearish as the 200-day SMA (19.57) continues to slope lower above price.
Momentum indicators align with this view. The RSI is currently at 35, hovering near oversold territory but not yet signaling a clear reversal. The MACD remains in negative territory with the signal line above the MACD line, showing that bearish momentum is still intact despite the recent stabilization.
If the channel persists, traders may monitor the upper boundary near 19.00 as resistance, while the 18.20 region serves as immediate support. A break beyond either side of the channel could indicate a potential shift in trend strength.
-MW
USDMXN trade ideas
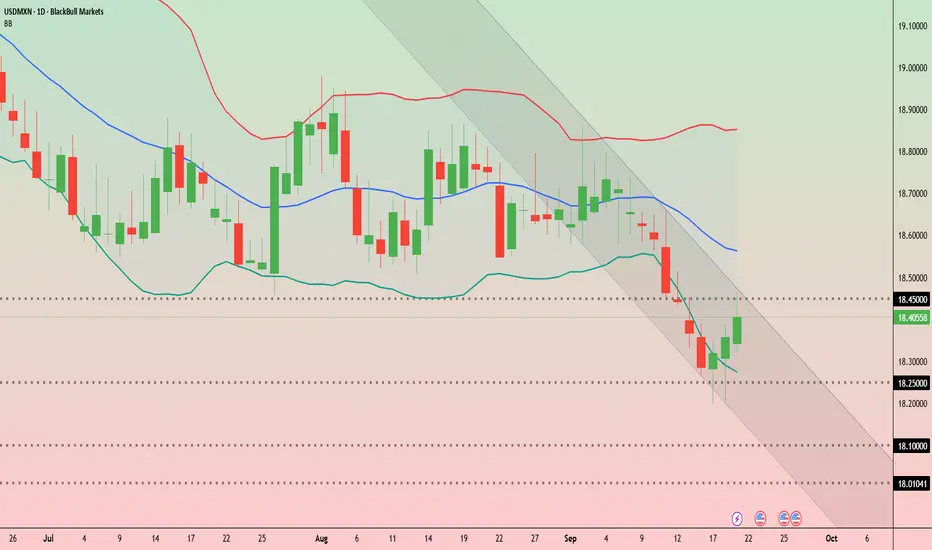
Peso resilience tested ahead of Banxico decision USD/MXN has staged a rebound after sliding to multi-week lows near 18.20. On the daily chart, price bounced off the lower Bollinger Band and is now testing the 18.40–18.45 zone.
This area also aligns with the upper boundary of the short-term descending channel that has guided the selloff through September.
A clean break above 18.45 could be the first sign of momentum shifting, opening the way toward 18.65 and the mid-Bollinger Band near 18.75. The broader trend, however, might still be bearish.
For now, support remains firm at 18.25–18.20. A failure to hold that floor could bring renewed pressure, exposing 18.10 and the psychological 18.00 level.
That technical setup frames the importance of Banxico’s upcoming decision. All 24 analysts surveyed by Reuters expect a 25-basis-point cut to 7.50%. While headline inflation has eased, August CPI data showed that core pressures are proving sticky, limiting the space for more aggressive easing.
Trade policy is also adding uncertainty. Mexico’s Economy Minister confirmed plans to lift tariffs on imported light vehicles and auto parts, raising duties on cars from Asia — particularly China — from 20% to 50%. These measures echo protectionist steps seen under the Trump administration and could complicate Mexico’s trade outlook at a sensitive time, adding volatility to peso trading.
For traders, the key question is whether the peso’s resilience will hold if Banxico delivers a cut as expected. With technical levels tightening around 18.25–18.45, the combination of policy tone and tariff rhetoric could be the catalyst for a decisive breakout or renewed downside.
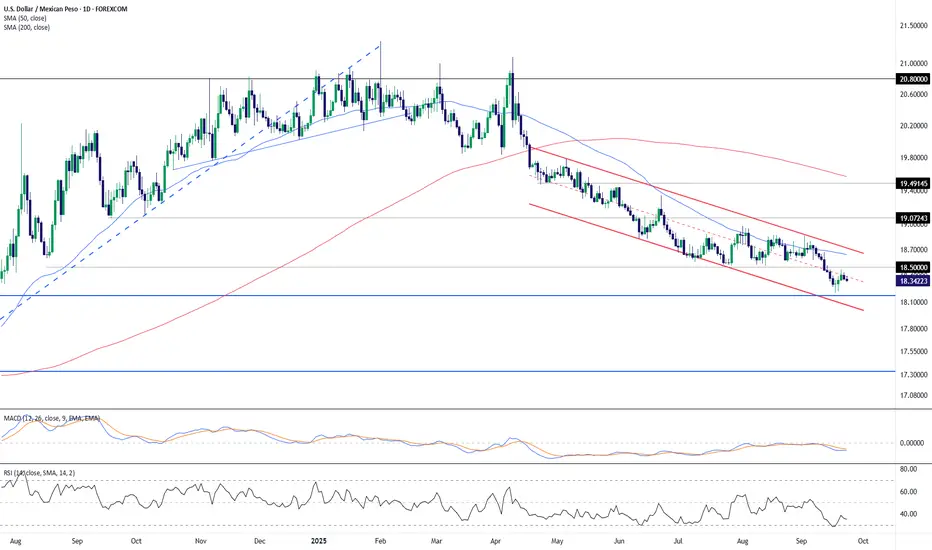
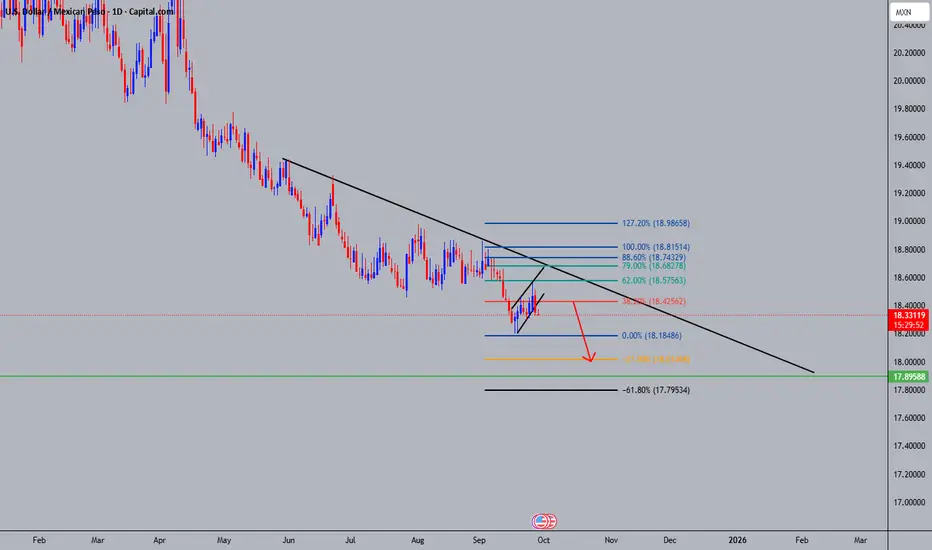
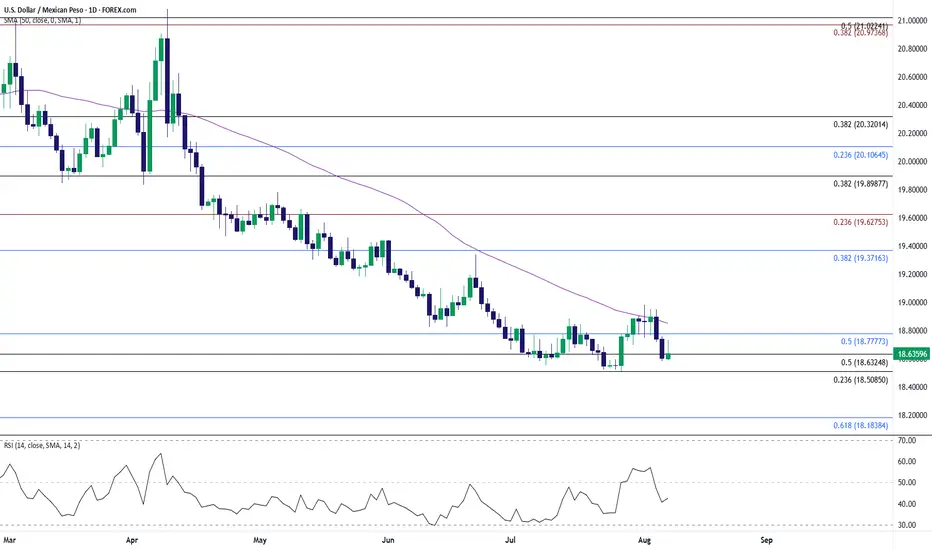
USD/MXN Breaking Down - Where Next?The chart shows USD/MXN (daily timeframe) under steady bearish pressure, extending its decline inside a well-defined descending channel. Here’s the breakdown:
Trend & Structure: Price has been moving lower since the peak near 21.00 earlier this year. It is now trading below both the 50-day SMA (18.67) and the 200-day SMA (19.61), reinforcing the bearish bias.
Support & Fibonacci Levels:
The immediate focus is the 18.17 zone, which aligns with the 61.8% Fibonacci retracement of the April–July 2024 rally.
Below that, the next major level is 17.33 (78.6% Fib), followed by 16.26 (100% retracement).
Resistance Levels:
First resistance sits at 19.07, followed by the 19.49 area near the upper channel boundary.
A breakout above the 50-day SMA could open the way to test the 200-day SMA near 19.61.
Momentum Indicators:
MACD is below the signal line, showing continued bearish momentum.
RSI (28) is in oversold territory, suggesting that sellers are losing strength and a short-term bounce may develop.
Outlook:
USD/MXN remains in a strong downtrend, but with RSI flashing oversold and price nearing the 61.8% retracement support, the pair could see a corrective rebound in the short term. However, as long as the price stays below 19.07–19.50, the broader bias remains bearish, favoring further downside toward 18.17 and possibly 17.33.
-MW

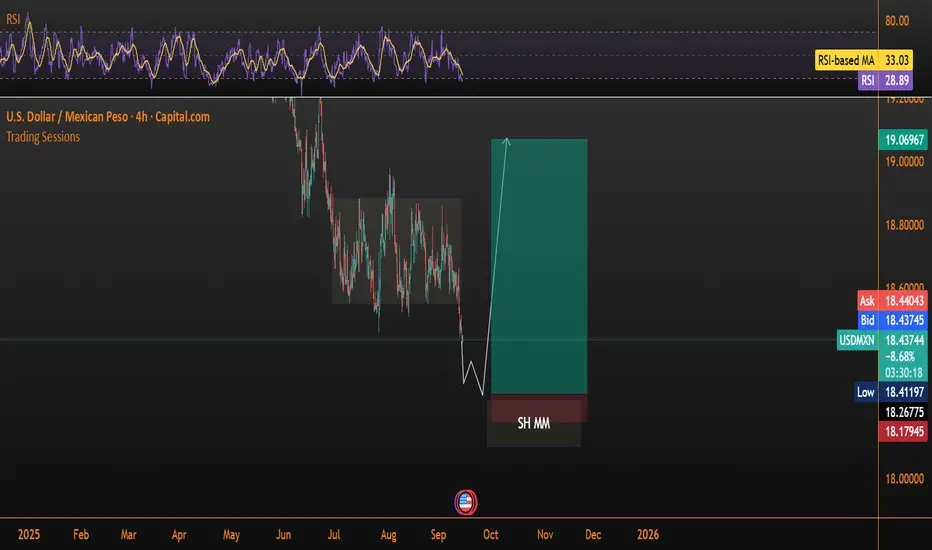
USDMXNThe Mexican peso has broken out of the range buildup to the downside. We're looking for a way to neutralize all that liquidity below and now make a small purchase above. Use small lots because it's an expensive pair to trade.
USDMXNLove Mexico, so here is my idea for short-term.
USDMXN
Take a look for correlations.
Best Regards,
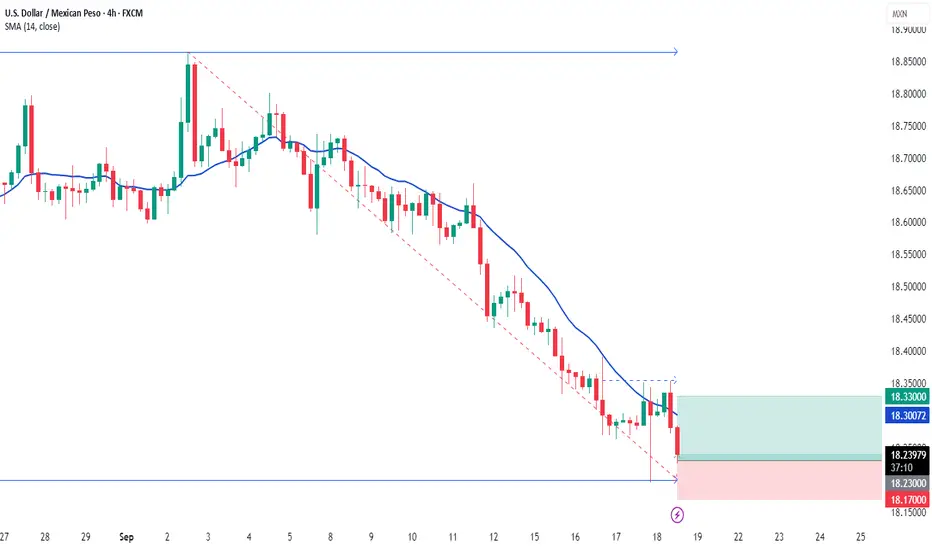
USD/MXN Analysis – 4H SetupOverall direction on the daily and weekly charts remains bearish, with the pair still in a broader downtrend. However, on the 4H timeframe we now have a potential bullish confirmation at key support areas.
📍 Setup Idea
Price has tested and respected support zones around 18.30 – 18.38.
Bullish reaction from these levels suggests a possible short-term correction before continuing the larger downtrend.
Entry is based on confirmation at these supports, targeting the next resistance area.
🎯 Targets
First target: 18.55
Extended target: 18.62 – 18.70 zone (major resistance).
⛔ Stop-Loss
Below 18.31 support to protect against further downside continuation.
⚠️ Note:
This is a counter-trend buy setup, so risk management is key. I’ll be looking to ride this corrective move upward but will continue respecting the bearish bias on higher timeframes.

USD/MXN Analysis (330 words) The current movement of USD/MXN isUSD/MXN Analysis (330 words)
The current movement of USD/MXN is defined by a fierce contest between global monetary policy and Mexico's unique domestic strengths. **Broad USD strength** serves as the core upward catalyst, as persistent market expectations for delayed Federal Reserve rate cuts continue to bolster the dollar, exerting generalized pressure on the MXN.
Nevertheless, the Mexican peso has demonstrated notable resilience, emerging as an outperformer among emerging market currencies. Its strength stems primarily from **exceptionally high interest rates (currently 11.00%)**, which attract substantial carry trade inflows. Furthermore, **robust domestic economic data**, a surge in foreign direct investment (FDI) fueled by "nearshoring" trends, and sound fiscal fundamentals collectively form a solid foundation of support for the peso.
From a technical perspective, the **16.80-17.00** zone represents a significant technical and psychological resistance barrier. A decisive break above this area could open the path for further gains, with the next target residing around 17.20. On the downside, the **16.50-16.30** range serves as a key near-term support interval. Any flare-up in risk-aversion sentiment could weaken the MXN's carry trade appeal, prompting the pair to test resistance. Conversely, softer U.S. economic data or a sustained hawkish stance from Mexican authorities could see the exchange rate retreat toward support. The short-term outlook favors consolidation within elevated levels, with direction dependent on the outcome of this ongoing tug-of-war.

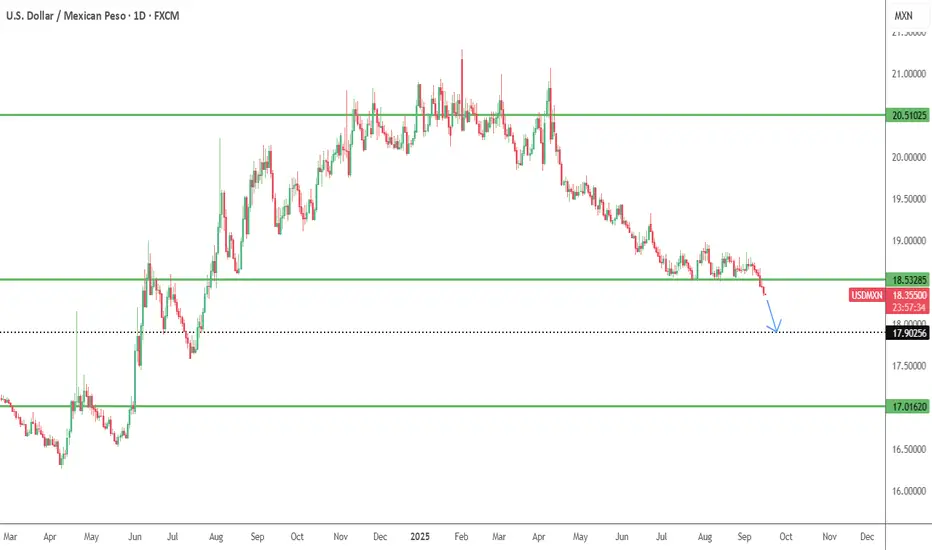
Mexican Peso VS US Dollar - Fight against the Emerging marketsTriple Top has formed on USD/MXN.
Price<20 and 200MA
Target 17.55
If you look at the last analysis I did on the USD/ZAR (South African Rand) you'll see there is weakness to come for the USD still.
And with this currency, it shows a similar move.
There are further reasons for the MExican Peso to rally
🇲🇽 High interest rates in Mexico → Banxico’s policy rate (~7.75%) offers good yields vs US, drawing in investors.
💵 Weakening US dollar & lower US yields → The USD has been under pressure, especially with soft US labor data and declining Treasury yields.
⚖️ Tariff relief & trade-talk wins → Delays / exemptions in US tariffs helped Mexico; better trade relations (USMCA) boost investor confidence.
📉 Improved risk sentiment → Global volatility eased, risk-on mood returned, pushing capital toward emerging assets like the peso.
Disclosure: I am part of Trade Nation's Influencer program and receive a monthly fee for using their TradingView charts in my analysis.

USD/MXN Faces Another Key Support ZoneOver the last three sessions, the USD/MXN pair has posted a depreciation of around 0.8%, with selling pressure remaining in favor of the Mexican peso. This move is mainly driven by speculation around the upcoming release of U.S. inflation (CPI) data, scheduled for tomorrow. Markets are looking to confirm whether inflation has started to ease in the short term, which would allow the Federal Reserve to maintain its outlook for lower interest rates. This expectation has weakened the U.S. dollar and, in turn, given the Mexican peso room to strengthen in recent sessions. If the inflation data reinforces this view, selling pressure on the pair could remain relevant.
Sideways Range Remains Intact
Although recent movements are starting to show a more evident bearish bias, they have not yet been sufficient to break the sideways channel between 19.00 pesos per dollar and 18.50 pesos per dollar. This range continues to be the most important technical formation in the short term. As long as the price fails to decisively break these levels, neutrality is likely to dominate trading in the sessions ahead.
Technical Indicators
RSI: The RSI line has crossed below the central 50 level and maintains a downward slope, indicating that selling impulses are beginning to dominate in the short term. However, since the indicator remains close to the neutral zone, the market could easily slip back into a phase of steady neutrality in the coming sessions.
MACD: The MACD histogram shows slight oscillations around the zero line, reflecting a lack of clear direction in the short term. In this context, the broader chart still points to a neutral stance.
Key Levels:
19.00 pesos per dollar – Resistance: Aligned with the 50-period moving average and the upper boundary of the Ichimoku cloud. A breakout above this level could open the way to a short-term bullish bias.
18.70 pesos per dollar – Nearby Barrier: Midpoint of the current sideways range. As long as the price trades around this area, neutrality is likely to prevail and extend the range structure.
18.50 pesos per dollar – Crucial Support: Marks the zone where recent lows have held in the past weeks. A breakdown below this level would represent a significant break, potentially confirming the continuation of the downtrend that has persisted throughout 2025.
Written by Julian Pineda, CFA – Market Analyst

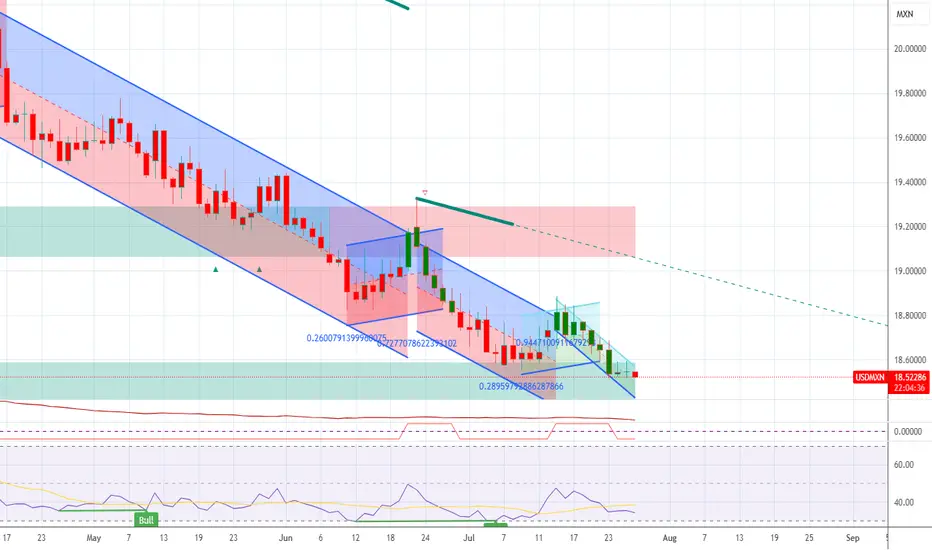
Will USD/MXN Break Above its Bearish Channel?USD/MXN is showing signs of a potential shift after months of steady declines within a well-defined descending channel.
The pair recently found a floor near 18.50, which aligns with the lower boundary of the channel, and has since rebounded back above its 50-day SMA for the first time in weeks. This suggests selling pressure is easing, with early signs of a possible breakout from the downtrend.
The 200-day SMA still looms overhead near 19.70, acting as a longer-term resistance barrier, but intermediate levels such as 19.07 and 19.49 will be key checkpoints if momentum continues higher. On the momentum side, the MACD is flattening and on the verge of a bullish cross, while the RSI has lifted above 50, reinforcing a shift in short-term sentiment.
For now, the bias is cautiously turning constructive. A sustained move above 19.07 would strengthen the case for a broader recovery, while a failure to hold the 18.50 floor could see the downtrend resume. -MW

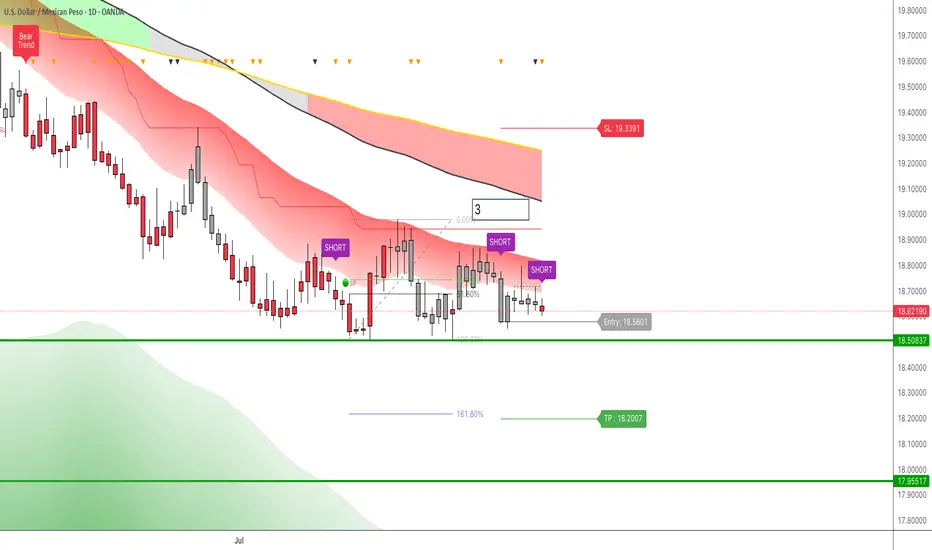
USDMXN: Short TriggerHello fellow traders,
today I share the UsdMxn chart in which we have a new Short trigger signal from LuBot.
The signal appears on the daily timeframe and is a very good trigger for the following reasons:
1. Red candles: the short structure returns bearish in favor of the main trend.
2. Downswing swings with highs that do not exceed the red fast trend cloud.
3. Double pinBar with decreasing maximums
4. Signal on the third negative swing of the weekly timeframe that has just begun after a period of lateralization / breathing space.
5. Reversal Trend signal in favor of the trigger
As the first target area we see the support level given by the weekly lows starting from 2017 to which the price has reacted in recent weeks.
Breaking this level, our main objective for this trade will be the 161.8 level of the fibonacci retracement of the latest swings which coincides with the TP suggested by LuBot.
The stop loss can be placed as a precaution on the level suggested by the indicator, or if you want to increase the return risk you can place it immediately above the last high where we will see a change in the short-term structure.
You could opt for a double trade with different sizes with these 2 methods, placing the smaller size in the riskier trade. But never exceeding the total risk of 3 or maximum 5% of the total capital of the entire trade.
👍 If you want to see other similar posts, like/boost
🙋♂️ Remember to follow me so you don't miss my future analyses
⚠️ Disclaimer: This post is for informational purposes only and does not constitute financial advice. Always do your research before making investment decisions.
FX:USDMXN FOREXCOM:USDMXN SAXO:USDMXN CAPITALCOM:USDMXN OANDA:USDMXN ACTIVTRADES:USDMXN SKILLING:USDMXN EASYMARKETS:USDMXN PEPPERSTONE:USDMXN
USD/MXN Downtrend Probing Support AgainTechnical outlook:
Trend: The pair remains locked in a downward channel since late April, with price respecting both the upper and lower boundaries. This confirms a well-defined bearish structure.
Resistance: The upper channel line and the 50-day SMA (18.75) converge as a strong cap. Above that, the 19.07–19.49 zone is the next resistance cluster.
Support: Immediate support lies near 18.58, followed by the lower channel boundary toward the 18.20–18.00 area if pressure persists.
Momentum: RSI sits just below neutral (47), not showing strong conviction yet. MACD remains in negative territory, keeping bearish momentum intact.
Moving averages: Price is still well below the 200-day SMA (19.74), reinforcing the dominant downside bias.
What this means:
USD/MXN remains under selling pressure, with rallies repeatedly capped by the channel top. Unless price breaks above the 18.75/19.00 area, the path of least resistance points lower toward 18.20. A confirmed breakout above the descending channel, however, would suggest the start of a corrective rebound.
This remains a bearish channel play, but traders should watch the interaction with the channel top closely, as a breakout could shift short-term momentum.
-MW

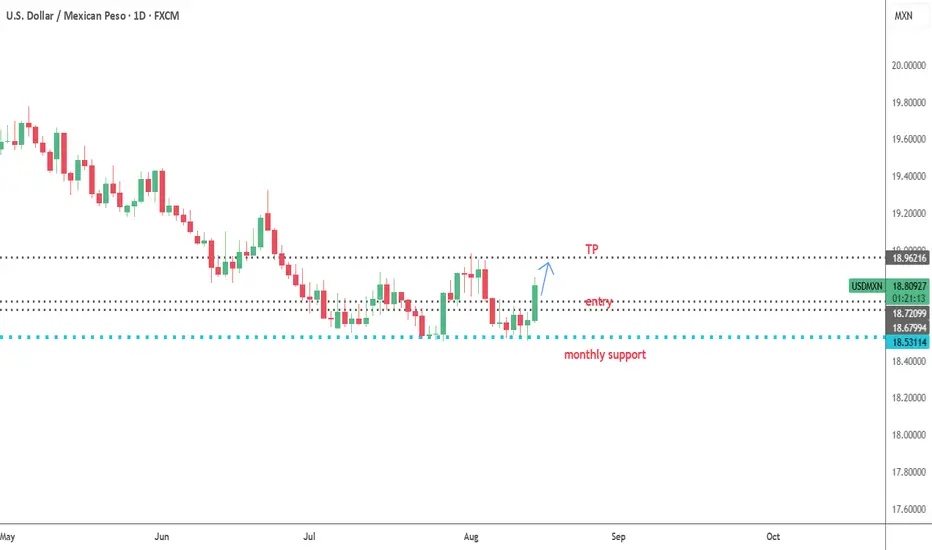
USDMXN--LONG--strong upward reaction at the long term monthly support
-entry, TP levels are as shown on chart
USD PESO- Support, Fib and other reasons LONGHello fellow traders!
Good news! good NEWS GOOOOOOD News for USA! here is the idea- support holding hence going for the 19.10-19.11 level of resistance Aldo the drop of the price seen well on a weekly/monthly chart hit the 0.5 fibs normally being reaction level and with a new trades and America is great again - my position, but please don't copy only if you made your own mind- this is just an idea not a trading advise! And when trading- have a s/l that won't blow your account, good luck!

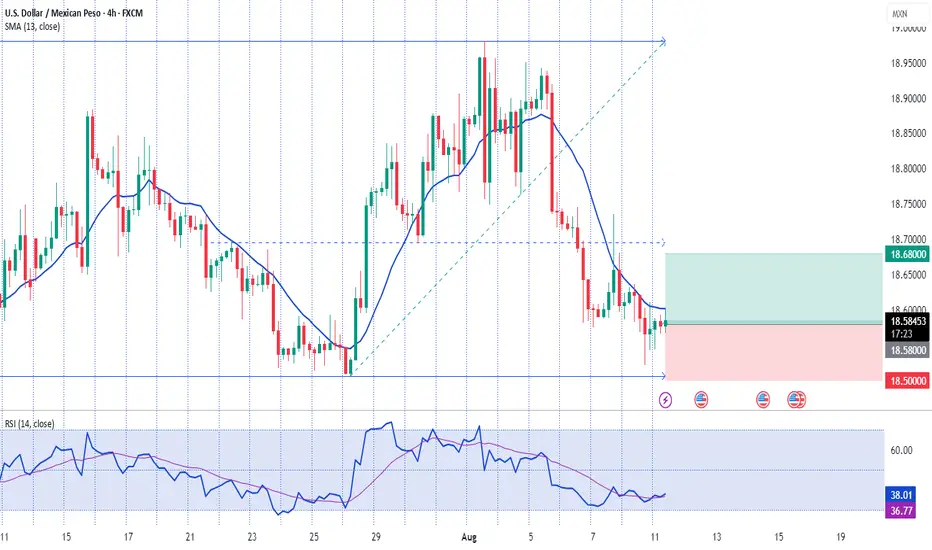
USD/MXN Defends Rebound from July LowUSD/MXN seems to be defending the rebound from the July low (18.5116) as it attempts to retrace the decline from earlier this week.
A breach above 18.7780 (50% Fibonacci retracement) may push USD/MXN toward the monthly high (18.9810), with a move/close above 19.3720 (38.2% Fibonacci retracement) opening up the June high (19.4441).
Next area of interest comes in around 19.6280 (23.6% Fibonacci extension), but USD/MXN may struggle to retain the rebound from the July low (18.5116) should it track the negative slope in the 50-Day SMA (18.8511).
A move/close below the 18.5090 (23.6% Fibonacci retracement) to 18.6330 (50% Fibonacci retracement) zone brings the August 2024 low (18.4291) on the radar, with the next area of interest coming in around 18.1840 (61.8% Fibonacci retracement).
--- Written by David Song, Senior Strategist at FOREX.com
USD/MXN: The Mexican Peso Starts a New Bullish Bias During the latest trading session, the Mexican peso has started to appreciate by nearly 1%, supported by short-term weakness in the U.S. dollar. For now, bearish pressure has begun to dominate the pair, mainly because the dollar is under pressure following signs that the Federal Reserve may consider cutting interest rates after the slowdown in U.S. job growth. The renewed weakness in the U.S. dollar has allowed the Mexican peso to steadily gain ground, and as this dynamic continues, selling pressure may become increasingly relevant in the short term.
Sideways Range Holds:
Recent price fluctuations over the past few weeks have begun to form a steady sideways range, with resistance near the 19.00 pesos per dollar level and support around 18.50 pesos per dollar. So far, recent moves have been insufficient to break out of this lateral formation, which remains the most relevant pattern to monitor for upcoming sessions. As long as price continues to fluctuate within this range, the lack of clear direction may dominate the market in the coming days.
RSI:
The RSI indicator line continues to hover near the 50 level, signaling that neutral momentum between buying and selling pressure is prevailing in the short term. As long as this behavior persists, indecision may continue to dominate price action.
MACD:
The MACD histogram has also started to slowly descend toward the zero line, suggesting that a new bearish slope may be forming. This points to weakening momentum between the moving averages. If the MACD continues to show signs of losing strength, sideways consolidation could remain the dominant structure.
Key Levels to Watch:
19.35 pesos per dollar: Key resistance aligned with the 50-period moving average. Sustained buying above this level could trigger a meaningful bullish trend in upcoming sessions.
19.00 pesos per dollar: Nearby resistance that marks the top of the short-term sideways channel. A breakout above this psychological level could reinforce bullish momentum.
18.50 pesos per dollar: Critical support marking recent multi-week lows. A break below this level could resume the broader bearish trend seen in previous weeks.
Written by Julian Pineda, CFA – Market Analyst

USD/MXN Bounces Back Ahead of August 2024 LowUSD/MXN appears to be bouncing back ahead of the August 2024 low (18.4291) as it extends the advance from the July low (18.5116), with the exchange rate trading above the 50-Day SMA (18.8993) for the first time since April.
USD/MXN trades to a fresh weekly high (18.9810) following the failed attempt to push below the 18.5090 (23.6% Fibonacci retracement) to 18.6330 (50% Fibonacci retracement) zone, with a move above 19.3720 (38.2% Fibonacci retracement) bringing the June high (19.4441) on the radar.
A move/close above 19.6280 (23.6% Fibonacci extension) opens up the May high (19.7820), but lack of momentum to hold above 18.7780 (50% Fibonacci retracement) may push USD/MXN back toward the July low (18.5116).
--- Written by David Song, Senior Strategist at FOREX.com

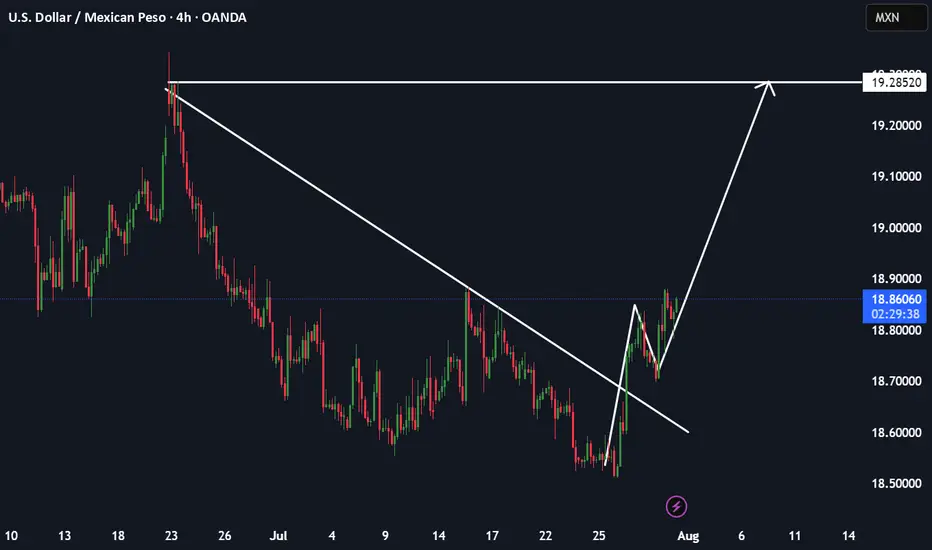
USDMXN longAs DXY looks bullish, this pair is clearly showing signs of a bullish trend. As we can see, there is a breakout and retest. I expect it to reach 19.30 (next resistance).
Mexico in a weaker bargaining power over USAI could be wrong but I think Mexico has a weaker bargaining power over US in the tariffs matter. As such, I would expect its currency to weaken against the USD sooner/faster than the Canadian dollars.
Day chart shows 20.83 resistance level - if this cannot be break up, then I expect it to falter and get shot down fairly soon.
Please DYODD
