$USDT Dominance Is it really different this time?CRYPTOCAP:USDT has broken a major resistance across multiple timeframes, showing clear strength.
Technically, this is not a positive sign for CRYPTOCAP:BTC and other altcoins.
Tether has been in an uptrend for the last 75 days. A reversal could be around the corner in Q1 2025, but for now, the structure does not favour the bulls.
This is not FUD; it's simply clear observations based on the chart.
There has been no major altcoin season this year. Every KOL, including myself, has been wrong in calling an altseason so far.
Is it really different this time?
Only time will tell.
Do share your views in the comments and hit the like button if you like it.
Thank you
#PEACE
Market insights

USDT.D(based on NEowave)patterns of eth and btc is changed.
crypto market will start a bullish wave soon.

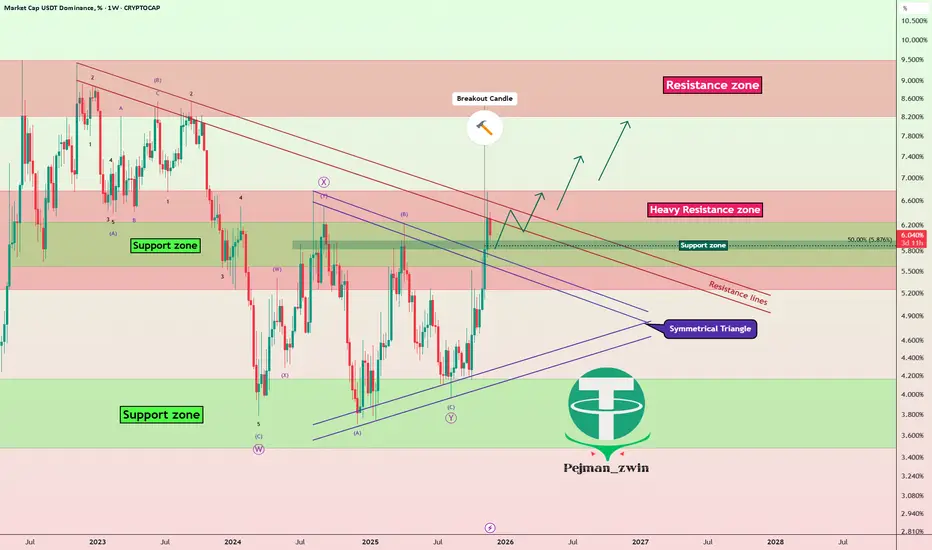
USDT Dominance% Breakout: Crypto Correction Not Over?Today, I’m going to analyze Market Cap USDT Dominance%( CRYPTOCAP:USDT.D ) on the weekly timeframe for you. The reason I want to analyze USDT.D% is that the crypto market conditions have become a bit complex lately, and many factors are influencing it. Therefore, it’s better to take a look at the weekly chart of USDT.D%.
Currently, it seems that USDT.D% is in the vicinity of a Heavy Resistance zone(6.78%-5.25%), but at the same time, there’s also a Support zone(6.24%-5.57%) that could potentially lead to an increase in USDT.D%.
From a classical technical analysis perspective, we can clearly see on the weekly chart that the upper lines of the symmetrical triangle have been broken, and it seems that USDT.D% is currently pulling back to those upper lines. As long as it doesn’t move below those lines again, we can still expect that the market correction is ongoing and hasn’t ended yet. This is a sign that helps us gauge whether the crypto market correction is complete or still ongoing.
From an Elliott Wave perspective, with the breakout of the symmetrical triangle, it seems that USDT.D% might be starting a new impulsive wave.
Since we’re not seeing Regular Divergence(RD-) at the highs, it indicates that the recent upward movement in the crypto market, especially Bitcoin’s( BINANCE:BTCUSDT ) recent gains, is still part of the correction phase.
In conclusion, based on the above analysis, I expect USDT.D% to rise again. If USDT.D% breaks through the resistance lines, we can hope that it will also break through the Heavy Resistance zone(6.78%-5.25%), and that would be a negative sign for the crypto market, potentially leading to deeper corrections in the coming weeks.
So, what do you think? Do you believe the crypto market correction is over, or do you think it will continue? That’s a nice question to leave our analysis with.
Stop Loss(SL): 5.49%
💡 Please respect each other's opinions and express agreement or disagreement politely.
📌Market Cap USDT Dominance% Analyze (USDT.D%), Weekly time frame.
🛑 Always set a Stop Loss(SL) for every position you open.
✅ This is just my idea; I’d love to see your thoughts too!
🔥 If you find it helpful, please BOOST this post and share it with your friends.
USDT DOMINANCE Update (4H)This analysis is an update to the previous one, which you can find in the related analyses section.
Considering that trading volume in the crypto market has decreased and the volatility of large-cap coins has slowed, analyses now require more time to play out.
We still believe that Tether dominance will experience a drop; however, the supply orders from the previous analysis have been consumed. The correct zone for orders is marked by the red box.
It is expected that after hitting the identified supply zone, the price will move toward the targets marked on the chart and drop.
Let’s see what happens.
For risk management, please don't forget stop loss and capital management
When we reach the first target, save some profit and then change the stop to entry
Comment if you have any questions
Thank You

USDT.D Signalling Crypto Crash Zone & Bear Market Revisiting this study again that I originally shared months ago as a possible 'path' to either the new ATH targets and/or the Crypto Crash & Bear Market zones...
We can see the the Blue bars from the last cycle are an important fractal to follow.
USDT.D (Tether Dominance) clearly shows the inverse relationship it has with Bitcion and TOTAL market cap, which I have hidden here.
But the Yellow line is the midpoint and can be considered the 'Mean' in the 'reversion to the mean' equation.
At the lows of the USDT.D multi-year trendline going back to 2018, when touch the trendline, crypto is rallying and hitting all time highs.
In contract, when USDT.D is pushing higher (Money flowing into Stablecoins) we see markets correcting and crashing.
I've labeled the corresponding areas, which we can see that USDT.D is now forming support above the 6.5% prior resistance, indicating a deeper crash is likely coming.
Tomorrow is a Triple Witching expiration, so expect volatility.
However, in the past these usually mark reversal points in the markets.
So we'll have to watch and see...
However, most other technical signals are flagging bearish like the Monthly MACD and mult-month Bearish Divergences on the RSI, MFI, and Stoch/RSI
Good time to be out of the markets IMO until this clarifies.
Even if we get a 'Santa Rally' I'll be selling into it, b/c the USDT.D has plenty of room to run to the upside... And we're unlikely to see liquidity return to the markets without more interest rate cuts, QE, and money printing.
All eyes are on Japan's Fed Rate meeting tomorrow, where there's rumored to be a .25 rate HIKE which also has the markets on edge.

USDT.DI think Tether's dominance in wave G has completed itself, and I expect a correction for wave F. I don't see any more momentum or strength in the uptrend, so a decline is reasonable.

USDT Dominance (4H) Update. 📊 USDT Dominance (4H) Update.
Current Zone: ~6.30%
Key Resistance: 6.55% – 6.65%
Price is moving inside a descending channel, now reacting near the upper trendline.
Rejection from resistance ➝ USDT.D likely drops → Bullish for crypto / altcoins
Clean breakout & hold above 6.65% ➝ USDT.D strength → Risk-off / downside pressure on alts
At resistance + trendline = decision zone.
Wait for clear rejection or breakout confirmation.
⚠️ Manage risk. No prediction — only reaction.

End of Trend USDT.DUSDT.D’s rise is nearing its end. This pattern helped me stay out of the market even before October 10. Now I’m seeing similarities that suggest this move is ending — capitulation and fear usually last 2–3 months, and we’ve gotten that. Real capitulation always happens in November–December.

USDT. D MARKET ANALYSISAfter an impulsive move its being held around the resistance level, a break above this level we would mean continuation of the downtrend of the altcoins and a successive breakdown to fill the inefficient market to the demand zone would mean a partial pullback of the altcoins.

USDT.D (-)Given the breakdown below the channel's support, the pullback to that support level, and the appearance of a shooting star candlestick on the crucial 4-hour timeframe, a decline toward one of the specified target areas is expected.

USDT dominance should drop Usdt dominance drop will lead to crypto rise
The suppression in crypto will end soon.
The rise of crypto will start soon.
This usdt dom. Should drop in coming weeks/months.

Tether Atom Bomb Gives Rise to Rainbow StablecoinWill crypto see a bull market continuation for the first time in history?
Or are we witnessing a typical market cycle that leads to the end game?
Follow me on X @BLUVNBU

Stable coin dominance leaving accumulation range. Crypto doomed?Stable coin dominance appears to be towards the end of an accumulation range. This could prove to be a signal that CRYPTOCAP:BTC CRYPTOCAP:ETH and other cryptocurrencies are about to fall even more.
Alternatively, there's a scenario where we could say this is a re-distribution area. I'll post that one below.
So what to expect? Well... if we follow the PA as projected on this chart above, it's bearish for crypto. If we follow PA that resembles the prediction on the chart below, then it would be bullish for crypto.
Best thing would be to wait on the sideline to wait for some confirmation.

USDT dominance (USDT.D) USDT dominance (USDT.D) remains elevated and is in a major uptrend, indicating that a significant portion of crypto capital is still parked in stablecoins and in a risk-off position.
Current Structure:
USDT.D is around 5-6%, having broken above a long-term descending trendline that had capped dominance since 2022. This is typically a cautionary signal for risk assets when it remains above that breakout level.
From a technical perspective, USDT.D still appears to be in a large corrective pattern, with significant downside support around 4.2% and 3.8%; losing those levels would confirm a new downtrend in dominance and is usually accompanied by a strong rally in BTC and altcoins.
DYOR | NFA,

USDT.D SMT DIVERGENCE WITH TOTALThis points to a new smart money and institutional trend change, coursing through this month to the end of the first half of 2026!
Looking at the crypto market, especially altcoins, now reversing bullishly during this 5-6 months window, before the bear market starts gearing up…going into the second half of 2026!
And trust me smt divergence will signal it again ! ! !
#Crypto #BC400 #BTC

OptimisticChats tells us all roads point towards the bottom .
imo the whole market seems overly bearish.
Beating down.
Towels have been thrown in.
This also correlates with the R2K breaking out.

UPDATE ABOUT USDT.DOn the weekly timeframe, USDT dominance is approaching an important static support level. If this zone breaks, it could trigger another bullish leg in dominance, pushing the index toward the next marked levels.
Such a move could align with Bitcoin dropping toward the 75K zone.

No alt seasonThere’s no alt season here.
Seems to keep riding the ceiling in over brought Territory.
Eventually you would think this would breakdown.
I know it sucks no one wants to wait another year but that’s just seems to be where we at in the market here.

Tether Dominance Tether dominance (`USDT.D`) has been correcting in a Wave 4 pattern, and after a period of sideways movement, it appears to be preparing for the commencement of Wave 5. In this scenario, `USDT.D` may initially retrace to the 5.78 level, which could trigger a short-term upward movement in the broader crypto market. Subsequently, Tether dominance is highly likely to ascend to the 7.77 level. During this potential Wave 5, Bitcoin could potentially reach the $70,000 mark. Finally, a possible correction for `USDT.D` down to 6.74 might occur, followed by a prolonged period of consolidation within that range.
Trading Recommendation: It is advisable to look for suitable short positions at price peaks during bullish rallies. Avoid entering long positions until significant support levels for Tether dominance are firmly established.

Bull or Bear ?Trading Plan – USDT.D (Market Cap Dominance)
We are in a corrective phase forming a potential AB=CD pattern. Price is approaching a key reaction zone.
If USDT.D breaks lower from this area, it confirms risk-on sentiment → bullish continuation for crypto (bull run).
If USDT.D moves higher and holds above resistance, correction extends → bearish pressure on crypto begins.

Critical USDT.D Test: Altcoin Relief or More Pain?USDT dominance is pushing into its long-term trendline resistance again. If this level rejects, it usually signals fresh money rotating back into altcoins.
But if USDT.D breaks out and holds above the trendline, it could put pressure on alts and slow down their momentum.
This is a key spot for the altcoin market.
DYOR, NFA
Please hit the like button if you like it, and share your views in the comments section.

USDT DOMINANCE ANALYSIS (2D)Hello.
I'd like to share my ideas about USDT Dominance today.
When I start to analyze a chart, the first thing I do is look at past events and patterns.
As I can see, around August 2025, USDT completed its double zig-zag corrective move.
Now we're seeing that the entire market is bleeding, and of course this parameter is also moving in the opposite direction of the market.
Due to its nature, it's easy to analyze the entire market by looking at this parameter alone.
We realize that after the first change of character around the market, this parameter began forming a five-wave impulsive movement. October 10th also confirms this idea in a way.
As anyone who knows about Elliott Theory understands, there are many possibilities when a sudden crash appears in the market. That's the reason why I waited patiently to update my thoughts on this chart.
At the moment, I'm almost sure that what we're seeing here is another five-wave impulsive upward pattern.
The good news is that we are about to see this bleeding in the market come to an end.
The reason is simple: volume.
As you can examine on the chart, volume has been decreasing for days now.
Even if it's not the end of wave 5 yet, we are going to see this parameter drop significantly in the coming weeks — possibly with an A-B-C zig-zag or a double zig-zag pattern.
The orange line on the chart represents an ascending channel. When it breaks, it will also confirm a change of character in the entire market. What I expect is that when this happens, we’ll most likely see a drop of around -20% in this parameter. This will allow the market to recover from its ashes once more.
Thanks for reading.

USDT. D Moving pattern Prediction .As you See On the chart , USDT.D has bearish move for short term . the target can be 5.5 or 5 % approximately . Then we will going up and Crashing BTC will comes.
