usdt.dFriends, if we want to analyze domain Tether divergence in the daily time frame, we have a descending divergence in the ceiling.
USDT.D trade ideas
#USDT.D 6H Chart
USDT dominance liquidated the support line after getting rejected off the 6h supply around 7%. We may see it trade deeper into this demand zone before expecting higher pricing from there towards the resistance around 7.28%.

USDT.D ANALYSIS (4H)Hi, dear traders. how are you ? Today we have a viewpoint to BUY/SELL the USDT.D symbol.
For risk management, please don't forget stop loss and capital management
When we reach the first target, save some profit and then change the stop to entry
Comment if you have any questions
Thank You

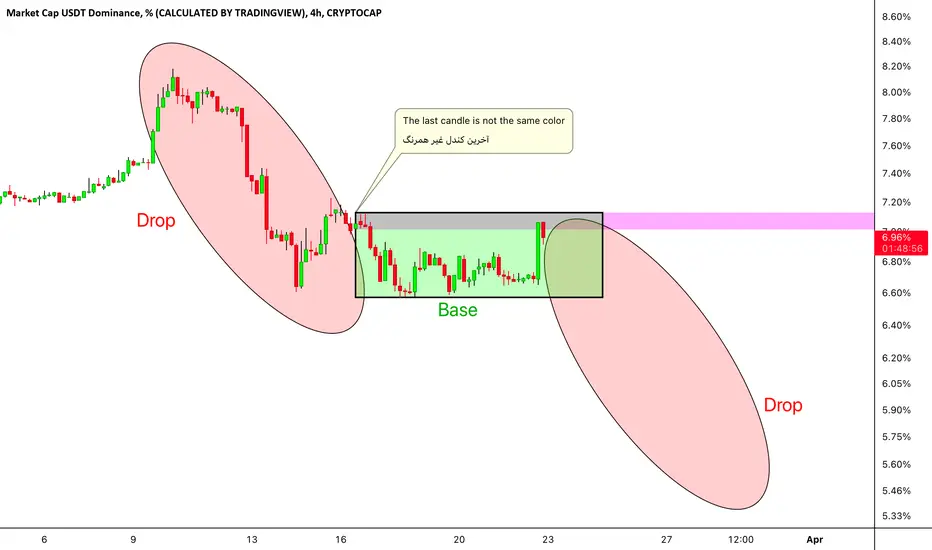
Drop-Base-DropExisting resistance: A fog box drawn on the basis of the last non-same color candle is an important resistance and makes the falling pattern complete.
#USDT.D 6H Chart
USDT dominance moved up and it is currently testing a minor 6h supply zone. Overall, i still expect it to move up towards the 4h supply around 7.8% before continuing the overall bearish movements.

USDT DOMINANCE UPDATEBe careful, guys. The market may show some correction as the USDT dominance is bouncing back.
My apologies for not posting any updates for the last few days. I am trying to keep up with my health.
Trade safely.

USDT W1 RISING WEDGELooks like we may see USDT at 4% again in the near future. Targest are 4.0% from wick measurements and 4.69% from candle body measurements.

USDT.D by giving itself a share to the market. It will give BTCThere is a Fed meeting tomorrow, although there will be a green atmosphere in the markets. For this breakdown to come, tomorrow must move in the direction of our expectations. If the Fed passes the rate hike or approves the soft transition, spring will continue in green. It should not be forgotten that we still support you in possible situations. Therefore, it will be much more accurate to take a position after the breakdown.

Tether Dominance - showing signs of pivotal movementUSDT Dominance is currently at a level of strong longer term trend SUPPORT (i.e. market resistance level).
Red circles represent contact with the current trend support which signals the selling of USDT (i.e. buys in the crypto market), with a current double bottom shown.
Green circles represent the current trend resistance hits and USDT sell-offs (crypto market rallies).
With the FOMC meeting starting today and concluding tomorrow, FED announcements will dictate "loss of this support" (market rally) or a "Bounce at support" (market sell-off).

#USDT.D 6H Chart
USDT dominance is ranging between the daily demand at 6.6% and the resistance line. It needs to reclaim 7% in order to expect bullish movements else i would be expecting a continuation of the bearish movements from there.

📈 Tether Dominance Monthly, First Time Ever! (4.10% Next)This is the first time ever we look at Tether Dominance on the monthly timeframe.
This is extreme bearishness what I am seeing here.
Let's start at the end, the stage is set for a drop to 4.10% minimum, that's the conclusion.
I mentioned that this would translate to Bitcoin at around ~$40,000.
Notice the "~" symbol, which means more or less as it should range between $38,000 and $42,000 when the time comes, which is soon.
USDT.D already printed an upper wick and trading near the low of the current session/candle.
The current candle trades below EMA10 on a very, very strong bearish bias.
✔️We have a massive rising wedge that already broke bearish.
✔️We have lower highs long-term (more than 6 months).
✔️And volume going lower and lower.
The volume will only increase again when the major drop comes.
As USDT.D goes down, Bitcoin and the Altcoins goes up.
✔️ Please make sure to Boost to help with your support.
Thank you for reading.
Namaste.

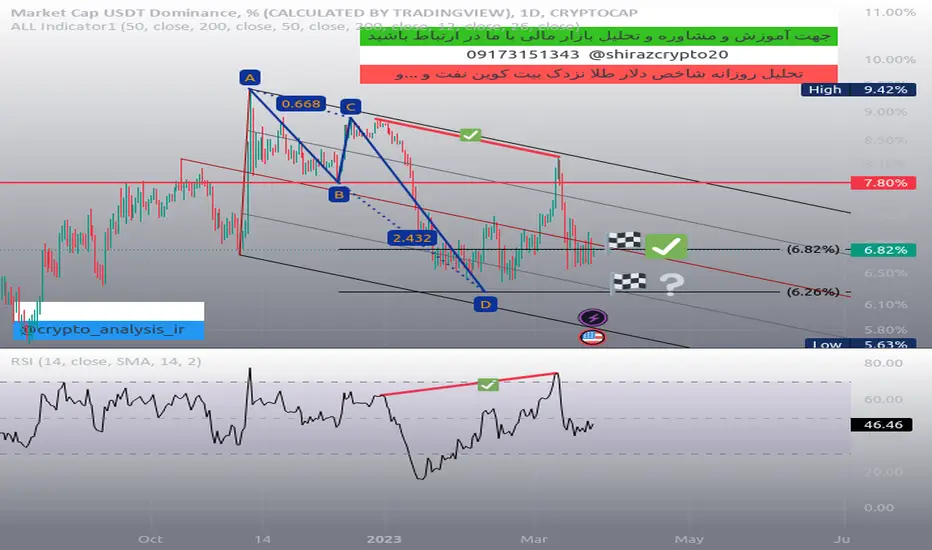
usdt.DTechnical analysis of Domain Tether:
The possible target is determined based on the harmonic pattern.
Good luck.
Karim Heydari

USDT.D market cap, which way?The price is still in channel if you consider the candlestick the price shown that usdt will go down but overall we have to wait for both side confirmation.

ALT SEASON APPROACHETH Potential Inverse ADAM and EVE coupled with bearish divergence looking to bode well for alts once we play below the neckline of the pattern.

USDTReady for fly with crypto market and gain profit? I have hope to decrease USDT and Increase Total

📈 Tether Dominance Long-Term Bearish Trend ConfirmedLast week closed as an inverted hammer and this was the "last hooray".
EMA50 still stands as support but we have multiple lower highs since June 2022.
The weekly MACD just entered the bearish zone:
The weekly RSI is also showing a strong bearish bias:
All the USDT (Tether) will be used to buy Bitcoin and Altcoins.
Here we can see clearly on the daily timeframe how MA200 has been lost as support:
Below this level Tether Dominance is always bearish.
Notice bear volume being at its highest since November 2022 when USDT.D started to decline.
The next drop will send USDT.D to around 4.81%, a major drop.
This is the level it traded at around April 2022, this would mean Bitcoin trading at about $40,000.
There is strong support at this level just as Bitcoin will face strong resistance at $40k.
Everything is pointing in the same direction... Bitcoin will grow like the world is ending... But the world isn't ending, it is just the end of an era where a new financial system will emerge.
✔️ Bitcoin is the future of money.
✔️ Cryptocurrency is the future money.
✔️ Bitcoin is the present of money.
✔️ Bitcoin is very likely to save us from another 2008.
Namaste.

#USDT.D 6H Chart
USDT dominance is currently retesting the 6h breaker zone after it bounced off the minor 2h demand at 6.7%. Overall, i still expect it to move up aiming towards the resistance around 7.3% before continuing its overall bearish movements.


USDT DOMINANCE MADE A RISING WEDGE PATTERN!!Hi guys, This is CryptoMojo, One of the most active trading view authors and fastest-growing communities.
Consider following me for the latest updates and Long /Short calls on almost every exchange.
I post short mid and long-term trade setups too.
Let’s get to the chart!
I have tried my best to bring the best possible outcome to this chart, Do not consider financial advice.
#USDT DOMINANCE UPDATE
USDT DOMINANCE made this rising wedge pattern in the daily time frame and currently looks like it's retesting it.
if it retests it successfully then we can expect a good bounce in alts it also indicting towards the Bullrun.
This chart is likely to help you make better trade decisions if it does consider upvoting it.
I would also love to know your charts and views in the comment section.
Thank you

📈 Cryptocurrency Under Attack, More Problems AheadWell my friends, it seems the Cryptocurrency market is under attack from all fronts, and endless battle it seems.
Now the Stablecoins are under attack and it seems they are going to fight Tether (USDT), next.
I just saw this piece of news article, it links Russia to Tether and that's how it all starts: www.tradingview.com
It says the Russian are using USDT, they will surely use this as an excuse to start some sort of banning which will end up affecting everyone... Or maybe not but that's how it always start.
We've been bearish on USDT.D for a long time as the chart shows but that's because people use Tether to buy Altcoins and Bitcoin , not due to this type of situation.
If there is an attack on Tether, another one, let's just hope it is something that doesn't bring down the market as whole.
Cryptocurrency is under attack from all fronts and it is technology that is only helping people, it is a technology for peace, innovation and exchanging value.
A means of payment like cash, gold, credit, wires and so on.
Stay safe.
Trade Bitcoin.
Namaste.

#USDT.D 6H Chart
USDT dominance retested the 6h breaker zone where it bounced from. It needs to reclaim 7.3% in order to aim for further bullish movements.

USDT.DDominance Tether moved in the daily time frame according to the expected scenario and reached an important range and was rejected from it, although it was expected that after reaching the daily range in the lower time frames, it would have a correction, which Mr. Pavel Vou bankrupted several banks. American Momentum increased this failure to reach the current range and important support of Bitcoin, which we will discuss in the next analysis. In the current situation, according to the important resistance that we are facing, the possibility of correction in Dominance Tether and the relative growth of the market is more than the continuation of the fall, unless this trend line is also broken and Bitcoin goes to new floors.

USDT.DAs mentioned in the previous analysis, Dominance Tether also reached the support range as expected and we saw growth in the market as a whole, but we are still involved in a very strong range of 6.5 to 7.3% in Dominance Tether, which is more likely to break out of the bottom with time correction. Which will naturally lead to breaking the ceiling of 26000 in Bitcoin and moving towards higher goals. In the meantime, with this index suffering at the bottom and ceiling of this range and even retesting the downward trend line according to the Bitcoin Dominance analysis, we can correct the price of altcoins and suffer or correct the price of Bitcoin.
