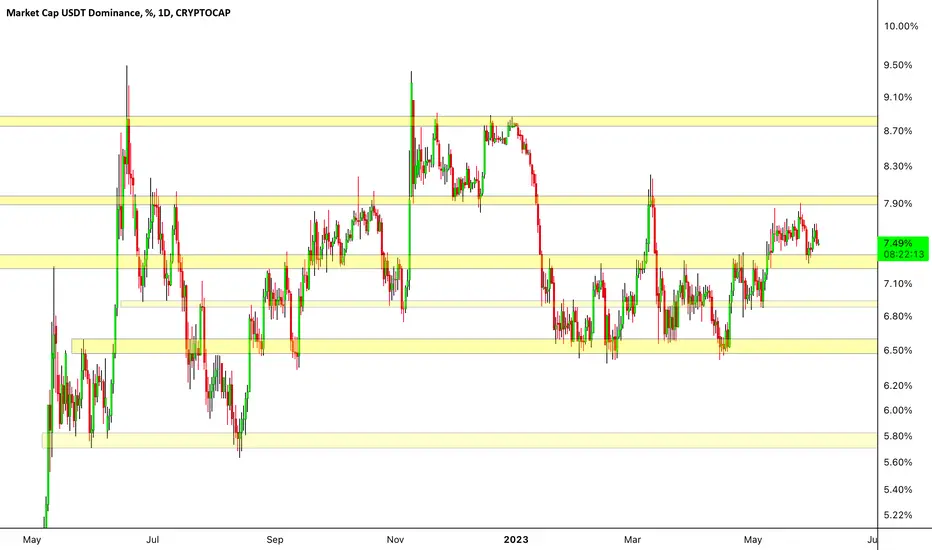
USDT MARKET CAP DOMINANCE As you can see, the price has reacted well to the floor, ceiling and midline of the channel. Even in lower time frames, for example four hours, it is well visible. This analysis can be very effective for predicting the future of Bitcoin and the cryptocurrency market
USDT.D trade ideas

I see that Dominance Tether will continue to rise to 8.23%As for Dominance Tether, my view is that it will continue to rise to 8.23% levels, and then it will start to rebound. The increase in demand is an early movement by whales to motivate buying, or it is a new trap.

USDT.D:precisely because of the dominance of Sarkarim Teter, open shorts after 7.93 position, there is nothing special for long

USDT.D & BTCI think the market will react like this. But as always, I say get confirmation from the candles 💬
Naturally, when the candles hit this area, we will see the opposite reaction. As usual, Bitcoin and Dominance Tether are also inverted.
My style of analysis is completely personal.

Tether Dominance Aanalysis (6H)Many liquidity pools are flowed by whales and the trajectory is difficult to predict. Examining the zones, I think we can move on the picture like this and once Tether Dominance reaches level 8 and breaks down, altcoins will have a good run.

Winning or losing a trade depends on your state of mind (2)Hello?
Traders, welcome.
If you "Follow", you can always get new information quickly.
Please also click "Boost".
Have a good day.
-------------------------------------
(USDT chart)
Looking at the 1D chart, you can see that after a short but long uptrend, it recorded a pullback, creating the first gap.
In the meantime, the HA-High indicator on the 1D chart rose and was created.
Accordingly, it is necessary to ensure that funds are maintained at 81.839B or higher.
Falling while creating a gap means that funds were outflowed through USDT, so we need to check the future situation.
----------------------------------------
(USDC chart)
USDC is currently in a downtrend.
Therefore, it is necessary to check whether the trend turns upside down.
If not, and if it continues to show a downward trend, the coin market will not be able to maintain its upward trend and will likely fall sharply.
Currently, it is judged that the funds that have flowed into the coin market through USDT are defending the price, but if USDT shows a decline, it is necessary to be careful because the withdrawal of funds from the coin market can occur quickly.
The first thing to check is to see if USDC holds above the HA-Low indicator on the 1D chart.
------------------------------------------------
(BTC.D chart)
BTC dominance is good to look at to see if funds are concentrated towards BTC or towards altcoins.
This is because any other method of interpretation will rather complicate your thinking.
-------------------------------------------------
(USDT.D chart)
An increase in USDT dominance can be interpreted as a high possibility of a downward trend in the coin market.
Therefore, it is highly likely that BTC, the number one coin market by market cap, will show a downward trend.
The reason is that when trading on coin exchanges, the USDT market is as large as the BTC market.
Because various coins (tokens) can be directly traded with USDT, changes in USDT dominance can be interpreted as reflecting the overall trend of the coin market.
Therefore, support and resistance points formed on the USDT dominance chart cannot be used to directly trade coins (tokens).
However, since you can know the flow of money in the coin market, you will eventually be able to see the chart of the coin (token) you want to trade and use it as a reference for creating a trading strategy.
This is because you can figure out whether the flow of funds is moving toward buying or selling, so you can find the timing of your trade accordingly.
--------------------------------------------------
Following the DXY chart description, the same explanation is given to the USDT Dominance chart.
If you think these two explanations are different, we recommend that you read them several times in more detail.
The fact that your psychological state is starting to fluctuate due to price fluctuations means that the flow of funds is changing.
That's why, without knowing it, your own psychology starts to fluctuate.
In order to stabilize this psychological state, it can be stabilized through appropriate transactions.
Therefore, if you hold a coin (token), you can get some psychological stability by checking the movement at the support and resistance point and confirming the profit or loss by selling a certain amount.
If you do not own any coins (tokens), you can take your own psychological stability by purchasing a certain amount.
In order to trade, you must make your psychological state stable.
If you proceed with a transaction without achieving this, there is a very high possibility that the transaction will eventually fail.
-------------------------------------------------- -------------------------------------------
** All descriptions are for reference only and do not guarantee profit or loss in investment.
** Even if you know other people's know-how, it takes a considerable period of time to make it your own.
** This is a chart created with my know-how.
---------------------------------

usdt dominance can still increase!i think tomorrow usdt dominance will pullback and again keep going to touch 8.27%

USSDTThis is my opinion with technical analysis
Please respect the following rules:
1- Risk management .
2. Have your own strategy.

USDT.DFrom the general view of the chart, we find that it was based on a strong support that was retested three times and launched now. It is possible for this analysis to be achieved.
Let's see what will happen

USDT.DUsdt dominance looking bearish on 4H bias
we may see an increase in ALTS soon
as we have a potential retrace level highlighted in yellow
meanwhile the HTF trend is bearish aswell ...
DYOR

Elliot Wave on USDT.DHere we can see some indications, starting from:
1. Forming Manipulation
2. Elliott Wave
3. Engulfing Candle Patterns

Let's amplify this a little bit.We have a serious bid on weekly USDT dominance chart.
It's just getting started. We have a whole summer ahead of us.

USDT.DI think we will see this soon and crypto market wil start an up trend. so make yourself ready for buying if the weekly candle is strong.

TETHER DOMINANCE brief gain 💣🚀Hello 🐋
Based on the chart, the price is close to the support area and parallel channel support ✔️👌
if
the price doesn't break the support zone to the downside, we will see brief gain again 💣🚀
and
in long time more correction expected 💣🚀💣
👌 Notice: pay attention to the price on shortcut chart (located above the main chart with black colour) 📖💡
Please, feel free to share your point of view, write it in the comments below, thanks 🐋

Oh NO NO NO NOOOOOO🟥I do not want to explain nothing just look at what chart is showing. please be careful and empty your bags.
Arshia Darvish

USDT.DFor now, he can go to rest, then start with 7.65, open a short position for a long risk below 7.62.

BTC.D USDT.D & OTHERS.DUSDT.D rising.
Others.D and BTC.D could follow same trend as "Alt Bubble"
- This could signify BTC bottom in the future.


Analysis of Tether dominance and Cryptocurrency marketAnalysis of Tether dominance and digital currency market
Dominance Tether started its upward trend and growth with a slope of 22 degrees and has grown nearly 23% since 47 days ago, and now it is moving from the bottom of its ascending channel to the resistance of the midline of the ascending channel.
This 3.5% movement can lead to the fall of digital currencies (at least 34%).
If the midline resistance is broken, growth up to 4.5% to 9% can be considered (and at least the same amount of decline in the Cryptocurrency market).

One last waveIt is possible that the acquisition is going up in a final strong fifth wave, so let's see what happens

USDT.DBelow 7.48, you can go to open a long position, the confirmation of point 7.35 gives a safer position, but it does not give confirmation for the short position at the moment.

USDT.D GAINING STRENGTH
price has broken the 56 days rang and is on a correction now therefore, we have to look for the trigger to long USDT.D at PRZS
