USDT.D - Breakout in play
The triangle that began in mid 2022 seems to be finished, and a breakout to the upside is in play.
If we get a follow-through, the first target is the purple line (wave B pivot).
I'm favoring short trades in crypto for now.
USDT.D trade ideas

Doninance of USDT bearish signals! Bearish signals are appearing in the UDSDT dominance chart! Take in consideration that this chart is opposed to the BTC dominance, so it's a bullish signal for the BTC price action!

USDT DominanceThe price of Bitcoin has now reached a key support
+
The position of the USDT.D is at the highest level
=
Hysterical BUY

USDT DOMINANCE UPDATE YOU CANNOT MISS.Greetings, fellow traders,
I'd like to present a significant update regarding USDT dominance within a 2-day timeframe.
Recently, USDT.D has been exhibiting an upward trend, nearing the white resistance trendline at 9.5%. This development could potentially trigger concerns within the cryptocurrency market, affecting both BTC and other altcoins. It's worth noting that this particular resistance trendline has previously rejected USDT.D on three occasions.
Furthermore, there's a yellow dotted trendline where the dominance is encountering resistance. While the weekly trendlines appear somewhat distant, an intriguing observation arises.
USDT.D has the potential to reach 9.5%, which represents an increase of approximately 16% from its current level. However, a deeper analysis of the weekly trendline reveals that USDT dominance has been on a downward trajectory since June 2022, failing to reach the weekly support trendline during this period. Consequently, there remains a possibility that the current level may serve as a point of rejection rather than a sustained rally.
Key Points to Consider:
1. A modest resistance level at 8.2% exists, and a rejection is conceivable.
2. A formidable resistance barrier is situated at 9.5%.
3. The RSI indicator has already entered the overbought zone.
I trust you find this update valuable, and I extend my gratitude for your readership.
Trade with prudence and take care.
Best regards,
Team Dexter

#USDT DOMINANCE ANALYSISUSDT.D is moving in a symmetrical triangle. Currently, it is rejecting from the resistance trendline. RSI is in the overbought region.
A rejection from this point could lead to further consolidation within the triangle pattern. Conversely, a strong breakout would serve as a bullish confirmation. It's important to note that it works inversely proportional to the crypto market.

#Tether Update. Don't miss this!!🚀 Exciting #USDT Update 📈
📊 #Tether chart is displaying a significant development that's catching our attention. Here's the scoop:
1️⃣ Market-Wide Rallies: The primary reason behind the recent market rallies is the sideways movement of #BTC. While Bitcoin remains stable, we're witnessing a surge in other assets.
2️⃣ USDT Chart Rejections: On the USDT chart, we're consistently observing rejections. This means that buyers are facing obstacles around the 8.20% area which is good for Altcoins in general.
3️⃣ Critical Threshold: If we witness a close below the 8% mark, it could be a game-changer. This event might trigger a rally that could drive USDT down to 7.25%. This would also likely result in altcoins hitting new local highs.
Intriguing times are ahead.
What do you think?
Do hit the like button and share your views in the comment section.
Thank you
#PEACE


USDT.D AnalysisUSDT.D
Due to the fact that the
Tether Dominance index did not have a clear situation on August 22, and as we said, we had to wait for the direction of the movement so that it either penetrates in the upper area or something happens that is clear in the chart.
Which shows a fake break down and then move up.
Currently, the index has formed a head and shoulder pattern or QM and it is expected to go down to 7.85% and then reach 8.60 and above.

USDT Dominance 3DKeep an eye on USDT Dominance. It is ready for the breakout of the Symmetrical Triangle.

please pay attentionThe Elliott Triangle has been completed with correction waves, and it is now supposed to rise sharply in the direction of a fifth and last wave, and thus the whole market has reached a new bottom. Please be careful
Note: it fails if the price closes below the 6.42 area

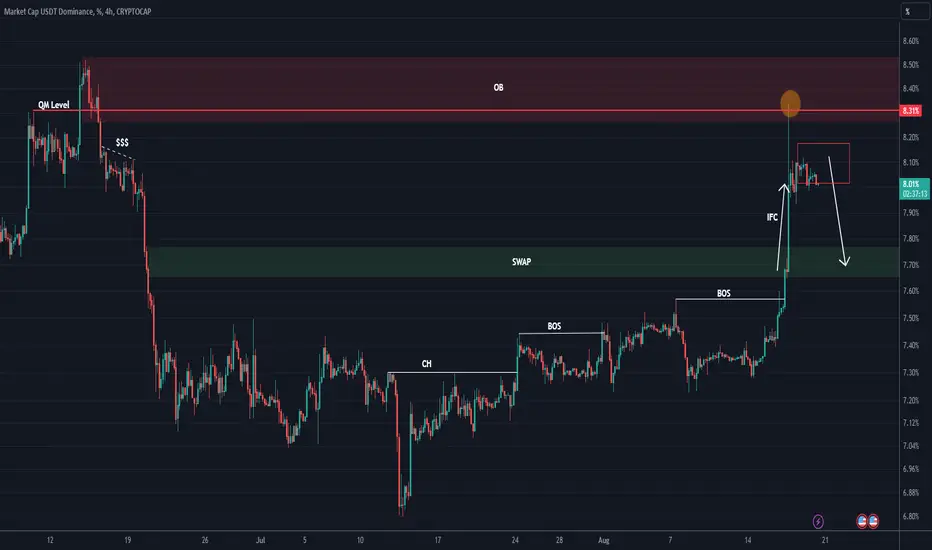
Tether's Dominance Aanalysis (4H)Tether's Dominance, after creating a bullish CH and the BOS it had, climbed and ran into a fresh Order Block and has now reacted to it.
Inside this OB, we also have a QM Level that has increased the power of this supply area.
Also, a liquidity pool that I have shown in $$$ has been collected
According to the movement of Sharp (ifc) and the lack of trading liquidity, it is expected that the price will move towards the swap support area after settling down a bit.
As you know Tether Dominance moves inverse of BTCUSDT. This means that Bitcoin and some altcoins may go a little higher.
Significant volatility period: starting around September 6hello?
Traders, welcome.
If you "Follow", you can always get new information quickly.
Please also click "Boost".
Have a good day.
-------------------------------------
(USDT chart)
It touched around 82.959B on the falling candlestick.
Therefore, the rise and fall of candlesticks that do not gap should be interpreted as triggering trades.
That's why you don't have to be afraid of falling candlesticks.
What you should be afraid of is when it drops, creating a gap.
This is because it is seen as a phenomenon of outflow of funds from the coin market.
Around August 7th, we can see that funds have flowed out of the coin market as the gap down begins.
When the take profit period is over, we expect it to start moving sideways and then start to rise.
I don't think there will be a downturn in the coin market unless USDT falls below 80.986B.
However, there is only a slight pain in waiting.
-------------------------------------------------- -----------
(USDC chart)
USDC is likely to be funds from US-based investment companies or institutions.
Therefore, when USDC shows an upward trend, I think good news will start to come from the US side.
If the gap rises above 26.525B and is maintained, good news is likely to emerge.
-------------------------------------------------- --------
(BTC.D chart)
Altcoins are bouncing as BTC dominance falls below 50.
However, it is only exciting, but it seems to be returning to its original place.
Therefore, in order to trade altcoins, a quick response is required through day trading or short-term trading.
I think the section where you start to think that the pumping of altcoins has started is when it drops below the 47.64-48.81 section.
The pumping of these altcoins is highly likely to cause a strong downtrend in the coin market soon, so caution is required.
In order to welcome a proper altcoin bull market, BTC dominance must rise above at least 55.01 and then start to decline.
For now, I expect it to rise to around 61.73-68.72.
-------------------------------------------------- -----
(USDT.D chart)
A big rise occurred as it rose above 7.14-7.39.
An increase in USDT dominance means that the coin market is likely to go down.
If it remains above 8.12, it is expected to renew the new high (ATH).
Unless USDT dominance shows a decline, the coin market as a whole will draw a downward trend.
(1D chart)
Accordingly, it is expected that it will be important how it behaves during the volatility period between about 6th and 16th September.
At this time, if it does not fall below the minimum of 7.62, USDT dominance is expected to maintain an upward trend in the end, so caution is required.
-------------------------------------------------- -------------------------------------------
** All descriptions are for reference only and do not guarantee profit or loss in investment.
** The trading volume indicator is displayed as a candle body based on 10EMA.
Display method (in order of boldest)
More than 3x 10EMA trading volume > 2.5x > 2.0x > 1.25x > trading volume below 10EMA
** Even if you know other people's know-how, it takes a considerable period of time to make it your own.
** This is a chart created with my know-how.
---------------------------------

USDT.D S&R in short-mid term>>>>>>I Have Tried My Best to Bring the best Possible outcome in this Chart.
Based on the USDT.D chart,at short time 8.20 (D-Time frame & mid term) Resistance area must not break's,
In this case USDT.D can reach and test 9.20-9.50 As a important Resistance area's in longer time fram.
All important support and resistance's in Short -Mid - term marked on the chart.
It's Not a financial advise.
PLZ DYOR
With hopping succe

#USDT.D TAUSDT.D is moving in a symmetrical triangle. Currently, its is rejecting from the resistance trendline. MACD is in the overbought region.
A rejection from here could be a possible scenario, while a solid breakout or breakdown would confirm its next direction. We've to note that it works inversely proportional to the crypto market.

USDT.D(based on NEo wave)This is all of the E wave on daily TF but I am suspicious about the last branch , in the first sight it is triangle but it could be another patterns.the confirmation is breaking down the black line as I drew.

Usdt.d update two path 21400 and 39000I want update usdt.d chart but btcdown and other downs are still valid BINANCE:BNBDOWNUSDT BINANCE:BTCUSDT CRYPTOCAP:USDT.D

Usdt.d(based on NEo wave)I think it may be is bow tie pattern and we can take long positions on btc and eth.
The red line is stop loss and the target is black line!

usdt.d dayli timeframe
✅The Tether Dominance index happened exactly without the slightest difference with the analysis on August 8 and grew well to the level of 8.37%.
❗️As we said, due to the tight market, the specified supply level is invalid.
✅If this compression is not broken in the right direction, the market will easily cross it and now it is forming a decision area.
❗️And If the market pulls back strongly to the 8.70% level, this area will form a very good support level.
✅Otherwise, we have to wait for the next move of the market.
#usdtd

USDT.DThis is my opinion with technical analysis
Please respect the following rules:
1- Risk management .
2. Have your own strategy.

USDT.D: Bullish Deep Gartley HOP Level with PPO Confirmation 15mWe are about to be getting a 15 Minute PPO confirmation at the HOP Level of this Bullish Deep Gartley as of the time of me writing this and I have added to my Bearish BTC Position.

Volatility occurs in funds in the coin markethello?
Traders, welcome.
If you "Follow", you can always get new information quickly.
Please also click "Boost".
Have a good day.
-------------------------------------
(USDT 1D chart)
(USDC 1D chart)
(BTC.D 1D chart)
(USDT.D 1D chart)
The volatility shown 2 days ago has been corrected and appears to be displayed correctly.
In this way, market cap charts are often displayed properly after at least 1-2 days have elapsed.
- USDT turned from falling to rising,
- USDC is still on a downtrend,
- BTC dominance shifted from gap down to up,
- USDT dominance also shifted from falling to rising in the gap.
We believe that gaps in the USDT and USDC charts are caused by the inflow or outflow of funds into the coin market.
BTC dominance and USDT dominance can also cause gaps.
However, the dominance chart believes that trends are more important than the occurrence of gaps.
Accordingly,
The upward trend in BTC dominance means that the money in the coin market is concentrating towards BTC.
When funds are concentrated towards BTC
1. When funds are concentrated as the BTC price rises
2. If the BTC price falls, but the fall of the altcoin is greater than the fall
Cases 1 and 2 above.
Therefore, I believe that BTC dominance shows the movement of funds in altcoins rather than movements in BTC.
Therefore, it can be inferred that BTC dominance must be in a downtrend to buy an altcoin.
BTC dominance is expected to rise to around 61.73 from a mid- to long-term perspective, so caution is required when trading altcoins.
USDT dominance must show an unconditional downward trend, so the coin market as a whole is likely to show an upward trend.
Therefore, it is time to start trading when USDT dominance begins to decline.
No matter how much the USDT dominance continues to rise, it creates waves, so trading is possible according to the waves.
Currently, USDT dominance is showing a rise above 7.14-7.39.
So, a support around 7.39 could lead to a rise above 8.12.
Changes in the trend of the coin market are expected as we have seen changes in the money in the coin market.
We would appreciate it if you could refer to the BTC chart description for the timing of the change.
-------------------------------------------------- -------------------------------------------
** All descriptions are for reference only and do not guarantee profit or loss in investment.
** The trading volume indicator is displayed as a candle body based on 10EMA.
Display method (in order of boldest)
More than 3x 10EMA trading volume > 2.5x > 2.0x > 1.25x > trading volume below 10EMA
** Even if you know other people's know-how, it takes a considerable period of time to make it your own.
** This is a chart created with my know-how.
---------------------------------

Full 2 month Review Of Yokub_Umedovich analysisSee Full video and enjoy how is real Trading analysis
BINANCE:BTCUSDT.P BINANCE:COMPUSDT.P BINANCE:KNCUSDT.P BINANCE:LTCUSD.P BINANCE:DOGEUSDT.P

Usdt.D Full market analysis and ideas For Bitcoini explain whole market price action what we must do next ,
CRYPTOCAP:USDT.D
BINANCE:BTCUSDT.P
