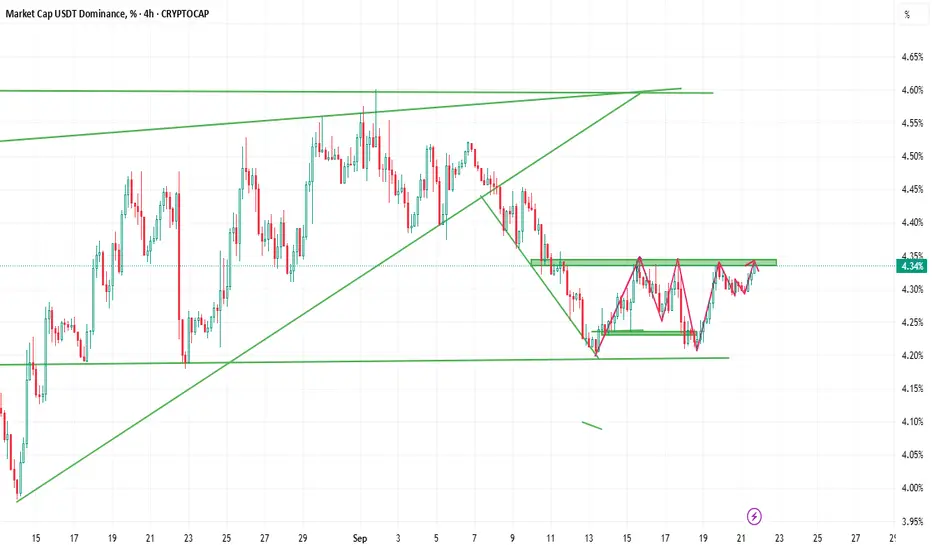
USDT Dominance Hits Channel Top – Correction Ahead?USDT dominance has reached the top of its channel, completing a potential 5-wave Elliott structure. This suggests that a corrective ABC pattern may follow.
• 🟢 Key Resistance: 4.60% – 4.65%
• 🔻 Expected Correction: toward 4.20% – 4.30%
• 📈 Market Impact: A decline in USDT dominance often means capital flowing back into crypto & altcoins.
If this scenario plays out, we could see altcoins breathing again in the short term.
USDT.D trade ideas

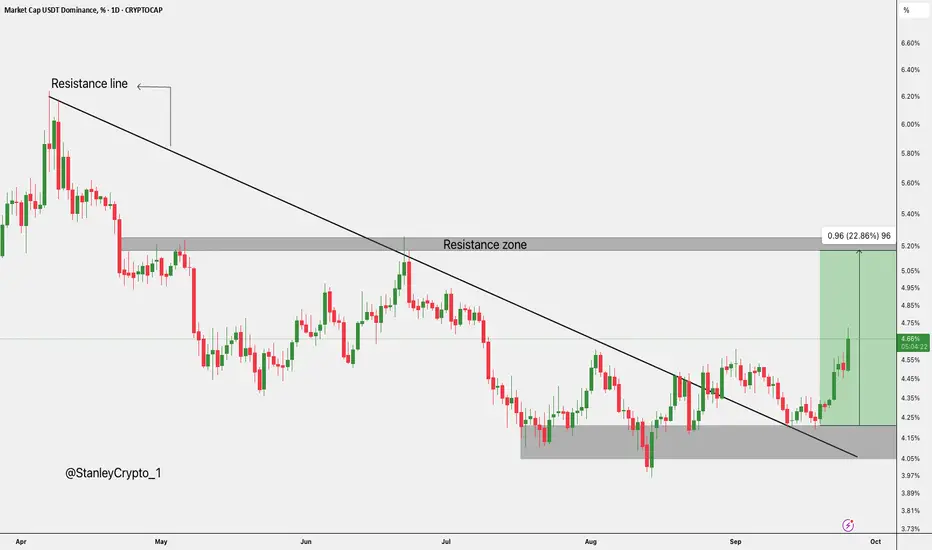
$USDT Dominance: 22% Breakout Potential.CRYPTOCAP:USDT dominance has finally broken free after months of consolidation. It’s now pushing toward the resistance zone around 5% to 5.2%, with a potential 22% upside.
If it holds above that trendline, we could see even more upside in the near future. It’s looking like a solid breakout.
See if it keeps up!
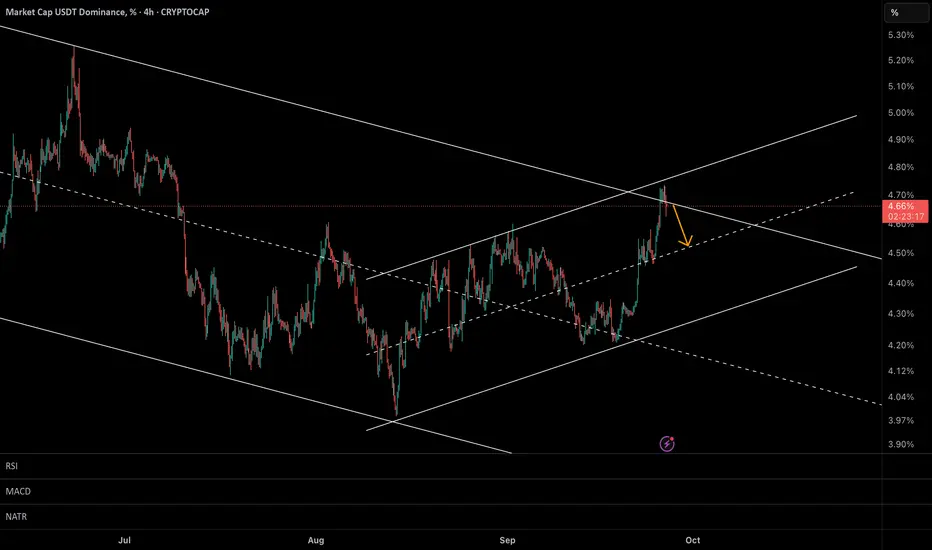
USDT Dominance at a Critical Turning Point–Will Correction BeginIn my previous analysis, I highlighted that USDT dominance had likely completed a 5-wave Elliott structure around 4.60%–4.65%, suggesting that a corrective ABC decline could follow.
That call played out accurately, with dominance stalling right at the projected resistance zone.
🔎 Current Update:
• Price has now hit the top of the larger descending channel as well as the upper boundary of the short-term rising channel → creating a confluence resistance near 4.70%.
• This level remains a high-probability reversal zone.
📊 Scenarios:
• 🔻 Bearish (More Likely):
Rejection from 4.65%–4.70% could confirm the corrective ABC pattern, targeting 4.30%–4.20% next.
👉 This would signal capital rotation back into crypto & altcoins.
• 🟢 Bullish (Alternative):
A confirmed breakout above 4.70% would open the door toward 4.90%, extending pressure on the crypto market.
⸻
📌 Conclusion:
Given the technical confluence, the odds still favor a pullback in USDT dominance, which could give altcoins some room to breathe in the coming sessions.
USDT.D - Watch the Blue Zone: Break = Bullish for CryptoUSDT dominance ripped into the 4.55–4.60 supply and stalled. Price is hovering on the blue support zone at 4.44–4.48.
This area is key 🔑. If the blue zone breaks down and holds below 4.44–4.48, that’s bullish for crypto (alts + BTC) as dominance rotates lower toward 4.30–4.25, even 4.22.
If the zone holds and 4.60 is reclaimed, dominance can push higher and keep pressure on risk assets.
What’s your plan => wait for a confirmed break of the blue zone to flip risk-on, or fade the first rejection at 4.60? 🤔
⚠️ Disclaimer: This is not financial advice. Always do your own research and manage risk properly.
📚 Stick to your trading plan regarding entries, risk, and management.
Good luck! 🍀
All Strategies Are Good; If Managed Properly!
~Richard Nasr

fallin in to the ground coinsfew days ago i published usdt analyses, it went as i think. this up move is going to continue to 4.73%. See my profile other coins analyses how coins drop

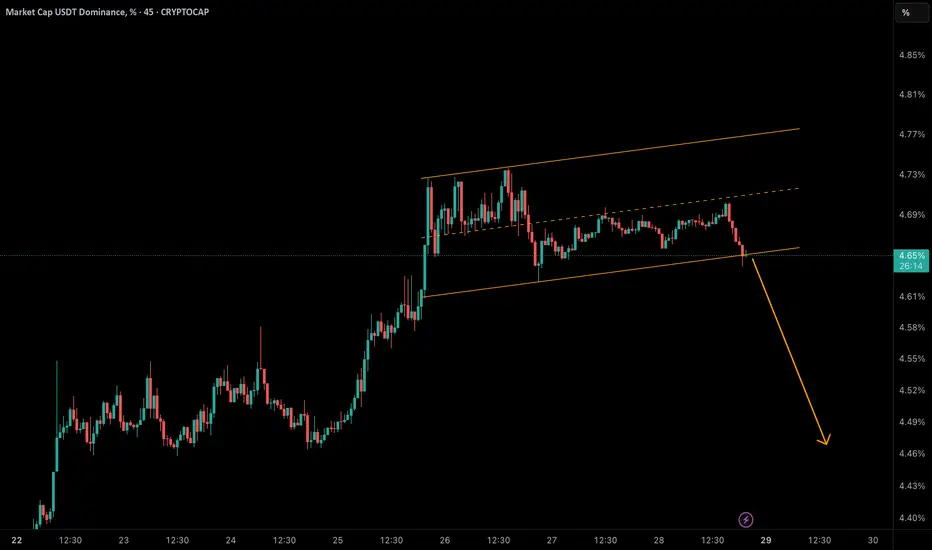
USDT Dominance at a Critical Breakout Point!USDT dominance has touched the bottom of its rising channel near 4.65%.
• 🔻 A breakdown below this support could trigger a correction toward 4.58% → 4.50% → 4.45%.
• 🟢 But if buyers defend this zone and reclaim 4.70%, we may see another push toward 4.75% – 4.77%.
📈 Why it matters: Falling USDT dominance often signals liquidity flowing back into crypto & altcoins, potentially sparking short-term rallies.
usdt.d 4hHello friends
I am Mehdi and I wanted to say that if you are currently in profit compared to the position we announced
It is better to have a save profit and move the stop loss to the entry point
I would appreciate it if you support me with likes and comments

#USDT.D 4H ChartUSDT dominance bounced off the 6h demand zone perfectly as we predicted. It is currently expected to keep pushing towards the minor supply zone at 4.66%.

USDT.D BEARISH MOVE ANTICIPATIONAs observed from experience, when the usdt dominance favors or is about to favor the bears, the entire crypto market breathes a sigh of relief...

Stablecoin Dominance Is Overbought – A Reversal May Be NearUSDT and USDC dominance combined are currently in an overbought region. A reversal could happen soon. Historically, when stablecoin dominance decreases, the broader crypto market tends to rise.
We may be standing at the doorstep of a significant move to the upside in the crypto market, especially in altcoins.

USDT DOMINANCE The chart currently shows that USDT DOMINANCE is in an ascending triangle. Breaking the resistance at the top will be Bearish for most crypto currencies. Just take note

USDT Dominance: Lower Highs, Maybe One Last Pop to ~5%CRYPTOCAP:USDT.D is still in a high-timeframe downtrend. On the weekly chart, price keeps carving lower highs under that clean descending trendline, and it’s still trading below the 200 EMA. Nothing about the bigger picture says “uptrend” yet.
Short term, it looks like we’ve built a pretty clear support shelf around ~4%. You can see the repeated taps down there, with those swing-low dots lining up along the base. From that floor, a bounce toward the ~5% area makes sense—right into the confluence of the trendline and the EMA cluster overhead.
If we do pop into ~5%, that usually means Bitcoin and alts keep bleeding while dominance squeezes higher. But here’s the key idea I want to get across: this could be the last push before CRYPTOCAP:USDT.D USDT dominance rolls over again. We saw a similar behavior when dominance was compressing between ~7% and ~9.5%—the range tightened, then broke lower. I’m seeing the same kind of compression now between ~4% and ~5%, except this time it’s all happening under the 200 EMA and beneath the trendline. That context keeps me thinking “fade the pop,” not chase it.
So my eyes are on the reaction around ~5%. A rejection there would fit the downtrend narrative and open the door for dominance to turn back down, which typically lines up with a risk-on move in BTC and the broader alt market. On the flip side, if USDT.D starts closing above the 200 EMA and breaks that trendline with acceptance, I’ll respect it and reassess—but until that happens, the downtrend call stands.
Bottom line: HTF downtrend intact, support near 4%, room for a squeeze to ~5%, and if that bounce fails where the line and EMAs meet, I’m expecting dominance to resume lower—which is exactly what the crypto bulls want to see.

USDT.D 1H Analysis - Key Triggers Ahead❄️ Welcome to the cryptos winter , I hope you’ve started your day well.
⏰ We’re analyzing CRYPTOCAP:USDT.D on the 1-Hour timeframe .
👀 On the 1-hour timeframe, Tether Dominance moved upward after breaking above the 4.46% level. However, buyers were unable to push through the 4.72% resistance, and the market reacted (rejected) at that zone. This reaction formed a multi-timeframe consolidation box. The top and bottom of this box now act as key levels to determine the next market direction:
Break above 4.72% ➝ Potential for deeper correction in the crypto market.
Break below 4.46% ➝ Possible trend reversal and confirmation of renewed upside momentum.
The market is currently in a low-volume weekend phase, and price action is range-bound. With the start of the new week, there’s a higher probability of breaking out of this consolidation.
🧮 The RSI oscillator shows that after reaching the overbuy zone, price couldn’t sustain time there and was quickly rejected, forming the current market floor. Another key RSI level is around 44, which aligns with the 4.46% support. If momentum crosses below this zone, volatility could increase and trigger the next leg of movement.
🕯 On the 1-hour chart, there have been numerous green candles, indicating a deeper market correction as earlier buyers take profit and sell. This move continued until the 4.72% resistance, and the current range structure shows:
Red candles slightly larger
Green candles more frequent but smaller
This signals weakening bullish momentum, increasing the likelihood of a break below the 4.46% support.
🧠 With the current sideways structure, two main scenarios are in play:
1️⃣ Breakdown of the lower boundary (4.46%)
Could trigger a strong bullish leg in crypto, pushing the market upward.
If this happens, it could be an ideal scenario, supporting a broader crypto rally.
2️⃣ Breakout above the upper boundary (4.72%)
Would likely lead to a deeper correction across the market.
This scenario could result in significant drops in Bitcoin and Ethereum.
Keep both the ceiling and floor of Tether Dominance in mind as the new week begins. The current range is relatively narrow, meaning a breakout could even occur as early as tomorrow during the New York session.
❤️ Disclaimer : This analysis is purely based on my personal opinion and I only trade if the stated triggers are activated .

USDT.D: Possible Take Profit zone for AltcoinsI see the green box as a safe zone to sell the altcoins.
so between 3.27% and 2.76%.
Setting an alert on 3.27% is advisable so you can pay attention.

USDT Dominance Eyes Continuation After Double BottomUSDT dominance (USDT.B) on the daily timeframe has shown a strong shift in momentum. After breaking the trendline, price action confirmed a double bottom formation, pushing dominance steadily upward. Right now, there’s a small chance of a retracement around the 4.56% area, where order flow could reset before continuation.
Technically, the chart has already posted two lower highs, forming a bullish setup that favors another higher low before moving higher. If dominance keeps climbing, the crypto market may face strong selling pressure—Bitcoin and altcoins could bleed in the coming week.
However, the invalidation point sits below 4.2%. A breakdown from that level would signal weakness, potentially giving relief to Bitcoin and altcoins for an upward move.
👉 Keep an eye on 4.56% for a possible bounce and 4.2% as a key invalidation. The next few sessions may decide whether USDT dominance continues its bullish leg or offers crypto traders a breather.

#USDT.D (4H Chart)#USDT.D
(4H Chart)
🔹️ USDT Dominance Analysis 🔹️
USDT dominance usually moves in the opposite direction of Bitcoin — when Bitcoin rises, this index tends to fall, and vice versa.
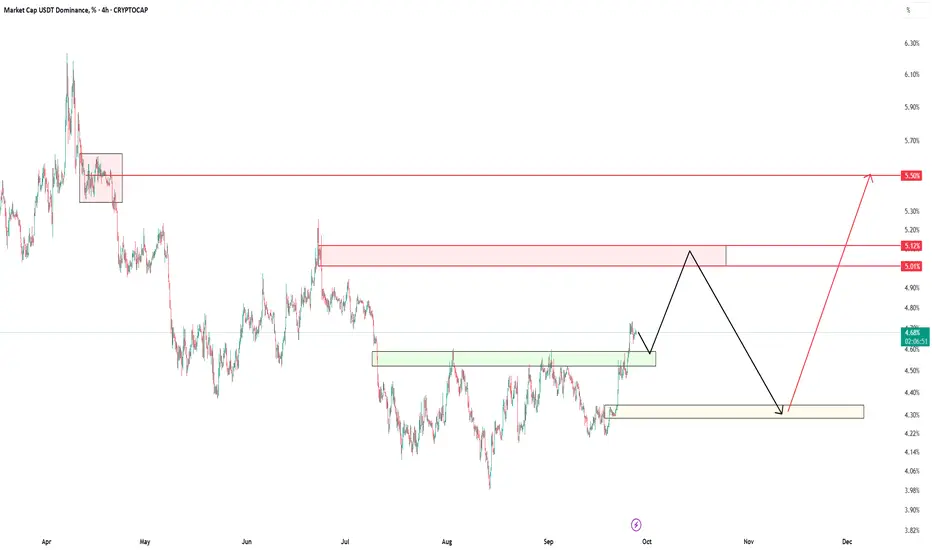
🟢 Green Box (Current Support)
The current support level for USDT dominance is in the green box: 4.60 – 4.50%.
We expect the price to move toward this level first, and after touching it, head toward the red box.
🟥 Red Box (Main Resistance)
The red box is at 5.00 – 5.12%.
This is the first and most important resistance level ahead.
After reaching this level, a correction is expected back toward the yellow box.
🟡 Yellow Box (Key Support)
The yellow box sits at 4.30%, which is a strong support area.
Once this level is tested, a major bullish move in USDT dominance is expected, targeting around 5.50%.
🎯 Final Target
When USDT dominance reaches 5.50%, the crypto market will likely be near its price bottoms.
💡 These bottoms could approximately align with Bitcoin around $85,000 and Ethereum around $3,000.
🆔 @RasoolAhmadi
usdt.d 4husdt.d 4h
🔎 A few notes from the chart:
The chart is located on the PRZ (Potential Reversal Zone) or the harmonic pattern completion zone.
The candles have reached an important resistance zone after rising.
At PRZ, we usually expect a reversal (return to the bottom), especially when it overlaps with Fibonacci levels and the trend line.
It is characteristic that a green rectangle (probably a sell position) has been drawn on the chart, which indicates that we expect a decline.
📌 Conclusion:
Due to the harmonic structure + PRZ support, the probability of a price reversal and a downward move is higher ✅

usdt.d 30minHello friends
I am Mehdi, according to the Tether Dominance chart and the full targeting of the previous analysis in the 4-hour timeframe
According to the new analysis, I think the price is expected to reach the range of 4.49
1 Because the 4.57 level was broken with a strong candle in the 4-hour timeframe and now the price is rejecting this level
2 We are at the 382 fibo level
3 RSI divergence
Thank you for supporting me by liking and commenting and sharing this analysis

USDT Dominance Hits Major Resistance – What’s Next for Crypto?📊 On the 4H timeframe, USDT dominance (USDT.D) is approaching the 4.60% – 4.70% resistance zone, a level that has repeatedly triggered strong rejections in the past.
🔹 Primary Scenario
A rejection from this resistance is the more likely outcome. If confirmed, it could signal a bullish move for Bitcoin and altcoins as capital flows back into risk assets.
🔹 Alternative Scenario
If USDT.D manages to break and hold above 4.70%, this would indicate risk-off behavior in the market, potentially leading to increased selling pressure on crypto assets.
⚖️ Summary:
• 🔻 Rejection at resistance → Positive signal for crypto rally
• 🔺 Break & hold above 4.70% → Warning of further downside in crypto

usdt.dLaunched in 2014, Tether is a blockchain-enabled platform designed to facilitate the use of fiat currencies in a digital manner. Tether works to disrupt the conventional financial system via a more modern approach to money. Tether has made headway by giving customers the ability to transact with traditional currencies across the blockchain, without the inherent volatility and complexity typically associated with a digital currency. As the first blockchain-enabled platform to facilitate the digital use of traditional currencies (a familiar, stable accounting unit), Tether has democratised cross-border transactions across the blockchain.

#USDT.D 4H ChartUSDT Dominance is still consolidating and it recently got rejected off the resistance at 4.55%. If it breaks below 4.46% then we would expect it to keep pushing downwards aiming to retest the S/R Flip at 4.38%.

USDT.DOMINANCE ANALYSIS market dominance facing resistance, keep watch if the price doesn't close above the resistance level, we might see gain in price momentum in altcoins and if the market gets passed the resistance with a successive retest the altcoins might hit a downtrend keeping watch.
$USDT Dominance Bullish Divergence Signals RotationUSDT dominance is flashing a clean bullish divergence while MACD builds a tidy double-bottom structure. When the USDT share of the market starts climbing, it usually means traders are rotating into cash for safety. That often lines up with softer BTC momentum and underperformance across altcoins.
What I’m watching:
Momentum: bullish divergence suggests buyers are defending the recent higher low on dominance.
MACD: a double bottom with a fresh uptick strengthens the case for a push higher.
Market knock-on: a rising USDT dominance tends to pressure BTC first, then bleeds into ALT/BTC pairs.
How I’m planning it:
If dominance breaks above the recent swing high with expanding momentum, I’ll trim risk on alts, favor BTC over high-beta names, and wait for cleaner entries after a reset.
If dominance stalls at resistance and rolls over, that’s my cue for a short-term risk-on bounce, with attention on strong ALT/BTC setups.
Alerts: prior swing high on dominance, MACD signal cross, and any bearish divergence that hints at a rollover.
Invalidation:
A daily close back below the most recent higher low on dominance plus a MACD roll-down would weaken the thesis and point to a relief phase for alts.
TL;DR: USDT dominance looks ready to push higher on bullish divergence and a MACD double bottom. Historically, that leans risk-off for BTC and alts until dominance cools off again.
