USDT Dominance (USDT.D) – Daily Timeframe AnalysisUSDT Dominance (USDT.D) – Daily Timeframe Analysis
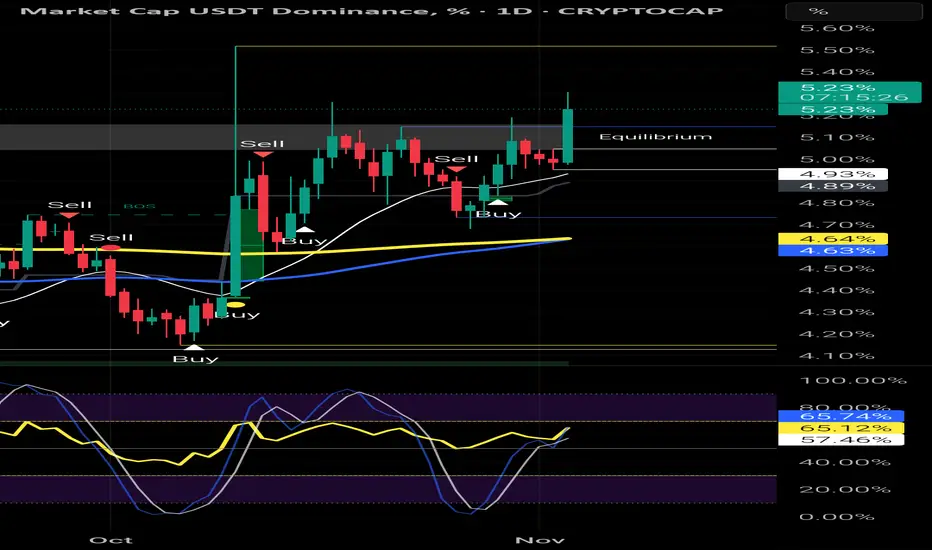
Current Value: 5.23%
Trend: Bullish breakout – Risk-off sentiment increasing
Technical Overview
USDT dominance has broken above the equilibrium zone (~5.00%), signaling capital flow into stablecoins — typically a bearish signal for BTC and the broader crypto market.
The strong bullish candle closing above both the 50 EMA (white) and 200 EMA (yellow) confirms the risk aversion among traders.
This aligns with the recent BTC/USDT drop toward the 106,500 USDT area, showing that money is rotating out of volatile assets (like BTC) into USDT.
Key Levels
Resistance Zone: 5.30% – 5.40% (recent highs / potential supply area)
Support Zone: 4.90% – 5.00% (former resistance turned support)
Major Support: 4.60% (EMA confluence + structure base)
Indicators
The Stochastic RSI is rising but not yet overbought (≈65%), suggesting there’s room for further upside in dominance.
Momentum favors USDT, meaning cryptocurrency prices may continue facing pressure until dominance peaks.
Market Implications
Rising USDT dominance → Bearish for BTC, ETH, and alts.
If USDT.D reaches 5.40% or higher, expect BTC to test the 104,000 – 102,000 USDT zone.
A rejection near 5.40% with a return below 5.00% could signal a relief rally for BTC.
Summary
USDT dominance is showing strong bullish momentum, reinforcing the current risk-off sentiment in the crypto market.
As long as dominance holds above 5.00%, expect continued downward pressure on BTC and altcoins.
Watch closely for exhaustion signals around 5.35% – 5.40% — that could be the first clue of a potential BTC rebound
Trade ideas
USDT.D Eyeing Resistance, Altcoin Holders Stay Alert!USDT.D is trading right at the edge of a breakout near the resistance zone. If it manages to break above, we could see another sharp drop in altcoins in the coming days.
However, a rejection here might give altcoins some much-needed breathing room.
DYOR, NFA
#PEACE

USDT.D – 4H Technical OutlookUSDT.D – 4H Technical Outlook (Nov 2, 2025)
📊 Market Structure:
USDT Dominance remains in a medium-term bearish structure, forming a clear Lower High (LH) around the 5.20–5.25% premium zone.
Recently, the market printed a bullish CHoCH after bouncing from the 4.75% swing low, but price is now facing strong resistance near 5.00–5.05%, aligned with the 89 EMA and a prior liquidity zone.
Overall, the structure remains bearish-biased, with the current move likely a corrective retracement within the broader downtrend.
📈 Key Levels:
Resistance Zone (Premium / Supply Zone): 5.20 – 5.25%
Current Reaction Zone: 5.00 – 5.05%
Support Zone (Discount / Demand Zone): 4.75 – 4.80%
⚙️ EMA Confluence:
The 89 EMA (blue) sits just above current price, acting as dynamic resistance.
The 200 EMA (yellow) lies below, around 4.75%, serving as major support.
➡️ Both EMAs confirm that the dominant trend remains bearish, with price currently in a technical pullback phase.
📉 Momentum (Stochastic RSI):
The Stochastic RSI is slightly turning upward from the mid-zone (40–60%), signaling weak bullish correction momentum.
No overbought signals yet, suggesting that price may still test 5.05% before resuming the downside move.
🎯 Trading Scenarios:
Scenario 1 – Sell (Trend Continuation)
Entry: 5.00 – 5.05% (EMA89 retest / resistance zone)
Stop Loss: 5.10%
Take Profit: 4.85% → 4.75%
Confluence: EMA rejection + bearish structure + weakening momentum
Scenario 2 – Buy (Reversal Confirmation Only)
Entry: 5.10 – 5.15% (after clear breakout & retest)
Stop Loss: 5.00%
Take Profit: 5.20 – 5.25%
Confluence: Break of structure + EMA breakout + strong bullish confirmation
💡 Summary Insight:
USDT Dominance is currently in a corrective phase within a broader downtrend.
A rejection from 5.05% could lead to continuation toward 4.85–4.75%, which would support a bullish move in BTC and altcoins.
Only a confirmed 4H candle close above 5.10% would shift short-term momentum to bullish and add downside pressure to crypto prices.

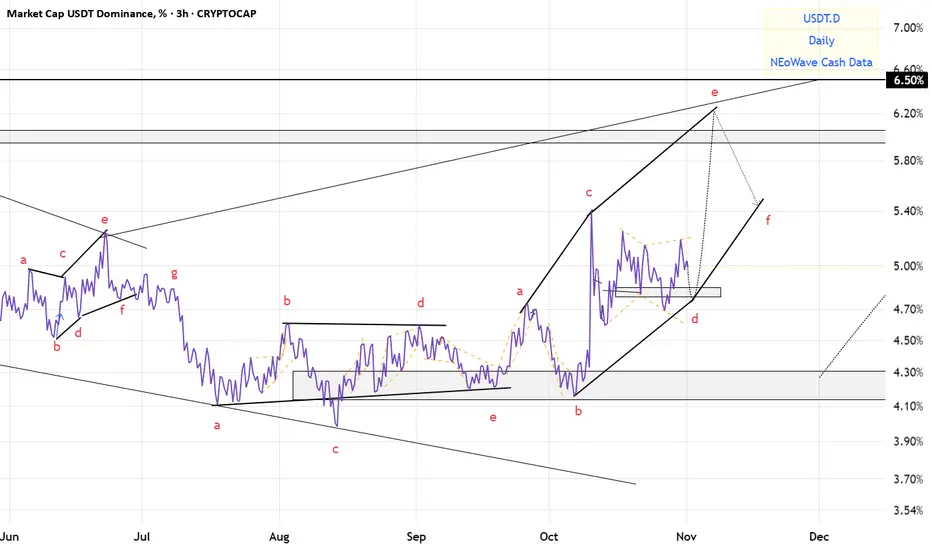
USDT.D(based on NEo wave)after this long trading range I think its time to change my counting and its not a triangle.
crypto market will see lower prices and it will continue for 1 month.
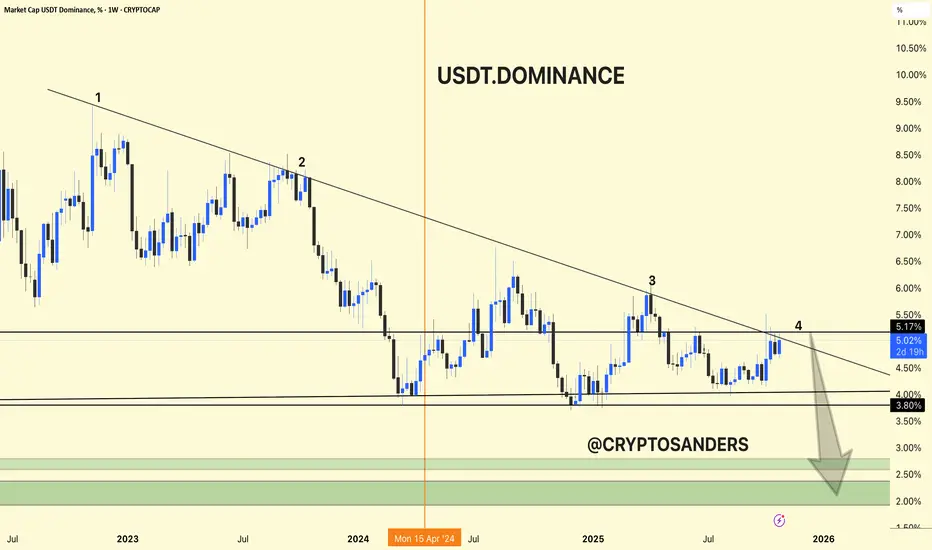
USDT.DOMINANCE CHART ANALIYSIS !!USDT Dominance Chart Update.
USDT dominance is again rejecting at the long-term trendline resistance (point 4), currently around 5.17%.
Structure suggests another potential move lower, with possible targets in the green zone (2.0%–3.0%) if the downtrend continues.
This scenario typically favors fresh capital rotation into Bitcoin and altcoins as traders de-risk from stablecoins.
Summary:
USDT dominance remains weak below the trendline. A sustained drop could spark further altcoin momentum and a broader crypto rally.
USDT.D SHORT Based on the analysis of Elliott waves, we expect price to enter a major correction after the formation of correction wave B in the two specified ranges to form wave C

USDT possible head and shoulders. Cant break neckline at 4.9 USDT.D appears to be forming a clear Head and Shoulders pattern, with the neckline around 4.68.
• Left Shoulder: ~4.9
• Head: ~5.2
• Right Shoulder: ~4.9
• Neckline: ~4.68
A confirmed daily close below 4.68 could trigger capital rotation from stables into risk assets, marking the start of an altcoin recovery or early altseason phase.
If dominance stays under 4.6 for 24+ hours, expect liquidity to flow into BTC, ETH, and strong mid-cap alts.
However, any bounce back above 4.75–4.8 would invalidate the setup and signal continued caution.
📊 Watching closely for confirmation — this could be the move that sets the tone for November.
⸻

USDT Dominance Breakdown and Market Rally !!!👋🏻 Hey everyone! Hope you’re doing great! Welcome to SatoshiFrame channel.
✨ Today we’re diving into the 4-Hour USDT.D analysis. Stay tuned and follow along.
👀 On the 4-hour timeframe, USDT dominance was rejected downward as it approached its seller-taker zone. With heavy USDT selling, it lost its key support at 4.89%, giving us a confirmation signal for long positions. USDT dominance is now sitting on a key support at 4.74%, with another close support at 4.61%. If these two key levels are broken, the prices of coins can become significantly more expensive.
🔍 Which support zone currently acts as the key one? The 4.74% level can create a short-term pullback in the market, but if you look closely, it has not yet shown any sign of weakening the downtrend or stopping the heavy USDT sell-off. Sellers are not interested in holding USDT in their wallets, and over the past weeks, we have also seen large USDT minting from the issuing company.
Regarding the 4.61% level: breaking this zone will likely require a whale liquidation move, clearing many short positions and large sell orders, which could then trigger a price rally.
🧮 On the 4-hour timeframe, the RSI oscillator is currently in the OverSell zone. Since we cannot rely only on this, we look at the daily timeframe. On the daily chart, USDT dominance is pushing below the 50 level, indicating continued broad selling pressure of USDT — a behavior usually aligned with breakouts in the crypto market.
⁉️ So what information is USDT dominance giving us now? If we observe dominance behavior on the 4-hour chart and compare it with the daily structure, we can identify the beginning of a strong bullish leg in the market, where the prerequisites are the breakdown of the multi-timeframe support zones mentioned in the first paragraph.
❤️ Disclaimer : This analysis is purely based on my personal opinion and I only trade if the stated triggers are activated .

$USDT.D its time for a markdown...End of Q4 and start of Q1 will be fun for Altcoins and Bitcoin. CRYPTOCAP:USDT.D is going to give some fresh air to our beloved coins.
Risk on period ahead.

USDT.D – 4H Technical Summary (Oct 26, 2025)USDT.D – 4H Technical Summary (Oct 26, 2025)
Structure: USDT Dominance has broken below the short-term BOS (Break of Structure) after multiple rejections from the premium zone, indicating a potential shift from bullish to bearish momentum.
Price Action: The dominance failed to hold above Equilibrium (≈4.84%) and is now trading toward the discount zone, signaling risk-on sentiment across crypto assets.
Moving Averages: Price is currently testing below the EMA89 (blue) while the EMA200 (yellow) sits near 4.70% — a key area for reaction. A clean break below this confluence would reinforce further downside.
Liquidity Zones:
Immediate support: 4.70% (discount / EMA confluence)
Next target: 4.40% – 4.20% (strong demand & previous accumulation zone)
Resistance: 4.90% – 5.00% (equilibrium retest / prior supply)
Momentum: The stochastic oscillator remains in the oversold region, hinting at a possible short-term bounce, but structure favors continued downside after retracements.
Trading Plan:
Bias: Bearish – expecting further decline in USDT dominance.
Scenario: Watch for minor pullback to 4.85% – 4.90% to confirm rejection before continuation lower.
Targets: 4.70% → 4.40%.
Invalidation: Sustained move back above 5.00%.
➡️ Outlook: Weakening USDT dominance supports bullish continuation for Bitcoin and altcoins as capital rotates out of stable assets into risk-on markets.

The Clearance Theory Dear Followers
As an analyst I always watch the market and take a notes
I would like to share one of my theorys today
I did notice this pattern did happen before throw the last few years
I call it the The clearance
it did happen before when the market was about to move strongly toward a new direction
and for making sure it will face a weak resistance the market will try to fulfill most of the pending orders before his final move
it takes the pending orders and dumb it till all the major orders fulfilled, Then >>>>>>>>
Good luck everyone

Usdt Dominance set to collapse?Usdt.D is hanging on to a multi year uptrend by its fingernails - The candles have regained the fib and the ascending support but were stopped by the downtrend - This looks like a retest of the drop beneath the uptrend has been rejected - The next couple weeks we'll see...

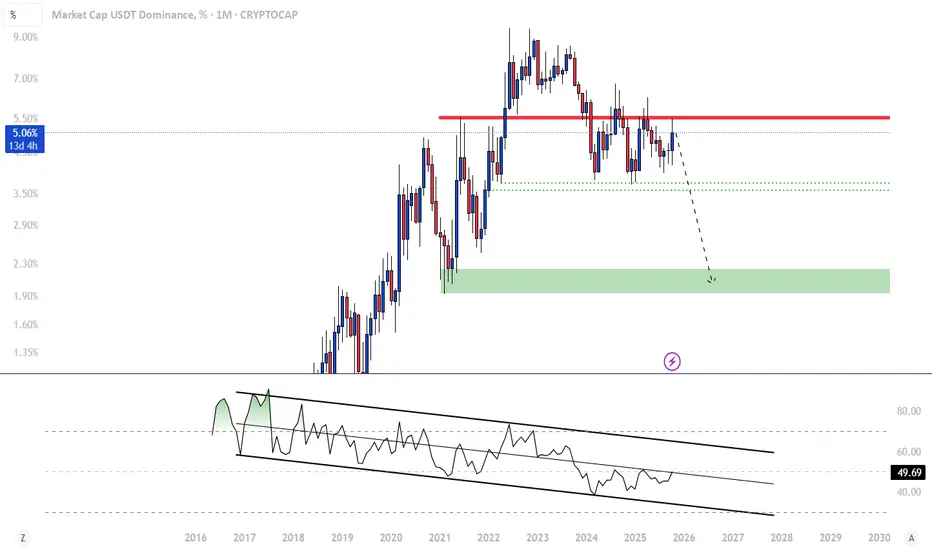
Stable Coin is Still Pairing with the BULLCRYPTOCAP:USDT.D COINBASE:BTCUSD CRYPTOCAP:TOTAL - A macro inverted H&S pattern on USDT.D suggests more bearish activity soon to come.
Strong increase in volume this month strengthens the signal. There could be a bear trap shakeout (Bull Trap in the crypto market) before continuation to the upside. In Wyckoff terms, this area would be labeled the LPS event (Last Point of Support). I would expect resistance at the neck line. But If price breaks through with increasing volume, the upper trend line will be the next target, alongside the 1:1 ratio.
These trend lines tend to act as magnets to the candle and that is where the liquidity is pooled. Shooting stars through July '24 resistance would be a major signal to look out for, as this suggests that the trend up is exhausted. A similar non-inverted H&S pattern can also be seen on OTHERS.
So, this TA serves as another bearish clue for future price action in crypto. DXY is also looking bullish, which I will cover in a future post. When USDT.D and DXY go bullish, the whole town gets painted red. Good Luck Traders!
-Not Financial Advice-

USDT.D Hits Supply Line – Reversal or Breakout?
USDT.D @ 5.12% – upper supply line (descending channel top + 5.00% resistance confluence).
What I See:
Bearish rejection: Red candle close below 5.12% → confirms reversal.
Bullish breakout: Close above 5.12% + volume spike → targets 5.40%+ (risk-off).
Bias: Bearish – price kissing supply with lower highs since 2023.
Next 24h trigger:
Break 5.00% → drop to 4.70% (altcoin fuel).
Hold/reject → grind to 5.40% (crypto caution).
Action: Watch 4h close. Rejection = short USDT.D (long alts).

usdt.d chart reviewMy overall outlook is bearish,but In my view, USDT.D is likely to complete a minor bullish correction from the current zone before resuming its downward move. This aligns with the broader market’s potential risk-on sentiment.

USDT.DWe are in a Disjoint Channel. Above the price is a monthly resistance and if it breaks below, we could see a 2.91% decline and see prices grow. The price range in the 3-month timeframe is Order Block Range 2.45 to 3.46%.
I imagine two approximate scenarios and I have drawn both.

USDT.D Breaks Out, Altcoin Correction Ahead?USDT.D has broken above the resistance trendline and is now forming higher highs and higher lows, a clear sign of a bullish structure shift.
If the price breaks above the next resistance, we could see more correction across altcoins.
Keep an eye on USDT.D and stay tuned for further updates.
DYOR, NFA

#USDT.D 1H ChartUSDT dominance is currently bouncing off the 100MA. It is expected to reach the minor supply zone at 5.03% before expecting further retracement to the downside.

USDT Dominance — Is the Market Ready for a Relief Rally?After several days of steady climb, USDT dominance has now broken below its ascending support line — a potential signal that risk appetite may return to the crypto market.
The chart shows a clear short-term shift in momentum:
• The dominance failed to sustain above 5.15%, forming a local top.
• A clean breakdown from the channel has opened the path toward key liquidity supports, highlighted by the yellow zones between 4.95% → 4.75%.
• These areas represent potential reversal zones, where stablecoin capital might start rotating back into altcoins.
If dominance continues to drop toward these supports, we could see altcoins begin a short-term recovery phase — especially those with strong structure and volume base.
⚠️ Invalidation:
A return and hold above 5.15% would invalidate this scenario and suggest further consolidation before any major move.
⸻
📊 Summary:
USDT.D heading toward key supports → Possible rotation into risk assets (alts).
Stay alert for bullish confirmation signals on ALTs as dominance approaches the yellow zones.

usdt.d MHello friends. In my opinion, Bitcoin will break the $126,000 ceiling and Ethereum will also hit a new ceiling. My analysis is based on my expectations for Tether dominance, which you can see in the chart! This is my personal opinion and I would like to share it with you and ask what you think about it. Your attention and opinion are very valuable to me.
Can USDT.D break its high ? | USDT.D 4H Analysis🥳 Hey everyone! Hope you’re doing great! Welcome to SatoshiFrame channel .
✨ Today we’re diving into the 4-Hour Ethereum analysis. Stay tuned and follow along!
💵 Can USDT.D break its high & cause crypto drop again ? Tether Dominance is hovering near the 5% zone after the Trump tariff rumors — a key resistance that perfectly aligns with the crypto market’s bottom. A breakout here could trigger another leg down across altcoins.
👀 4-hour timeframe of Tether Dominance and we can see that after breaking the 4.6% area, it gave us a confirmation for an uptrend, and in this area, it also formed a higher low compared to its previous low. It easily broke through several resistance levels and reached its top at the 5.16% area, where it is now rejected. Since we are in the holiday period, we have faced weak downward momentum, and now several breakout triggers have formed on the Tether dominance chart which, with Tether volume passing through these areas, the market can start its next move. Note that this top that has currently formed is the same as the bottom of the altcoins that we see on various charts, so breaking this top will not be easy.
🧮 The RSI oscillator can be a great help to us in this analysis, as it allows us to better identify the tops and bottoms of Tether dominance. If the oscillation passes through those desired areas, we can take positions on coins contrary to the direct supply and demand of the chart itself. The 74 oscillation zone is slightly above the overbought boundary, and crossing this area can increase the oscillation volume of Tether buy trades and cause the crypto market to lose its bottom. The next important area is the 50 zone, where a reaction to this area or passing the oscillation limit from this area can form a lower top for Tether dominance and then give us confirmation to start a bullish leg in the market.
🕯 The size of the Tether dominance candles during the rise was significantly smaller but closed with more strength, while during reactions and pullbacks, the size and number of candles increased, which informs us of the weakness of the Tether sellers' trend. A noteworthy point for Tether dominance is the rejection it received from the top and then moved downward, facing weak upward momentum. If the market bottom is in this area and the Tether dominance top is also in this area and this top does not break, the market can soon tend toward a trend change and a drop in dominance may occur.
❤️ Disclaimer : This analysis is purely based on my personal opinion and I only trade if the stated triggers are activated .

USDT ; there is still hopeOne of the nastiest charts in the cycle that intends to destroy everything is usdt.d , it’s in a crucial point declining from a multi year channel, if it goes down from here it can also break the triangle downward, it will definitely be lovely to see this one breaks down , they will try to inject more to balance the chart so it would be difficult to say any target but let’s hope it goes as planned.
Have a blessed day

Can USDT.D break the Taker Seller Zone ? | USDT.D 1H Analysis👋 Hey everyone! Hope you’re doing great! - ❤️ Welcome to Satoshi Frame .
📅 Today we’re diving into the 1-hour Bitcoin analysis. Stay tuned and follow along!
👀 On the 1-hour timeframe of USDT.D, we can see that after the news of Trump imposing tariffs on China, USDT.D experienced an extremely sharp pump — rising from below 4.3% to near 5%. After that, it formed a trading-range box in this zone. The top of this box lies around 4.89%, overlapping with a “taker-seller” resistance zone where Tether’s market share is currently capped. There’s a key midline at 4.74% and a bottom at 4.59%, completing this trading-range pattern. Price has tested the top three times but failed to break it, meaning USDT.D remains trapped below resistance. A 15-minute multi-timeframe Low has also formed at 4.83%, creating a new structure that, if broken, could trigger Tether selling.
🧮 Looking at the RSI oscillator, since October 12 it has tried three times to enter its 1-hour OverBuy zone but failed each time. Each rejection from around the 70 level led to selling pressure and movement back toward its 50 support zone. This 50 level is a very important static resistance — a breakout above it could push USDT.D toward higher resistance levels. The 50 RSI zone also overlaps with the 4.83% price level, meaning if that area is lost, selling pressure and volume decline could begin.
🕯 The size and volume of recent USDT.D candles show weakness every time it reaches the 4.89% top. Breaking the taker-seller zone will require a large “whale” candle — a strong, high-volume bullish move that can fully absorb the sell orders placed there. In short, breaking this level needs a strong price surge and maximum buying pressure.
🧠 To manage or open new positions using USDT.D as a guide, we can consider these scenarios:
🟢 Breakout of the taker-seller zone: This breakout could be triggered by news or even a Trump tweet :) From a technical standpoint, this area needs a massive, high-volume “whale” candle so that all sell orders in this zone get filled instantly. Once price surges and holds above it, the next resistance would be around 5.1%.
🔴 Break of the 15-minute multi-timeframe Low: This Low sits at 4.83%. A confirmed close below it could signal the start of selling and volume decline. In this scenario, the next support for USDT.D would likely be the box midline — around 4.74%.
❤️ Disclaimer : This analysis is purely based on my personal opinion and I only trade if the stated triggers are activated .
