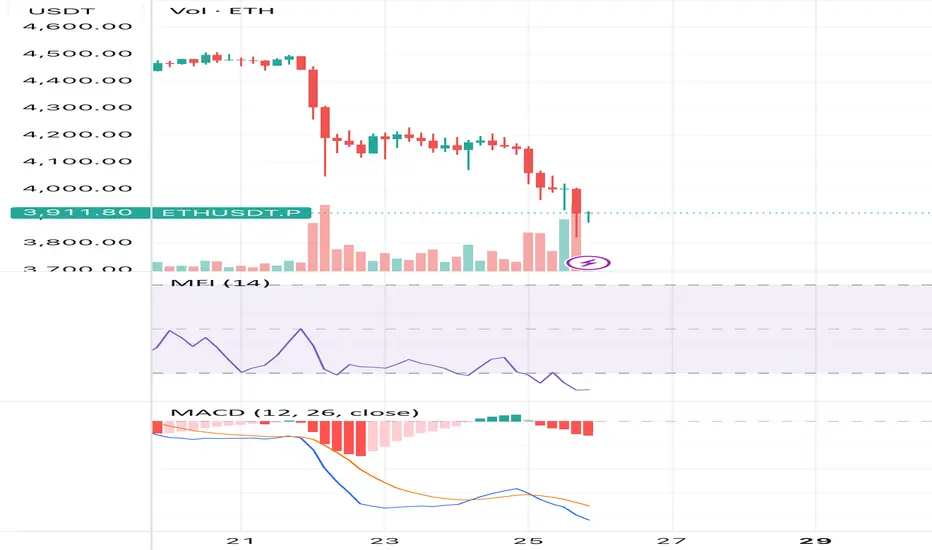
Activation trigger: 4h-close > 3977 (KC-Lower recap)Snapshot (last 4h-candle) — with the meaning of each indicator
• Price: ~3910.5 — current base point.
• VWAP (entire period): ~4245.2; z(Price−VWAP) ≈ −2.72 — price is significantly lower than "fair" (by VWAP), deviation is stronger than usual → increased probability of average return.
• aVWAP (anchors): start 4245.2, 60d 4256.0, from swing low 4036.6, from swing high 4020.0 — below swing anchors ⇒ sellers are locally dominant; below global (start/60d) ⇒ the cycle is still under pressure.
• Donchian 20: High 4228.8 / Mid 4025.1 / Low 3821.3 — boundaries of the local trading frame; Mid is often the target of rotation.
• Donchian 55: High 4643.7 / Mid 4232.5 / Low 3821.3 — "higher" range; breaking Mid changes the balance.
• Volume Profile (~60d): POC ~4490.5, VAL ~3627.2, VAH ~4778.2 — we are far below POC, inside the value-area; POC is a "magnet" for returns.
• HVN (volume nodes): ~4275–4420 and 4538–4610 (stable supply/demand zones).
• LVN (thin spots): ~3939, 4059–4107, 3723, 3435–3531 (slippery acceleration corridors).
• RSI(14): ~16.3 — deep oversold; often anticipates a rebound (but not always immediately in a strong trend).
• MFI(14): ~8.5 — oversold, taking into account volume; reinforces the thesis about a technical bounce.
• CMF(20): ~−0.06 — light capital outflow; for a stable reverse, you need ≥0.
• MACD(12/26/9): line −98.6 < signal −85.5, hist. −13.2 — bearish impulse is still active, the histogram is shrinking → impulse weakening.
• ADX/DMI(14): ADX ~63.0; +DI ~3.4 / −DI ~42.8 — very strong downtrend (−DI ≫ +DI).
• ATR(14): ~81.8$ — characteristic 4h swing; used for buffers.
• Keltner: Upper 4285 / Mid 4131 / Lower 3977 — the price is below KC-Lower: statistically, this is the mean-reversion zone to Mid (if the market makes a level recap).
• Bollinger(20,2): Upper 4291 / Mid 4126 / Lower 3960 — below BB-Lower; mean-reversion to 4126 is likely when the trend weakens.
• BB-Squeeze: OFF — no squeeze; volatility is already open.
• z(Price−VWAP) ≈ −2.72 — the "discount" to VWAP is abnormally large → extreme on the selling side.
• OBV z-scores: z50 −1.98 / z100 −2.56 / z200 −2.93, OBV ROC(10) ≈ −0.16 — volume background for the fall (distribution), no fresh influx of buyers is visible.
• Open Interest: ~1.05M, z(168) ≈ −0.07, ROC(5/10) ≈ +0.05/+0.05 — moderate set of positions on the decline (it looks like shorts were added); this strengthens trend continuations, but also creates fuel for short-squeeze at the recap.
Latest divergences (auto-detector)
• RSI: bullish on Aug 18 07:00 → Aug 19 03:00, bearish on Aug 24 03:00 → Aug 24 19:00
• MACD: bullish on Sep 8 19:00 → Sep 9 15:00, bearish on Sep 15 23:00 → Sep 17 07:00
• OBV: bullish 7 Sep 19:00 → 8 Sep 07:00, bearish 15 Sep 23:00 → 17 Sep 07:00
• MFI: bullish 7 Sep 19:00 → 8 Sep 07:00, bearish 10 Sep 15:00 → 11 Sep 07:00
⸻
What does it mean now
1. Mode: an extremely strong downward trend (ADX>60), with RSI/MFI in deep oversold, and the price below KC/BB-Lower and significantly below VWAP → a technical rotation towards the averages is statistically imminent; without confirmation, the market may still "slide along the lower edge."
2. Profile: under the upper HVN and significantly lower than POC ~4490 → KC/BB-Mid (≈4130) and Donch-20 Mid (4025) will act as a magnet on a stable recap round; above is 4232 (Donch-55 Mid).
3. Derivatives: OI slightly ↑ on red bars and OBV-z strongly neg. — downward extensions are possible, but with the first powerful recap, there is a chance for a short-squeeze.
⸻
Key levels
Resistance: 3977 (KC-Lower) → 4025 (Donch-20 Mid) → 4126/4131 (BB/KC-Mid) → 4232 (Donch-55 Mid) → 4285/4291 (KC/BB-Upper) → HVN-cluster 4275–4420 → 4490 (POC).
Supports: 3960 (BB-Lower) → 3939 (LVN) → 3821 (Donch-Low 20/55) → 3723 (LVN) → 3627 (VAL) → 3531/3459/3435 (LVN-pockets).
⸻
Scenarios and triggers (not the financial council)
A) Basic - rotation to the middle (4025 → 4126/4131)
Status: not activated yet (close < KC-Lower).
• Activation trigger: 4h-close > 3977 (KC-Lower recap) and better > ~4018 (KC-Lower + 0.5×ATR, ATR≈81.8), with RSI > 25–30, MFI > 20, hist. MACD↑, CMF → 0.
• Targets: 4025 → 4126/4131 → 4232 on impulse.
• Invalidator: return < 3977 after recap, especially if OI ROC+ is on a red candle and OBV z50 ≤ −2.0.
B) Continuation of the downward trend
• Trigger: 4h-close < 3821 (Donch-Low), ADX ≥ 40, OBV z50 ≤ −2.0, OI ROC+ on the fall.
• Targets: 3723 (LVN) → 3627 (VAL) → 3531/3459/3435 (LVN-pockets).
• Invalidator: fast return > 3977 and hold.
C) Short-squeeze (acceleration up)
• Trigger: impulse break and hold > 4232 (Donch-55 Mid) or > 4285/4291 (KC/BB-Upper) when OI decreases and OBV increases.
• Targets: HVN 4275–4420 → 4490 (POC) → 4643 (Donch-55 High) on development.
• Invalidator: fake breakout with return < 4130.
⸻
Tactics (example of logic)
• Impulse long (on the base): after closing > 4018. Partial fixation at 4025, main fixation at 4126/4131; then, trail to 4232. Stop under 3977 (or local minimum of the recap) with a buffer of 0.5×ATR (~41$).
• Reversal long (conservative): from KC-Lower/BB-Lower 3977/3960 only when demand reacts (RSI/MFI up, CMF→0/+, hist. MACD is shrinking). Targets 4025 → 4130.
• Contra-trend short: on rejection 4126/4131 → 4232 at RSI<50, hist. MACD↓, OI ROC+ — targets 4025 → 3977; stop — over 4235–4240.
⸻
Briefly: what to expect
The basic setup is a technical rotation up (to 4025 → 4130), but it will turn on only after a recap > 3977 / better > 4018.
• We will confirm the recap → a logical move to Mid-am (4126/4131), with strength to 4232.
• We will break through 3821 on a growing OI/weak OBV → continuation down to 3723 → 3627 → 3530+
USDTETH.P trade ideas
ETHUSDTHello every one🖐🏻
Chart is clear , demands area is in the table ,
Entry points for holders and futures traders is on ,( green sign)
Stop loss is under second area 🍌
Good luck and get rich all of you 💵🔥👑

#ETHUSDT 4H ChartPrice is currently ranging inside the 6h supply zone after getting rejected from the 100MA. MACD is showing bullish weakness, RSI is bought and EMAs are neutral. Price needs to break and close above this supply zone in order to expect further bullish movements towards the 6h supply at $4,450.

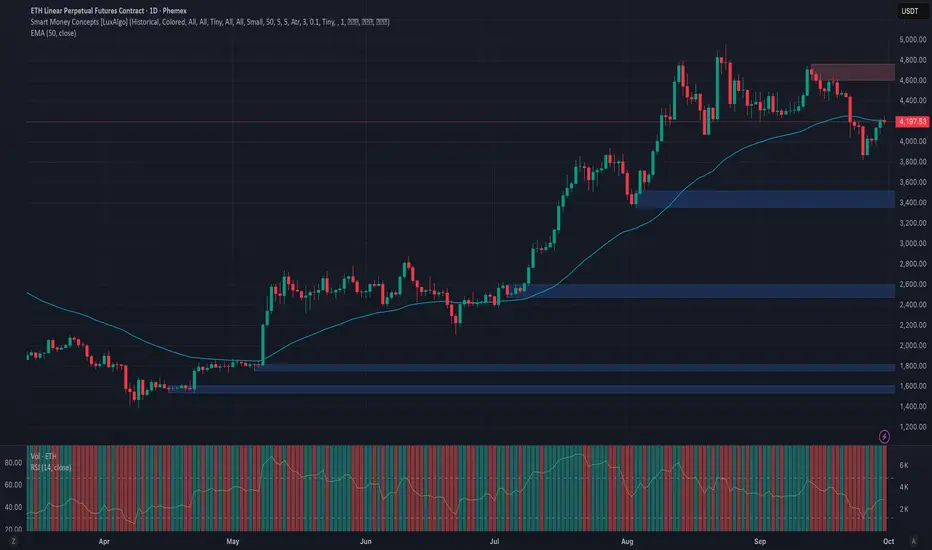
Phemex Analysis #107: Pro Tips for Trading Ethereum (ETH)Ethereum (ETH) has pushed back into the spotlight after shaking off early‑summer weakness and reclaiming the psychological $4,000 handle. With price now hovering near $4,200, buyers have stepped back in and the daily chart shows a clean sequence of higher lows—story beats that often precede a decisive move. The question on every trader’s mind: does ETH press higher from here, or does it need one more reset before the next leg?
Possible Scenarios
1) Bullish Breakout — momentum carries above nearby supply
If ETH can extend above the immediate supply zone (watch the $4,300–$4,350 band) on rising volume, a trend continuation opens toward $4,500 and a stretch into $4,800.
Pro Tips:
Entry: Look for a strong daily close through $4,350 or a break‑and‑retest that holds as support.
Risk: Initial stop below the breakout zone (~$4,000), then trail under higher lows.
Profit‑taking: Scale out into $4,500 and $4,800 while leaving a runner if momentum expands.
2) Range & Accumulation — base building above $4,000
ETH may continue to coil between $4,000 support and $4,350 resistance while the market digests macro cues and liquidity rotates across majors.
Pro Tips:
Plan the box: Accumulate near $4,000, lighten up into $4,300–$4,350.
Avoid the middle: Wait for edges; don’t chase mid‑range noise.
Watch volume: Expansion at range edges often telegraphs the break direction.
3) Bearish Pullback — liquidity sweep into deeper supports
Failure to hold $4,000 on heavy sell volume invites a deeper flush toward $3,750 and, in a heavier risk‑off tape, $3,500.
Pro Tips:
Defense first: Cut risk on a decisive daily close below $4,000.
DCA with discipline: Long‑term bulls can consider staggered bids only after stabilization (shrinking candles, waning sell volume, higher‑low attempts) near $3,750 / $3,500.
Re‑entry tells: Look for momentum divergences or a strong reclaim of $4,000 to re‑engage.
Conclusion
ETH sits at a pivotal zone with a clear if/then map:
If $4,350 breaks and holds → ride the trend toward $4,500–$4,800.
If the range persists → harvest the $4,000–$4,350 box with tight risk.
If $4,000 fails → wait for stabilization at $3,750 / $3,500 before redeploying.
Anchored by deep liquidity, relentless builder activity, and a maturing staking and L2 ecosystem, Ethereum remains the market’s bellwether. Trade the levels, respect the tape, and let structure—not emotion—drive your decisions.
🔥 Tips:
Armed Your Trading Arsenal with advanced tools like multiple watchlists, basket orders, and real-time strategy adjustments at Phemex. Our USDT-based scaled orders give you precise control over your risk, while iceberg orders provide stealthy execution.
Disclaimer: This is NOT financial or investment advice. Please conduct your own research (DYOR). Phemex is not responsible, directly or indirectly, for any damage or loss incurred or claimed to be caused by or in association with the use of or reliance on any content, goods, or services mentioned in this article.
ETHDCA zone 4100-4000 , Targeting 4384. Losing the 4150 area could potentially lead us down to the lower range where steeper liquidity is. considering BTC will be bouncing from 110k to 114k.

#ETHUSDT 4H ChartPrice is still consolidating with no major changes. MACS is neutral, RSI is sold and EMAs are turning bearish. Price needs to break and close above the resistance at $4,275 in order to expect further bullish movements. Waiting for confirmation.

ETH Update📊 Current Setup
ETH’s just floatin’ in consolidation mode 😴. But zooming out on the higher TFs, the tide looks like it’s leanin’ toward an upward retrace 🌊.
🚦 Scenarios
👉 If this range breaks to the upside, first target’s hangin’ around $4400 🎯.
👉 If not, we’re stuck in chop city — no clean wave, no clean ride.
🧭 My Take
Patience = profits 💯. Sometimes the best move is lettin’ the chart tell its story instead of forcing a trade.
❓ What’s Your Read?
You think ETH’s ready to break out, or do we drift sideways longer? Drop your vibe below 👇

Ethereum (ETH): EMAs Have Been Broken | RSI Oversold | Bullish!ETH has broken the lines of EMAs, which have been long-time trend holders, yet this has to be done one way or another to sweep the liquidity from the markets.
Now that is past us,. We are seeing some signs of recovery, where candles are forming some kind of market structure break and taking into consideration that RSI is oversold, EMAs had a sharp breakdown without any retest, and the fact that we are in a bull market overall is a strong sign of potential recovery to happen so that's what we are looking for—the game plan remains the same!
Swallow Academy

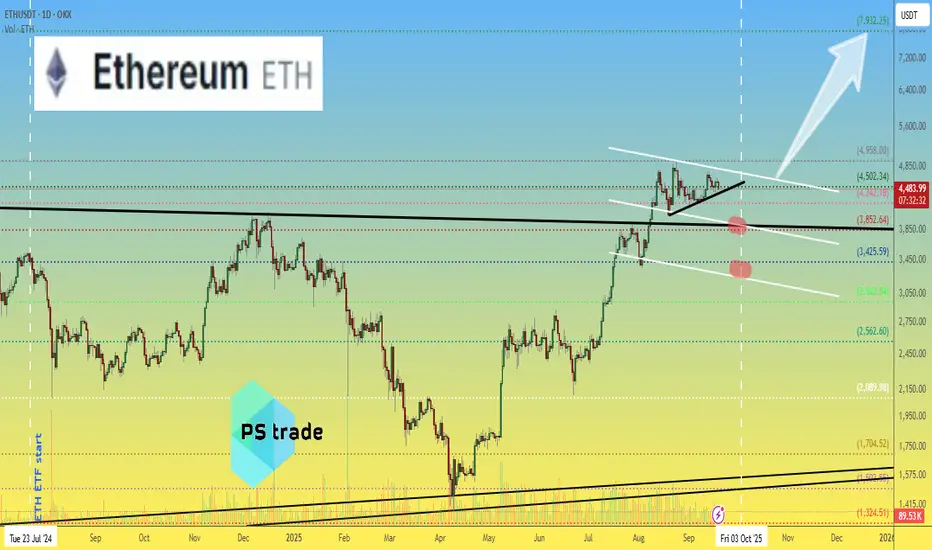
ETH ANALYSISETH has broken above the long-term trendline, a major structural shift on the weekly chart.
From here, I think price may pull back to retest the trendline along with the bull market support band.
If that retest holds and momentum stays constructive, ETH could bounce strongly and eventually push toward making a new all-time high.
🎯 Conclusion: My view is bullish in the bigger picture — I expect ETH to retest the trendline and bull market support band before attempting a major breakout to new highs.

ETH this week: stabilization after liquidations and ETF flows inFundamental approach
- ETH prices slipped this week amid a broad crypto pullback following a weekend wave of leveraged liquidations and profit-taking, even as prior spot ETF inflows and easing Fed policy supported risk appetite earlier in the week. Sentiment was volatile as traders digested mixed ETF flow signals and macro easing after the Fed's rate cut.
- The main impacting factors included a reported $1.5B in crypto long liquidations, which are pressuring majors. ETH prices posted their weakest two-day stretch since late Aug as risk unwound into Monday's session. Offsetting factors were mid-Sep net inflows into US spot ETH ETFs, led by BlackRock's product, and growing anticipation for Dec's Fusaka upgrade aimed at scaling Layer 2 data capacity.
- In the near term, ETH could stabilize if ETF flows remain favorable and macro conditions stay supportive; however, further deleveraging and data-sensitive risk sentiment could keep swings elevated. Upcoming catalysts include continued daily ETF flow prints, developer communications around the Fusaka timeline, and features that may influence medium-term adoption.
Technical approach:
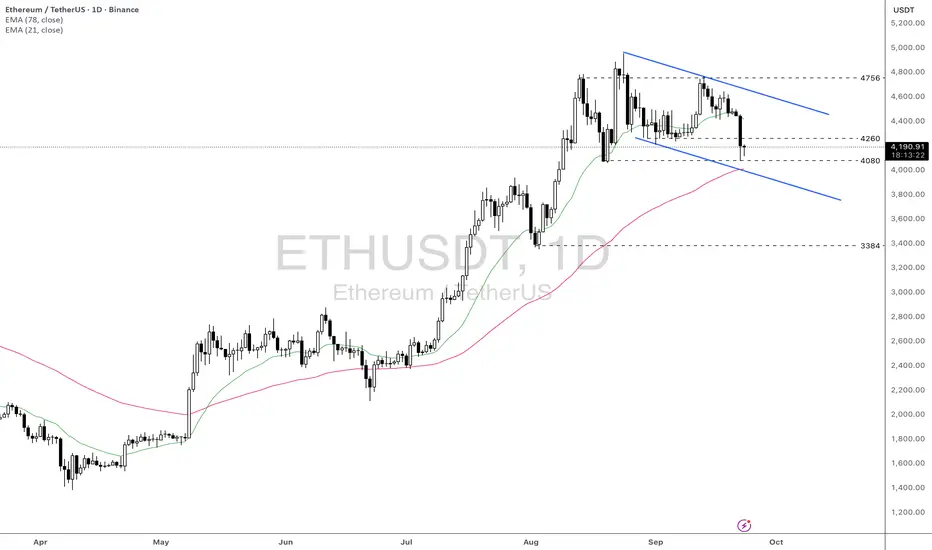
- ETHUSD is forming a lower high and lower low pattern within the defined range of 4080-4756. The price is awaiting a clear breakout to determine the upcoming trend.
- If ETHUSD breaks below the support at 4080, EMA78, and the descending channel's lower bound, the price may retest the following support at 3384.
- On the contrary, closing above 4260 may help ETH prices gain momentum to retest the descending channel's upper bound.
Analysis by: Dat Tong, Senior Financial Markets Strategist at Exness
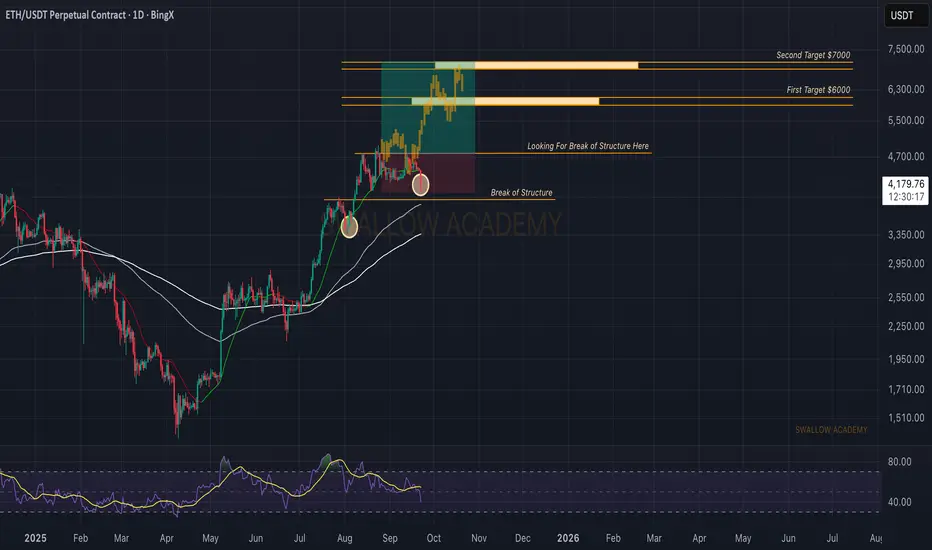
Ethereum (ETH): Bloody Hell, What a Sharp Start of MondayEthereum is showing similarities to the earlier push where we saw a shakeout (marked in the previous circled zone) before continuation to the upside. Currently, we’re seeing another break of structure, but as long as price holds above EMAs, the setup remains bullish. This could very well be another trap before the next leg up. First target stays $6,000, with the second target at $7,000 if buyers maintain control and secure higher levels.
Swallow Academy
ETH New Update (4H)This analysis is an update of the analysis you see in the "Related publications" section
Honestly, as you know, the market had been ranging for several days without much movement. On the chart, we had signs of a drop, but the drop didn’t happen, and instead the market dropped in a way that was shown.
Considering that the demand zone has held and the market is still ranging, we can return to the scenario of (this analysis () and expect to see some recoveries from Ethereum.
Either Ethereum can get rejected from the identified supply zone, or it can make a new all-time high afterwards.
For risk management, please don't forget stop loss and capital management
When we reach the first target, save some profit and then change the stop to entry
Comment if you have any questions
Thank You

Ethereum ETH Price Outlook — Key Levels to WatchCRYPTOCAP:ETH continues to hold strong momentum, with OKX:ETHUSDT showing solid support.
A correction toward $3775–3850 would already be considered significant.
A deeper pullback into the $3250–3450 zone could offer attractive long-term entries.
With current conditions, further downside below this range looks less likely.
🤔 Do you expect #Ethereum to retest lower levels, or are we preparing for new highs?
______________
◆ Follow us ❤️ for daily crypto insights & updates!
🚀 Don’t miss out on important market moves
🧠 DYOR | This is not financial advice, just thinking out loud.
Ethereum at Weekly Supply Zone – Possible Drop AheadHello everybody,
Price is currently at the weekly supply zone.
It has broken an upward trendline and pulled back to retest it.
A decline from this area is expected.
The most likely target is the nearest demand zone, around 3800.
Manage your risk and trade safe!

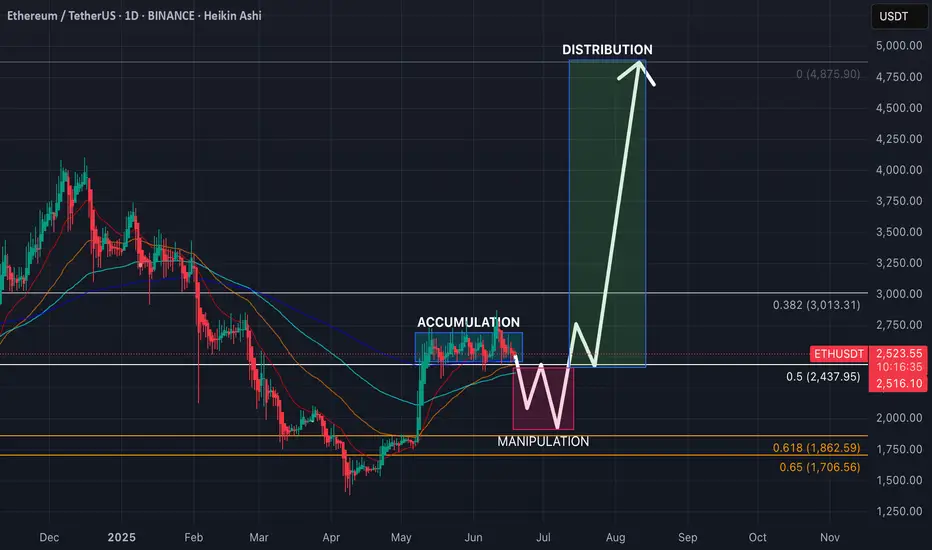
ETH: 6th consolidation week, AMD!?Ethereum is super slow these days, ranging tightly between $2430 and $2800 for weeks after a recovery. Current price action shows signs of preparation for the next BIG move, but in what side!?!!
Let’s break this down using the AMD model:
🔸 Accumulation
We saw ETH bottoming out in April after a deep correction. Since then, price reclaimed the 200 EMA and consolidated just above the 0.5 Fib level at $2437. This horizontal zone has been the accumulation range base.
🔸 Manipulation
Currently, ETH is testing the lower part of this range. Based on the chart structure, a possible liquidity squeeze breaking $2437 (mid-level) so we expect bearish trap for late sellers and non-believers before a viiolent reversal. This would be the classic “spring” move often seen in Wyckoff chart structures.
🔸 Distribution (later stage)**
If (or when) ETH breaks above $2800 and gets new attention with strong volume, this can lead to a mind blown fuses expansion — targeting the psychological $3000 and after recovery to previous ATH zone. Previous ATH at $4875 is the main target. Reasonably, this would be the final stage of distribution before a probable pump and altseason madness starts. But we are far for that right now, expect it not earlier than mid-autumn.
🧠 Key Technicals:
Okay, my Heikin Ashi candles show weakening — which means that we are close to the start of the Manipulation phase.
RSI pulling back, resetting momentum for the next move.
Fibonacci zones:
0.5 = $2437
0.618 = $1862
0.65 = $1706
🔮 Trade Idea (not financial advice):
A fake move below $2437 followed by fast and immediate recovery would be an ideal long entry.
Cancel trade if daily close below $1860, we can get lower this time.
TP? Well, depends on your belief. If btc made almost 2x from previous high, $3000 / $3500 / $4000 / $4500 / $5000 could be good? ETH could see even 8-8.5k this cycle, but its super positive outlook on current market structure.
📊 Summary:
ETH is showing classic AMD structure:
Accumulation (in progress for 6 weeks, 6 fn weeks!) ⏳
Manipulation (going down) 📉
Distribution (recovery + growth) 🚀
Some while ago, ETH was already playing simillar games, so why it should be different this time?
Breakout will come only after weak hands are shaken out, only after retail traders will sh*t their pants we will see growth.
Hopefully we will see immediate growth from current levels, but I'm more realist this time.
Ciao!
Ethereum (ETH): Nothing Is Lost Yet | Double Bottom | Bullish!The game plan remains the same; we are looking for a smaller MSB and then a reclaim of $4,400 before a new ATH.
Yesterday we had another smaller sell-side dominance wave, but buyers took back control pretty quickly, which resulted in a long wick and established a solid support zone (just like Bitcoin did).
Swallow Academy

Long trade
30min TF overview
Pair: ETHUSDT
Direction: Buyside trade
Date/Session: Fri 19th Sept 2025, NY Session PM
Timeframe: 30-Min
🔹 Trade Details
Entry: 4461.47
Profit Level: 4855.75 (+8.89%)
Stop Level: 4416.04 (-1.00%)
Risk-Reward (RR): 8.59
🔹 Technical Structure
Fair Value Gaps (FVGs):
Overhead FVGs at ~4655 – 4855 are acting as a potential magnet for liquidity.
Liquidity Levels:
Clear sweep of prior lows around 4460 (stop hunt/liquidity grab).
Buyside liquidity resting above 4650–4700.
Order Blocks / Demand Zones:
Strong demand block at ~4450–4460 region, now acting as support.
🔹 Indicators
RSI: Deeply oversold (below 30), hinting at bullish reversal probability.
Volume: Large spike at lows, confirming stop run and potential smart money entry.
Moving Averages: Price reclaiming short-term EMA, indicating early momentum shift.
🔹 Narrative / Trade Rationale
Market engineered a stop hunt into demand at 4460 before reversing.
High volume and RSI oversold strengthen the buy-side reversal case.
The trade aims to capitalise on the move back into inefficiencies (FVGs) left behind by the previous sell-off.

Ethereum (ETH): Failed To Breakout | Waiting For MomentumEthereum is still pressing right against the breakout zone, but buyers haven’t secured it yet. We’re seeing rejection wicks near resistance, showing clear hesitation in the market. As long as the price holds above the lower channel and EMAs, the structure remains bullish. A confirmed breakout here could open the path toward $7,000 first, with $9,000 as the major target.
Swallow Academy

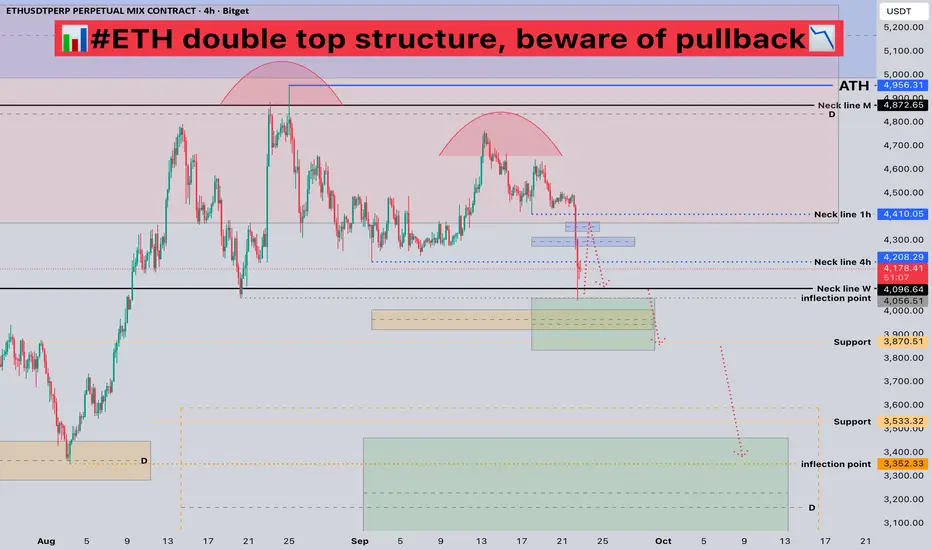
#ETH Double Top Structure, Beware of Pullback📊#ETH Double Top Structure, Beware of Pullback📉
🧠From a structural perspective, we've formed a bearish double top structure within the red target zone, so be wary of a deeper pullback.
➡️After today's plunge, we retested the weekly neckline support. We're currently in a rebound phase and have encountered resistance at the 4H neckline. Don't chase the rally here! Strong resistance lies around 4300-4400. If price reaches this level, look for shorting opportunities.
🤜If you like my analysis, please like 💖 and share 💬
BITGET:ETHUSDT.P
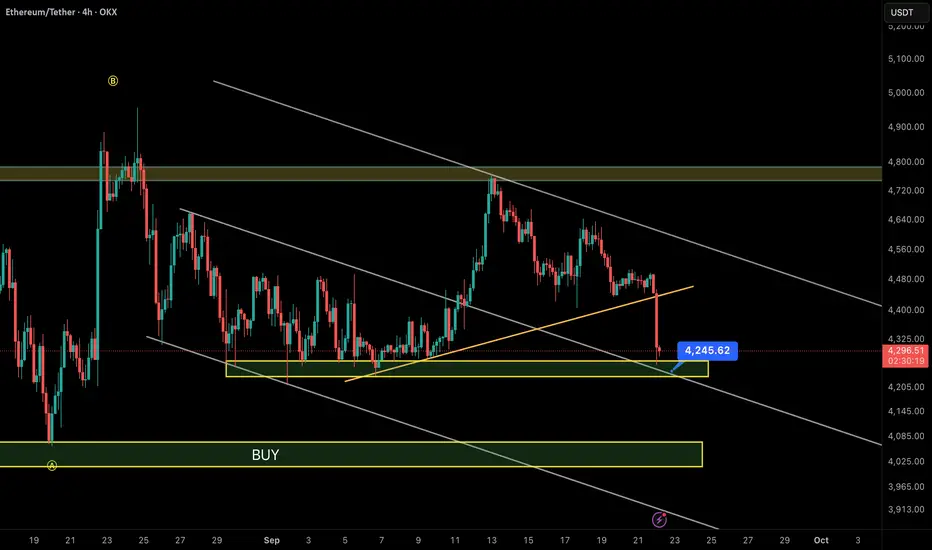
Ethereum at Critical Support – What’s Next?📊 ETH/USDT – 4H Chart Analysis
1️⃣ Descending Channel:
Ethereum is still moving inside a clear descending channel. Sellers remain in control as every rally to the channel top has been rejected.
2️⃣ Trendline Break:
The short-term ascending trendline (orange) has just been broken with strong selling pressure, dragging the price into the $4,200 – $4,250 support zone.
3️⃣ Key Support Zone:
The first major support lies at $4,200 – $4,250. If this level holds, ETH could see a short-term rebound toward $4,400 – $4,600.
4️⃣ Main Buy Zone:
If $4,200 fails, the next strong demand zone sits at $3,950 – $4,100, aligning with the lower boundary of the descending channel. This is where stronger buying interest is expected.
5️⃣ Resistance Levels:
• Near-term: $4,450 – $4,600
• Major: $4,750 – $4,800
⚖️ Summary:
• Bullish scenario: Holding $4,200 → bounce to $4,400 / $4,600.
• Bearish scenario: Losing $4,200 → drop to $4,000 – $3,950 (main BUY zone).
👉 At this stage, trading in the middle of the channel is risky. Safer entries come either near $4,000 – $4,100 or after a confirmed breakout above $4,600.
Showing second chance wayching multi timeframe RSI'sShowing second chance wayching multi timeframe RSI's - More of swing ideas using Price Action Reader

ETH 6K to 8K !? My analysis atm for ETH
Possible to bounce right back to ATH and price discovery mode to 6K hopefully 8K+
What ya all think, drop it bellow ?

Correction Complete: New Range approachingBoth BTC and ETH and lots of other coins are done.
There will be some outliers.
A new range with breakouts and breakdowns above and below 4k would make a lot of people lose money.
I expect sideways in this range for some time.
Levels of interest are 3606, 3839, 3865
