US OIL LONG RESULT US OIL price was consolidating inside a bullish pennant from which I took the long trade to the major resistance and it broke out as expected to the upside but didn't reach the major TP, but I managed to close before the tumble down with some good profits.
USOIL trade ideas

WTI LONG SETUPPrice manage to find support strong enough to bounce the relentless fall, climb to nearest resistance is active

WTI falls after US slaps 50% tariff on India over Russian oilWTI oil prices have dropped from $65 to around $62.80 as markets react to new US tariffs on India, triggered by India’s ongoing oil trade with Russia. These tariffs, along with threats of even higher tariffs on China, are weighing on global demand and pushing oil prices lower. Meanwhile, Iran’s oil production has hit multi-year highs, adding more supply to the market and reinforcing the bearish trend.
Technically, oil has broken below a key Fibonacci support level, signalling a deeper pullback. If prices fall below $62, further downside toward $57 is possible. Upside moves may be short-lived unless there’s a major geopolitical shock, such as an escalation in the Russia-Ukraine conflict. For now, both the macro environment and technical signals indicate continued pressure on oil prices.
This content is not directed to residents of the EU or UK. Any opinions, news, research, analyses, prices or other information contained on this website is provided as general market commentary and does not constitute investment advice. ThinkMarkets will not accept liability for any loss or damage including, without limitation, to any loss of profit which may arise directly or indirectly from use of or reliance on such information.

USOIL SENDS CLEAR BEARISH SIGNALS|SHORT
USOIL SIGNAL
Trade Direction: short
Entry Level: 64.06
Target Level: 61.35
Stop Loss: 65.86
RISK PROFILE
Risk level: medium
Suggested risk: 1%
Timeframe: 12h
Disclosure: I am part of Trade Nation's Influencer program and receive a monthly fee for using their TradingView charts in my analysis.
✅LIKE AND COMMENT MY IDEAS✅

USOIL H4 | Bearish reversal offUSOIL has reacted off the sell entry, which acts as a pullback resistance that aligns with the 50% Fibonacci retracement and could drop from this level to the downside.
Sell entry is at 63.96, which is a pullback resistance that aligns with the 50% Fibonacci retracement.
Stop loss is at 65.00, which is a pullback resistance.
Take profit is at 61.80, which is a swing low support.
High Risk Investment Warning
Trading Forex/CFDs on margin carries a high level of risk and may not be suitable for all investors. Leverage can work against you.
Stratos Markets Limited (tradu.com ):
CFDs are complex instruments and come with a high risk of losing money rapidly due to leverage. 65% of retail investor accounts lose money when trading CFDs with this provider. You should consider whether you understand how CFDs work and whether you can afford to take the high risk of losing your money.
Stratos Europe Ltd (tradu.com ):
CFDs are complex instruments and come with a high risk of losing money rapidly due to leverage. 66% of retail investor accounts lose money when trading CFDs with this provider. You should consider whether you understand how CFDs work and whether you can afford to take the high risk of losing your money.
Stratos Global LLC (tradu.com ):
Losses can exceed deposits.
Please be advised that the information presented on TradingView is provided to Tradu (‘Company’, ‘we’) by a third-party provider (‘TFA Global Pte Ltd’). Please be reminded that you are solely responsible for the trading decisions on your account. There is a very high degree of risk involved in trading. Any information and/or content is intended entirely for research, educational and informational purposes only and does not constitute investment or consultation advice or investment strategy. The information is not tailored to the investment needs of any specific person and therefore does not involve a consideration of any of the investment objectives, financial situation or needs of any viewer that may receive it. Kindly also note that past performance is not a reliable indicator of future results. Actual results may differ materially from those anticipated in forward-looking or past performance statements. We assume no liability as to the accuracy or completeness of any of the information and/or content provided herein and the Company cannot be held responsible for any omission, mistake nor for any loss or damage including without limitation to any loss of profit which may arise from reliance on any information supplied by TFA Global Pte Ltd.
The speaker(s) is neither an employee, agent nor representative of Tradu and is therefore acting independently. The opinions given are their own, constitute general market commentary, and do not constitute the opinion or advice of Tradu or any form of personal or investment advice. Tradu neither endorses nor guarantees offerings of third-party speakers, nor is Tradu responsible for the content, veracity or opinions of third-party speakers, presenters or participants.

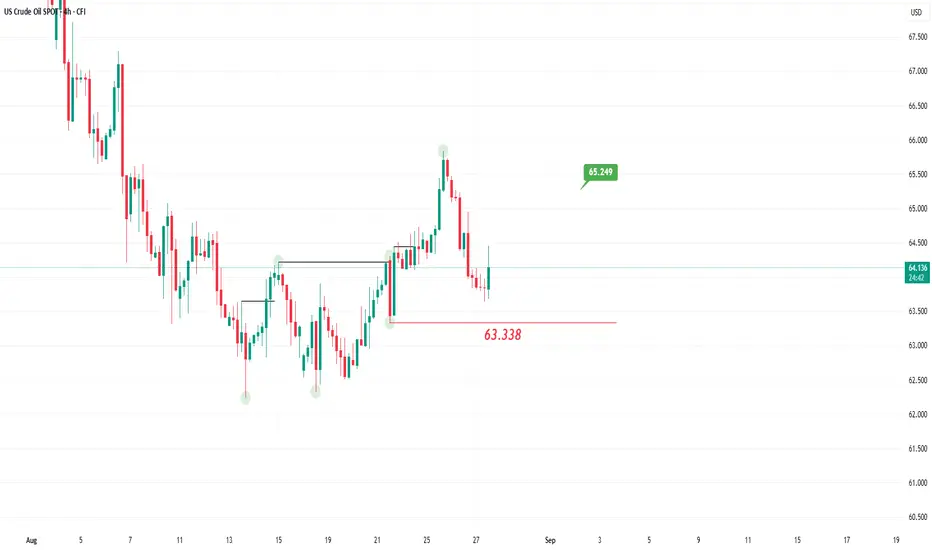
Oil at a Crossroads: Will $64 Spark a Rally or Trigger a Fall?Oil remains under pressure as geopolitical tensions have yet to yield a clear agreement between Russia and Ukraine, while tariffs could harm India’s economy, which was once the fastest growing in the world.
From a technical perspective, crude oil is trading in an overall uptrend, forming higher highs and higher lows. The current level of 64 is crucial, and prices could rise from here to target 65.24 as a short-term objective in the medium term.
However, a renewed decline breaking below 63.338 and forming a lower low on the four-hour chart would invalidate the bullish scenario and signal a return to a downtrend.
XTI/USD Analysis: Oil Price Falls 2.8% from This Week’s HighXTI/USD Chart Analysis: Oil Price Falls 2.8% from This Week’s High
As the XTI/USD chart shows, this morning (27 August) WTI crude oil is trading around the $63 level, although on Monday it climbed above $64.70. This means the price has retreated by approximately 2.8% from this week’s high.
The bearish momentum may be linked to the market’s reassessment of geopolitical risks. According to Reuters, US Special Representative Steve Witkoff stated that:
→ he will meet with a Ukrainian delegation in New York this week;
→ the US administration is also in talks with Russia, seeking to bring the war to an end.
He also noted that Washington is striving for de-escalation in the Middle East. We could assume that market participants are pricing in the possibility that these efforts could lead to the easing of sanctions and reduce risks and restrictions in global oil trade.
Technical Analysis of the XTI/USD Chart
On 19 August, we highlighted that:
→ the August downtrend remained intact, though it appeared to be weakening;
→ bulls might exploit this situation and attempt to launch an attack.
Indeed, since then the price rallied to a peak near $64.80, forming an upward trajectory shown by the orange lines. However, at the start of this week, momentum shifted back to the bears, as evidenced by a series of bearish signals on the chart:
→ Yesterday, bulls attempted to resume the upward trend from the lower orange boundary but failed – this was reflected in a candlestick with a long upper shadow, touching the $64 level before reversing downwards.
→ Bears then built on this success, pushing the price below $63.50 (where the lower orange line had been positioned).
→ This morning, WTI is trading close to weekly lows, highlighting the bulls’ inability to counter the pressure.
As a result, bears have driven the price back into the descending channel that has been in place since the start of the month. Given the above, we could assume that the market may continue to develop bearish dynamics within this downward channel – with WTI potentially heading towards the red median line.
The forthcoming oil inventory report (due today at 15:30 GMT+3) might have a significant influence on how the situation unfolds.
This article represents the opinion of the Companies operating under the FXOpen brand only. It is not to be construed as an offer, solicitation, or recommendation with respect to products and services provided by the Companies operating under the FXOpen brand, nor is it to be considered financial advice.

Market Analysis: WTI Crude Oil Faces HurdlesMarket Analysis: WTI Crude Oil Faces Hurdles
Crude oil is showing bearish signs and might decline below $62.80.
Important Takeaways for WTI Crude Oil Price Analysis Today
- Crude oil prices failed to clear the $65.00 region and started a fresh decline.
- There was a break below a major bullish trend line with support at $64.00 on the hourly chart of XTI/USD.
WTI Crude Oil Price Technical Analysis
On the hourly chart of WTI Crude Oil, the price struggled to clear the $65.00 level and started a fresh decline below $64.50.
There was a break below a major bullish trend line at $64.00, opening the doors for more losses. The price dipped below the 50% Fib retracement level of the upward move from the $61.56 swing low to the $64.85 high.
XTI/USD even dipped below $63.50 level and the 50-hour simple moving average. The bulls are now active near $63.00. If there is a fresh increase, it could face a barrier near $63.70.
The first major resistance is near $64.10. Any more gains might send the price toward $64.85 and call for a test of $65.50. Conversely, the price might continue to move down and revisit the $62.80 support and the 61.8% Fib retracement.
The next major support on the WTI crude oil chart is $62.35. If there is a downside break, the price might decline toward $61.55. Any more losses may perhaps open the doors for a move toward $60.50.
This article represents the opinion of the Companies operating under the FXOpen brand only. It is not to be construed as an offer, solicitation, or recommendation with respect to products and services provided by the Companies operating under the FXOpen brand, nor is it to be considered financial advice.

# USOIL WTI Crude Oil Technical Analysis: Weekly Forecast# USOIL WTI Crude Oil Technical Analysis: Weekly Forecast
Current Price: $64.612 (As of August 30, 2025, 12:54 AM UTC+4)
Asset Class: USOIL / WTI Crude Oil Cash
Analysis Date: August 30, 2025
---
Executive Summary
WTI Crude Oil (USOIL) continues to navigate a complex fundamental landscape, currently trading at $64.612 per barrel amid significant bearish pressure. Recent market data shows crude oil fell to $64.04 on August 29, 2025, declining 0.87% from the previous session with a concerning 8.51% monthly drop and 12.93% year-over-year decline. Technical analysis reveals the commodity has broken below critical support levels around $65.00-66.00, with strong resistance encountered at the descending trend line near $65.27. Our comprehensive analysis indicates potential for further downside toward $58-60 zone, though geopolitical risks and OPEC+ production dynamics could trigger sharp reversals.
---
Multi-Timeframe Technical Analysis
Elliott Wave Analysis
WTI Crude Oil exhibits a complex corrective structure within a multi-year consolidation pattern:
Primary Count: Completing Wave C of larger degree ABC correction from 2022 highs
Wave Structure: Currently in final stages of 5-wave decline toward $58-62 target
Corrective Phase: Large degree consolidation between $60-85 range since 2022
Long-term Projection: Eventual breakout above $85 targets $110-120 by 2026-2027
Invalidation Level: Break below $55 would extend corrective phase significantly
Fibonacci Relationships: Current decline showing 1.618 extension characteristics
Wyckoff Market Structure Analysis
Oil demonstrates classic Wyckoff Distribution Phase completion with transition to Markdown:
Phase: Early Markdown Phase following Distribution completion
Volume Analysis: Increasing volume on declines indicating institutional selling
Price Action: Breaking support levels with follow-through selling
Composite Operator Activity: Smart money liquidating positions accumulated above $70
Market Character: Weak rallies met with fresh selling pressure
Re-accumulation Zone: $58-62 represents potential future accumulation area
W.D. Gann Comprehensive Analysis
Square of 9 Analysis:
- Current price $64.612 positioned near 90-degree Gann support turning point
- Next major Gann level: $58.50 (180-degree decline from recent high)
- Time and price convergence: September 21-28, 2025 (Autumn Equinox influence)
- Critical Gann squares: $62.41, $58.50, $54.76 (geometric decline sequence)
Angle Theory Application:
- 1x1 Declining Angle Resistance: $67-68 (primary downtrend line)
- 2x1 Accelerated Decline: $60-62 (next support cluster)
- 1x2 Support Angle: $55-58 (major correction boundary)
- 1x4 Long-term Support: $48-52 (crisis scenario support)
Time Cycle Analysis:
- 84-day cycle low expected: Mid-September 2025
- Seasonal Gann Pattern: September-October typically sees oil volatility
- Major time window: October 5-15, 2025 (potential reversal period)
- Annual cycle: Q4 seasonal strength often supports energy complex
Price Forecasting & Time Harmonics:
- Immediate support: $62-64
- Primary target: $58-60
- Extended decline: $54-56
- Time harmony suggests potential reversal after October 8, 2025
Ranges in Harmony:
- Current range: $62-68 (breakdown phase)
- Next trading range: $55-65 (potential base formation)
- Long-term channel: $45-85 (multi-year consolidation)
---
Japanese Candlestick & Harmonic Pattern Analysis
Recent Candlestick Formations (Daily Chart)
Bearish Engulfing: August 26-27 confirming breakdown below $65 support
Long Upper Shadows: Repeated rejection at $65.50-66.00 resistance levels
Spinning Tops: Indecision candles around $64-65 zone
Volume Confirmation: Increasing volume on red candles, declining on green
Dark Cloud Cover: August 28-29 pattern confirming selling pressure
Harmonic Pattern Recognition
Bearish Gartley Completion: $68-70 zone (recent distribution area)
ABCD Extension: Active decline targeting $58-60 completion zone
Bearish Butterfly: Potential completion at $54-56 extreme target
Fibonacci Confluence: Multiple extension levels converging at $58.50
Advanced Harmonic Analysis
Three Drives Down: Developing pattern toward $58-60 target zone
Bearish Crab Formation: Long-term pattern suggesting $52-55 targets
AB=CD Equality: Price and time relationships supporting $58 target
Cypher Pattern: Potential bullish reversal consideration at $58-60
Bull Trap vs Bear Trap Assessment
Current Market Structure:
Bear Trap Probability: 25% - Potential false breakdown below $62 support
Bull Trap Scenario: 75% - Any rally above $67 likely to be sold aggressively
Key Levels: Sustained break below $60 confirms bearish continuation
Volume Pattern: High volume selling indicates genuine breakdown rather than trap
---
Ichimoku Kinko Hyo Analysis
Current Cloud Structure (Daily Chart)
Price Position: Below Kumo cloud indicating bearish trend dominance
Tenkan-sen (9-period): $65.24 (short-term dynamic resistance)
Kijun-sen (26-period): $67.18 (medium-term resistance level)
Senkou Span A: $66.21 (leading span A - resistance)
Senkou Span B: $69.45 (leading span B - major cloud resistance)
Chikou Span: Below historical price action confirming bearish sentiment
Future Kumo Analysis (26 periods ahead):
- Thickening cloud structure indicating strong resistance above
- Future resistance zone: $65-70 (forward-looking cloud base)
- Cloud twist not anticipated until late Q4 2025
Ichimoku Trading Signals
TK Cross: Tenkan below Kijun (active bearish signal)
Price vs Cloud: Below cloud with downward momentum
Chikou Span: Clear below price history (bearish confirmation)
Cloud Breakout: Failed to maintain position above cloud support
---
Technical Indicators Comprehensive Analysis
RSI (Relative Strength Index) Multi-Timeframe
Daily RSI: 38.6 (oversold territory but not extreme)
Weekly RSI: 42.3 (bearish momentum with room for decline)
4H RSI: 35.2 (approaching oversold with potential bounce)
RSI Divergence: No bullish divergence detected, momentum remains bearish
RSI Support: 30 level crucial for preventing deeper decline
Bollinger Bands Analysis
Current Position: Price near lower band ($62.50 level)
Band Width: Expanding indicating increasing volatility
%B Indicator: 0.18 (near lower extreme, potential bounce zone)
Band Squeeze: Recent expansion from squeeze formation
VWAP Analysis (Volume Weighted Average Price)
Daily VWAP: $65.47 (dynamic resistance level)
Weekly VWAP: $67.23 (key resistance zone)
Monthly VWAP: $69.18 (major resistance level)
Volume Profile: Highest volume acceptance at $66-68 zone now resistance
Moving Average Structure
10 EMA: $65.89 (immediate dynamic resistance)
20 EMA: $67.12 (short-term resistance)
50 SMA: $69.45 (intermediate resistance)
100 SMA: $71.23 (key resistance level)
200 SMA: $73.87 (major secular resistance)
Moving Average Signals:
- Perfect bearish alignment across all timeframes
- Death Cross pattern established (50/200 SMA)
- Price trading below all major moving averages
---
Support & Resistance Analysis
Primary Resistance Levels
1. R1: $66.50-67.00 (immediate technical resistance and daily VWAP)
2. R2: $68.00-68.50 (previous support turned resistance)
3. R3: $70.00-70.50 (psychological and technical confluence)
4. R4: $72.00-73.00 (major moving average cluster)
5. R5: $75.00-76.00 (long-term resistance zone)
Primary Support Levels
1. S1: $62.50-63.00 (immediate Gann support and lower Bollinger Band)
2. S2: $60.00-61.00 (psychological and harmonic support)
3. S3: $58.00-59.00 (major Gann target and Elliott Wave projection)
4. S4: $55.00-56.00 (extended harmonic target)
5. S5: $52.00-54.00 (crisis scenario and long-term support)
Volume-Based Support/Resistance
High Volume Node: $66-68 (now major resistance zone)
Low Volume Gap: $60-62 (potential rapid movement area)
Volume Support: $58-60 (potential accumulation zone)
POC (Point of Control): $67.25 (maximum volume acceptance, now resistance)
---
Multi-Timeframe Trading Strategy Framework
Scalping Strategy (5M & 15M Charts)
5-Minute Timeframe Methodology:
Entry Signals: Short rallies to 20 EMA with RSI >65 in downtrend
Profit Targets: $0.30-0.50 per barrel per scalping trade
Stop Loss: $0.20-0.30 maximum risk per position
Volume Filter: Above-average volume required on breakdown continuation
Time Windows: Asian session 1:00-4:00 AM, London open 3:00-6:00 AM EST
15-Minute Scalping Framework:
Range Trading: Current range $63.50-65.50
Breakdown Strategy: Volume confirmation below $63.50 for continuation
Counter-trend: Fade rallies above $65.50 without volume
Risk Management: Maximum 3 positions simultaneously, 1:1.5 R:R minimum
Intraday Trading Strategies (30M, 1H, 4H)
30-Minute Chart Approach:
Trend Following: Short below EMA cluster ($65.50-66.00)
Pattern Trading: Bear flag and pennant formations
Target Methodology: Initial $62.50, extended $60-61
Risk Parameters: $0.80-1.20 stops, 2:1 reward-to-risk minimum
1-Hour Chart Strategy:
Momentum Trading: MACD bearish crossovers with histogram expansion
Resistance Shorting: Short entries from $66-67.50 zone
Support Testing: Monitor $62-63 area for breakdown continuation
Session Management: Focus on US trading hours 9:30 AM - 4:00 PM EST
4-Hour Swing Framework:
Cloud Strategy: Short on failed attempts to reclaim Ichimoku cloud
Elliott Wave: Ride Wave C completion toward major targets
Fibonacci Trading: Use 38.2% and 50% retracements for short entries
Hold Duration: 5-15 days for swing positions
Swing Trading Strategy (Daily, Weekly, Monthly)
Daily Chart Methodology:
Breakdown Strategy: Short on sustained breaks below $62 with volume
Bear Market Rallies: Short rallies to $67-69 resistance zone
Target Progression: $60 → $58 → $55 sequential targets
Position Management: Scale in on multiple timeframe confirmations
Weekly Chart Analysis:
Primary Trend: Strongly bearish below $70 weekly resistance
Swing Targets: $58-60 zone for major profit-taking
Risk Management: Weekly closes above $70 signal potential reversal
Monthly Chart Perspective:
Secular Range: Multi-year consolidation $45-85
Long-term Targets: $52-58 completion of corrective phase
Reversal Zone: $55-60 area for potential major low formation
---
Day-by-Day Trading Plan: September 2-6, 2025
Monday, September 2, 2025 (Labor Day - Reduced US Participation)
Market Conditions: Thin liquidity in US markets, focus on Asian/European sessions
Technical Setup:
Resistance: $66.00, $67.50, $68.50
Support: $63.00, $61.50, $60.00
Expected Range: $62.50-66.50
Trading Strategy:
Reduced Sizes: Holiday conditions warrant smaller positions
Range Strategy: Short rallies to $65.50-66.00, long support at $63.00
Gap Management: Monitor overnight developments in Middle East
Risk Focus: Geopolitical news sensitivity during thin trading
Tuesday, September 3, 2025
Market Outlook: Full participation returns, inventory data focus
Key Events & Strategy:
API Inventory: Tuesday evening crude inventory report
Technical Focus: $63 support test with volume analysis
Geopolitical Monitor: Middle East tensions and OPEC+ developments
Entry Strategy: Short $65-66.50 targeting $62-60
Risk Considerations:
- Inventory surprise potential for sharp moves
- Dollar strength impact on commodity complex
- Chinese demand data influence
Wednesday, September 4, 2025
Market Outlook: EIA inventory data and mid-week momentum
Strategic Framework:
EIA Report: Official US crude inventory data (10:30 AM EST)
Technical Pattern: Monitor bear flag completion below $63
Volume Analysis: Institutional participation on breakdowns crucial
Support Defense: $62 level critical for preventing accelerated decline
Trading Approach:
Pre-EIA: Light positioning due to event risk
Post-EIA: React to inventory data with appropriate sizing
Breakdown Play: Below $62 targets $60-58 zone
Thursday, September 5, 2025
Market Outlook: Weekly inventory impact and positioning for Friday
Key Considerations:
Inventory Digest: Market reaction to Wednesday's EIA data
Technical Levels: $60-61 major support zone testing
OPEC+ Watch: Monitor for any production policy signals
Dollar Correlation: USD strength continuing to pressure commodities
Execution Strategy:
Trend Continuation: Below $62 favors $58-60 targets
Counter-trend Risk: Any rally above $66 likely to be sold
Profit Management: Scale out at key support levels
Friday, September 6, 2025
Market Outlook: Weekly close significance and position squaring
Final Session Strategy:
Weekly Close: Below $62 very bearish, above $66 potentially bullish
Profit Protection: Secure gains from successful breakdown trades
Weekend Risk: Geopolitical and OPEC+ news flow considerations
Position Review: Maintain swing shorts with appropriate stops
Critical Levels:
Weekly Bearish: Close below $62
Weekly Neutral: $62-66 range
Weekly Bullish: Close above $66
---
Macroeconomic & Geopolitical Analysis
OPEC+ Production Policy Impact
OPEC+ production dynamics remain crucial for oil price direction. The group has left the future of production cuts uncertain after September, with OPEC+ plans to gradually ease 2.2 mb/d of voluntary production cuts by eight countries starting in April 2025. However, geopolitical tensions, such as U.S. pressure on countries like India to stop buying Russian oil, could lead to further changes in OPEC+'s production strategy.
US-India Tariff Impact
Recent geopolitical developments show significant market impact, with WTI oil prices dropping from $65 to around $62.80 as markets react to new US tariffs on India, triggered by India's ongoing oil trade with Russia. This demonstrates how trade policy directly affects oil pricing dynamics.
Supply-Demand Fundamentals
Market fundamentals show concerning trends with WTI fluctuating between $54 and $79 amid weak global economic growth, unstable demand in China, and lower production expectations by OPEC+. The EIA projects annual average crude oil production in 2026 will decrease 0.1 million b/d on average from the record in 2025.
Key Risk Factors
1. US-China Trade Relations: Demand destruction from economic slowdown
2. Middle East Tensions: Potential supply disruption premium
3. OPEC+ Policy Uncertainty: Production cut extension decisions
4. US Dollar Strength: Inverse correlation with commodity prices
5. Global Economic Growth: Recession fears impacting demand projections
---
Seasonal & Cyclical Analysis
Historical Seasonal Patterns
September Performance: Typically weak, hurricane season concerns
Q4 Seasonality: Mixed, depends on winter weather forecasts
Refinery Maintenance: September-October maintenance season reduces demand
Heating Oil Demand: October-November typically supports complex
Economic Cycle Positioning
Current Phase: Late cycle with demand concerns mounting
Inventory Cycle: Drawing season transitioning to building season
Refining Margins: Weak crack spreads indicating demand issues
Investment Cycle: Reduced capex affecting future supply growth
---
Bull Trap vs Bear Trap Detailed Analysis
Current Market Structure Assessment
Bull Trap Scenario (75% Probability):
Characteristics: Any rally above $67 likely false breakout
Volume Profile: Low volume on rallies, high volume on declines
Technical Setup: Failed reclaim of key moving averages
Fundamental Support: Weak demand and oversupply concerns
Target Failure: Rally stops at $68-70 resistance complex
Bear Trap Scenario (25% Probability):
Characteristics: False breakdown below $62 creating buying opportunity
Catalyst Required: Major geopolitical event or supply disruption
Volume Confirmation: High volume reversal from $60-62 support
Technical Reversal: Hammer or bullish engulfing at key support
Breakout Target: $70-75 following trap completion
Trap Identification Signals
Bull Trap Confirmation:
- Break above $67 on declining volume
- Immediate reversal within 2-3 trading sessions
- High volume selling on subsequent decline
- RSI failure to confirm new highs
Bear Trap Confirmation:
- Sharp spike down to $60-62 on high volume
- Quick reversal with gap up formation
- Volume expansion on recovery move
- Geopolitical catalyst supporting reversal
---
Risk Management Comprehensive Framework
Position Sizing Methodology
Scalping Trades: 0.5-1% account risk per trade
Intraday Positions: 1-2% maximum account risk
Swing Positions: 2-3% account risk per established position
Maximum Exposure: 6-8% total oil-related risk allocation
Stop-Loss Implementation
Scalping: $0.20-0.40 per barrel maximum
Intraday: $0.80-1.50 per barrel based on volatility
Swing Trading: Above key resistance levels ($68 for current shorts)
Technical Stops: Elliott Wave and pattern invalidation levels
Profit-Taking Strategy
Scaling Approach: 30% at first target, 40% at second, hold 30%
Trailing Stops: Implement after 2:1 favorable movement
Time-Based Exits: Close before major inventory reports
Pattern-Based: Honor harmonic and Elliott Wave completion zones
---
Weekly Outlook Probability Matrix
Bearish Scenario (Probability: 70%)
Primary Catalysts:
- Continued demand concerns from China and global slowdown
- Strong US Dollar pressuring commodities
- Technical breakdown below $62 support with volume
- OPEC+ production increase implementation
Price Objectives:
- Initial: $60-62
- Extended: $58-60
- Crisis: $54-56
Neutral/Consolidation Scenario (Probability: 20%)
Characteristics:
- Range-bound trading $60-67
- Mixed inventory data and economic signals
- Technical indecision at support levels
- OPEC+ policy uncertainty
Bullish Scenario (Probability: 10%)
Risk Factors:
- Major geopolitical event or supply disruption
- Significant inventory draw or refinery issues
- Technical reversal from $60-62 support zone
- Unexpected OPEC+ production cut extension
Upside Targets:
- Initial: $68-70
- Extended: $72-75
- Crisis Premium: $80+
---
Long-Term Strategic Outlook
Multi-Year Price Cycle
Oil appears to be in a multi-year consolidation phase between $45-85, with current weakness potentially setting up major low formation in the $55-62 zone for eventual breakout above $85 targeting $110-120 by 2026-2027.
Energy Transition Impact
Long-term demand concerns from electric vehicle adoption and renewable energy transition continue to cap oil prices, creating ceiling around $85-90 level for sustained periods.
---
Conclusion & Strategic Recommendations
WTI Crude Oil (USOIL) stands at a critical technical juncture near $64.61, exhibiting strong bearish momentum with potential for further decline toward the $58-60 zone. The confluence of technical breakdown, fundamental weakness, and geopolitical pressures suggests elevated probability for continued selling pressure.
Key Bearish Factors:
1. Technical Breakdown: Clear break below $65-66 support zone
2. Fundamental Weakness: Demand concerns and oversupply issues
3. Geopolitical Pressure: US tariff policies affecting global trade
4. Seasonal Factors: Refinery maintenance season reducing demand
Critical Monitoring Points:
1. $62 Support Level: Key defense line for bulls
2. Inventory Data: Weekly EIA reports for demand signals
3. OPEC+ Policy: Production cut extension decisions
4. Geopolitical Developments: Middle East tensions and trade policies
Strategic Recommendation:
Maintain bearish bias with tactical short opportunities on rallies to $66-68 resistance zone. Target $58-60 for major profit-taking while managing risk above $68. Any sustained move above $70 would negate bearish thesis and suggest major reversal beginning.
The September-October timeframe represents critical period for direction, with potential for either accelerated decline to $55 or major reversal from $58-62 support complex.
---
*This comprehensive analysis is provided for educational and informational purposes only. Oil trading involves substantial risk of loss and may not be suitable for all investors. Past performance does not guarantee future results. Always implement appropriate risk management and consult with qualified financial professionals before making investment decisions.*
---
For individuals seeking to enhance their trading abilities based on the analyses provided, I recommend exploring the mentoring program offered by Shunya Trade. (Website: shunya dot trade)
I would appreciate your feedback on this analysis, as it will serve as a valuable resource for future endeavors.
Sincerely,
Shunya.Trade
Website: shunya dot trade
Disclaimer: This post is intended solely for educational purposes and does not constitute investment advice, financial advice, or trading recommendations. The views expressed herein are derived from technical analysis and are shared for informational purposes only. The stock market inherently carries risks, including the potential for capital loss. Therefore, readers are strongly advised to exercise prudent judgment before making any investment decisions. We assume no liability for any actions taken based on this content. For personalized guidance, it is recommended to consult a certified financial advisor.

Bearish continuation?WTI Oil (XTI/USD) is rising towards the pivot and could reverse to the 1st support, which is a pullback support.
Pivot: 65.65
1st Support: 60.66
1st Resistance: 70.97
Risk Warning:
Trading Forex and CFDs carries a high level of risk to your capital and you should only trade with money you can afford to lose. Trading Forex and CFDs may not be suitable for all investors, so please ensure that you fully understand the risks involved and seek independent advice if necessary.
Disclaimer:
The above opinions given constitute general market commentary, and do not constitute the opinion or advice of IC Markets or any form of personal or investment advice.
Any opinions, news, research, analyses, prices, other information, or links to third-party sites contained on this website are provided on an "as-is" basis, are intended only to be informative, is not an advice nor a recommendation, nor research, or a record of our trading prices, or an offer of, or solicitation for a transaction in any financial instrument and thus should not be treated as such. The information provided does not involve any specific investment objectives, financial situation and needs of any specific person who may receive it. Please be aware, that past performance is not a reliable indicator of future performance and/or results. Past Performance or Forward-looking scenarios based upon the reasonable beliefs of the third-party provider are not a guarantee of future performance. Actual results may differ materially from those anticipated in forward-looking or past performance statements. IC Markets makes no representation or warranty and assumes no liability as to the accuracy or completeness of the information provided, nor any loss arising from any investment based on a recommendation, forecast or any information supplied by any third-party.

WTI Crude Oil – Range Support in FocusWe're waiting for price to reach the bottom of the range, and with a solid buy signal, we’ll consider going long.
However, since this level has been tested multiple times, it’s highly vulnerable to stop fishing — so caution is key.
As always, we’re ready for all scenarios:
If price breaks below, we’ll wait for a pullback to enter short.
But right now, we’re watching the range support for potential longs

USOIL Massive Long! BUY!
My dear subscribers,
This is my opinion on the USOIL next move:
The instrument tests an important psychological level 64.00
Bias - Bullish
Technical Indicators: Supper Trend gives a precise Bullish signal, while Pivot Point HL predicts price changes and potential reversals in the market.
Target - 64.22
My Stop Loss - 63.89
About Used Indicators:
On the subsequent day, trading above the pivot point is thought to indicate ongoing bullish sentiment, while trading below the pivot point indicates bearish sentiment.
Disclosure: I am part of Trade Nation's Influencer program and receive a monthly fee for using their TradingView charts in my analysis.
———————————
WISH YOU ALL LUCK

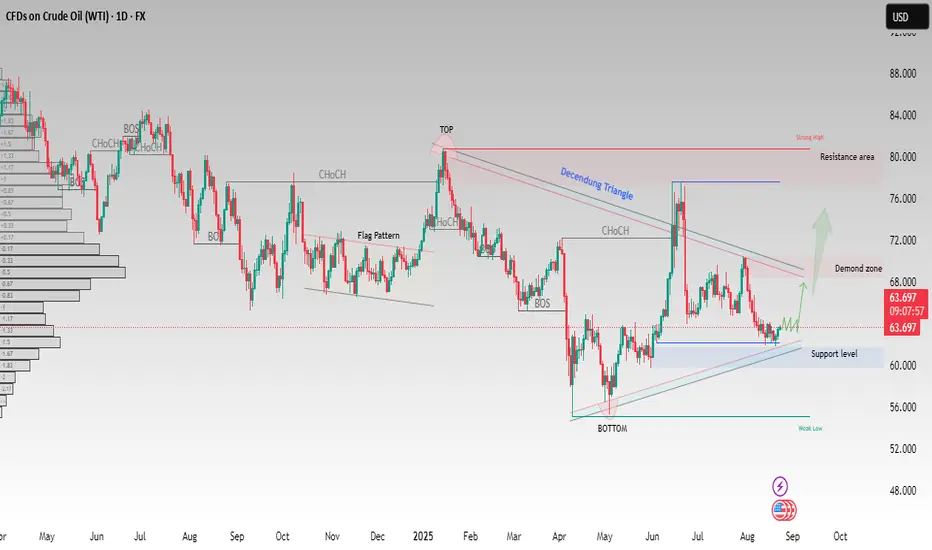
USOIL(WTI) – Demand Zone Tested,Potential Bullish Reversal AheadCrude Oil (WTI) is showing signs of strength after respecting the support level near $60–62 and forming a clear demand zone. Price has been consolidating within a descending structure and is now attempting to push higher.
Key observations:
✅ Support level held strongly near $60.
✅ Multiple Change of Character (CHoCH) signals indicating momentum shift.
✅ A potential breakout above the descending triangle may open the path toward the $70–72 demand zone.
📈 If bullish momentum continues, next targets lie around $76–80 resistance area.
On the downside, a break below $60 would invalidate the bullish setup and expose a move toward $56–54.
This structure highlights a possible trend reversal from the bottom toward higher levels, as long as buyers maintain control above support.
This analysis is for educational purposes only. It is not financial advice. Please trade responsibly and manage your risk
Oil (WTI) – Short Term Turmoil Dominates Heading into SeptemberIt’s been a choppy week for Oil (WTI), with traders frequently adjusting their positions in response to various short-term factors. On Monday, optimism around a potential Federal Reserve rate cut, which could stimulate the global economy, drove oil prices higher and WTI rose from its opening level of 64.28 to a three-week high of 65.84.
Tuesday saw selling pressure dominate, as traders awaited news on whether the Trump Administration would enforce a proposed increase in tariff penalties on India, from 25% to 50%, for purchasing Russian energy. This uncertainty pushed prices down to a low of 63.66. However, once confirmation came that the tariffs would indeed be implemented, and an EIA report revealed a decline in inventories at the key U.S. storage hub in Cushing, Oklahoma (the first drop in two months), oil prices rebounded.
Looking ahead, oil prices may remain volatile in the short term as traders await clearer signals about the strength of the global economy, particularly from the U.S. and China. Key data releases over the next 10 days could provide that insight.
On Sunday, China will publish its official PMI manufacturing survey, offering a snapshot of industrial activity. Then, on Friday, September 5th, the U.S. Non-Farm Payrolls report will give a crucial update on the health of the American labour market.
Another key factor to watch will be developments from OPEC+, as markets await further updates on whether the group will move to restore between 1.3 and 1.6 million barrels per day of previously shuttered production. Their next meeting, scheduled for early September, could provide crucial direction for oil prices depending on the outcome.
Technical Update: Upside Held by 38% Retracement Resistance
Since posting the 62.24 August 13th session low, Oil (WTI) has enjoyed a period of price strength, with the market moving higher to 65.84 on August 25th.
However, as the chart above shows, this strength was capped by 65.70 which is equal to the 38.2% Fibonacci retracement resistance, a level that is often a focus for traders, when prices rally following an extended phase of weakness.
Oil (WTI) has seen prices pullback from this 65.70 area this week, suggesting it may be a level to watch in the coming sessions. However, what could be the potential support or resistance levels, if either, 65.70 continues to act as resistance and pushes prices lower, or if further price strength emerges and it gives way on a closing basis?
Potential Support Levels, If 65.70 Continues to Hold Price Strength:
After facing selling pressure at the 65.70 retracement level, Oil (WTI) has shown signs of weakness. Attention may now turn to 62.24, the low from August 13th. As buyers were found here before, they may be again, reinforcing 62.24 as next possible support.
However, as the chart shows, since the highs of June 23rd, Oil (WTI) has been forming a pattern of lower highs and lower lows, which may indicate negative sentiment. If prices close below the 62.24 support level, it could trigger further downside momentum, potentially towards 60.17, the low from May 30th.
Potential Resistance Levels, If 65.70 is Broken on a Closing Basis:
While a close above the 65.70 resistance wouldn’t guarantee continued strength, it could open the door to a more sustained phase of upside momentum.
Such moves could then result in the extension of the current recovery to test 67.84, the higher 61.8% retracement, possible further, if this in turn gives way on a closing basis.
The material provided here has not been prepared accordance with legal requirements designed to promote the independence of investment research and as such is considered to be a marketing communication. Whilst it is not subject to any prohibition on dealing ahead of the dissemination of investment research, we will not seek to take any advantage before providing it to our clients.
Pepperstone doesn’t represent that the material provided here is accurate, current or complete, and therefore shouldn’t be relied upon as such. The information, whether from a third party or not, isn’t to be considered as a recommendation; or an offer to buy or sell; or the solicitation of an offer to buy or sell any security, financial product or instrument; or to participate in any particular trading strategy. It does not take into account readers’ financial situation or investment objectives. We advise any readers of this content to seek their own advice. Without the approval of Pepperstone, reproduction or redistribution of this information isn’t permitted.

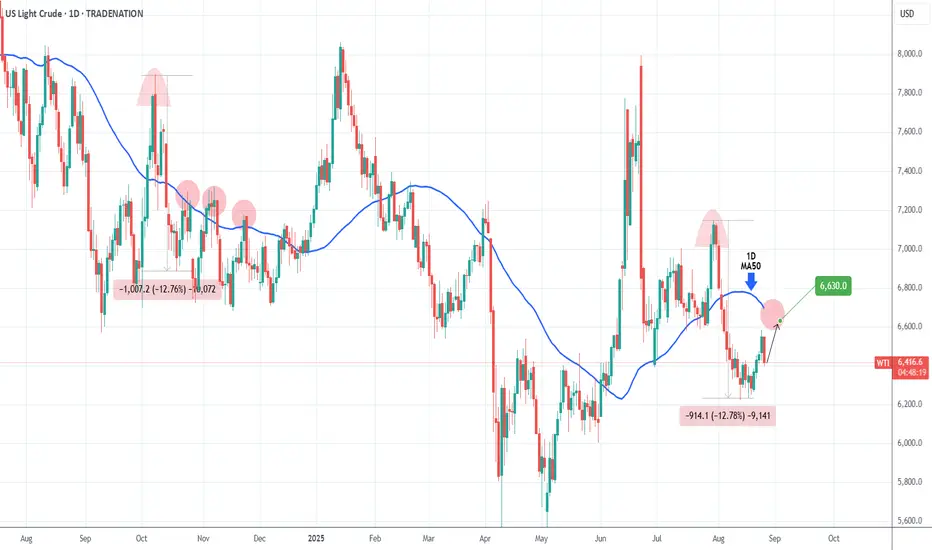
WTI OIL technically more chances to test the 1D MA50. Buy.Last week (August 20, see chart below) we issued a bullish break-out signal on WTI Oil (USOIL) that reached our $65.60 Target within 3 days:
This time we get a new buy signal, despite today's sharp pull-back. The -12.78% decline since the July 30 rejection, resembles the one since the October 08 2024 High.
This rebounded to just above the 1D MA50 (blue trend-line) to form a new Lower High and get rejected again.
As a result, our immediate short-term Target is $66.30.
-------------------------------------------------------------------------------
** Please LIKE 👍, FOLLOW ✅, SHARE 🙌 and COMMENT ✍ if you enjoy this idea! Also share your ideas and charts in the comments section below! This is best way to keep it relevant, support us, keep the content here free and allow the idea to reach as many people as possible. **
-------------------------------------------------------------------------------
Disclosure: I am part of Trade Nation's Influencer program and receive a monthly fee for using their TradingView charts in my analysis.
💸💸💸💸💸💸
👇 👇 👇 👇 👇 👇
USOIL - NEW BREAKOUT!Hello Traders!
The USOIL failed to create a new lower low!
The price broke the resistance level (64.427 - 63.894).
This key level becomes new support!
So, I expect a bullish move🚀
______________
TARGET: 66.200🎯


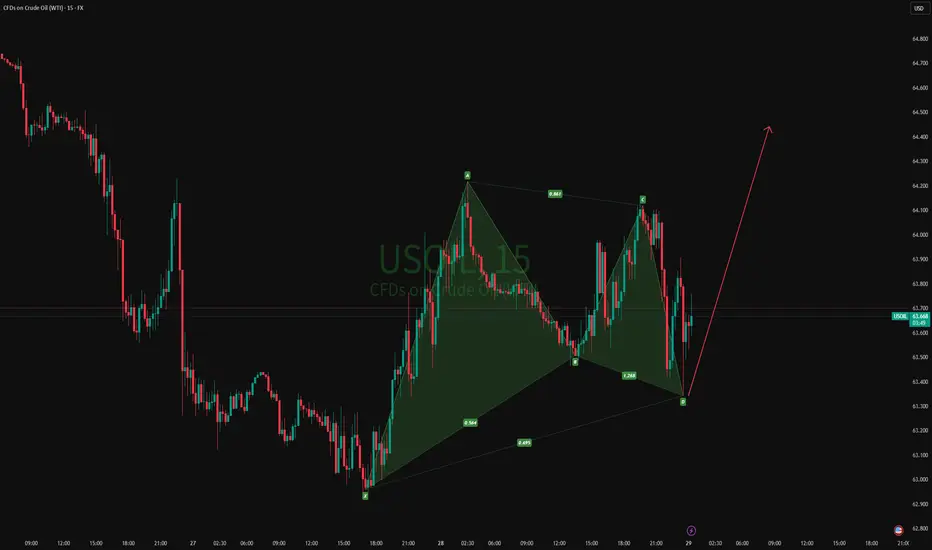
29-08-2025 USOILThe market is not always chaotic and disorderly, and there is a precise geometric beauty hidden in price fluctuations. The harmonic form long strategy is a powerful tool for accurately identifying potential market reversal points based on the Fibonacci ratio. When the form forms perfectly at the key support level, it often indicates the depletion of bearish momentum and the initiation of bullish trends.
As shown in the figure: 15M Bullish Gartley
USOIL Bearish Reversal & Selling OpportunityUSOIL (WTI Crude Oil) – Bearish Setup Analysis
The chart shows a clear bearish structure with multiple confirmations:
Trendline Rejection & Break: Price rejected from the upper rejection line and later broke the rising trendline, confirming bearish momentum.
FVG (Fair Value Gap) Selling Zone: Price retested the imbalance zone (63.53–63.94), creating a strong selling opportunity.
EMA Confluence: Both the 70 EMA and 200 EMA are above the price, acting as dynamic resistance, supporting bearish bias.
Market Structure Shift (MSS): Breakdown of higher lows signals shift to bearish structure.
Target: Downside continuation expected towards 61.65, the next liquidity and support zone.
Stop Loss: Above 63.94 (selling zone invalidation).
📉 Strategy: Look for sell entries around 63.53–63.94 zone, with target at 61.65 and stop loss above 63.94.

WTI Edges Up On Big EIA Draw, Risk-on ToneFundamental approach:
- Last week, USOIL was modestly higher amid risk-on sentiment and tighter supply signals after a larger‑than‑expected US crude draw.
- Support came from the EIA’s reported six-million-barrel crude draw tied to lower imports and stronger exports, reinforcing a tightening balance even as Cushing stocks ticked up; broader sentiment also leaned on expectations of looser Fed policy aiding demand.
- Gains were tempered by mixed macro cues, fading Eastern Europe risk headlines, choppy dollar moves, and cautious positioning ahead of the next API/EIA prints.
- However, China's Sinopec last week reported a sharp profit drop, citing weak fuel consumption. The trend of subdued fuel demand is likely to continue as factors including lower consumer confidence, rising electric-vehicle adoption and improved fuel efficiency are reducing petroleum demand in China.
- Into late week, USOIL could firm if US inventories show continued draws and risk tone improves, while any surprise builds or de‑escalation of supply risks may cap rallies; follow‑through from Fed‑cut pricing and geopolitics could potentially steer near‑term direction.
Technical approach:
- USOIL found support quickly after closing below the key level at 63.90. The price is retesting both EMAs and closed above the key level at 63.90, signaling a make-or-break situation. The market awaits a clear breakout to determine the short-term movement.
- If USOIL closes above both EMAs and breaks the descending trendline, the price may continue to advance to retest the following resistance at 67.50.
- On the contrary, closing below the support at 63.90 may prompt a further weakness to retest the next support at 60.00.
PS: I shared a piece of the above ideas on The Wall Street Journal: www.wsj.com
Analysis by: Dat Tong, Senior Financial Markets Strategist at Exness

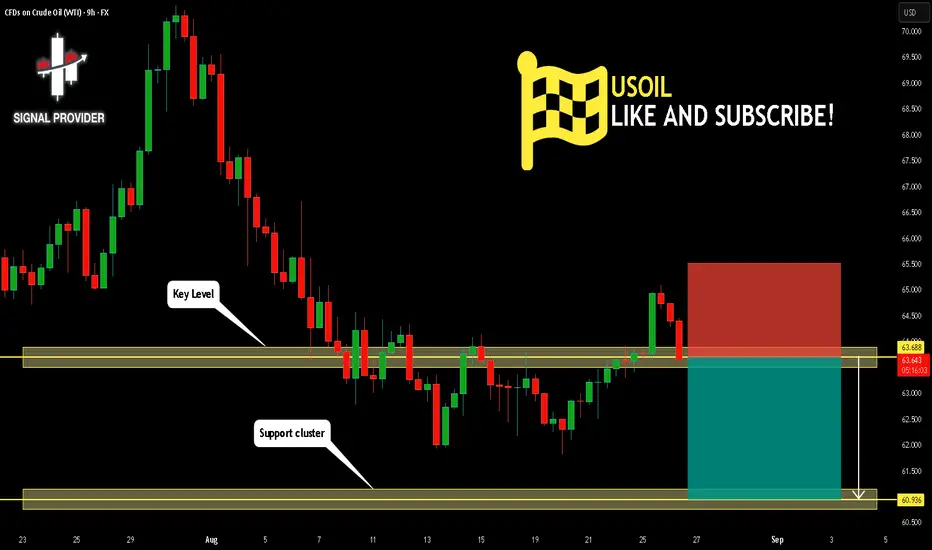
USOIL Is Bearish! Short!
Take a look at our analysis for USOIL.
Time Frame: 9h
Current Trend: Bearish
Sentiment: Overbought (based on 7-period RSI)
Forecast: Bearish
The price is testing a key resistance 63.688.
Taking into consideration the current market trend & overbought RSI, chances will be high to see a bearish movement to the downside at least to 60.936 level.
P.S
The term oversold refers to a condition where an asset has traded lower in price and has the potential for a price bounce.
Overbought refers to market scenarios where the instrument is traded considerably higher than its fair value. Overvaluation is caused by market sentiments when there is positive news.
Disclosure: I am part of Trade Nation's Influencer program and receive a monthly fee for using their TradingView charts in my analysis.
Like and subscribe and comment my ideas if you enjoy them!
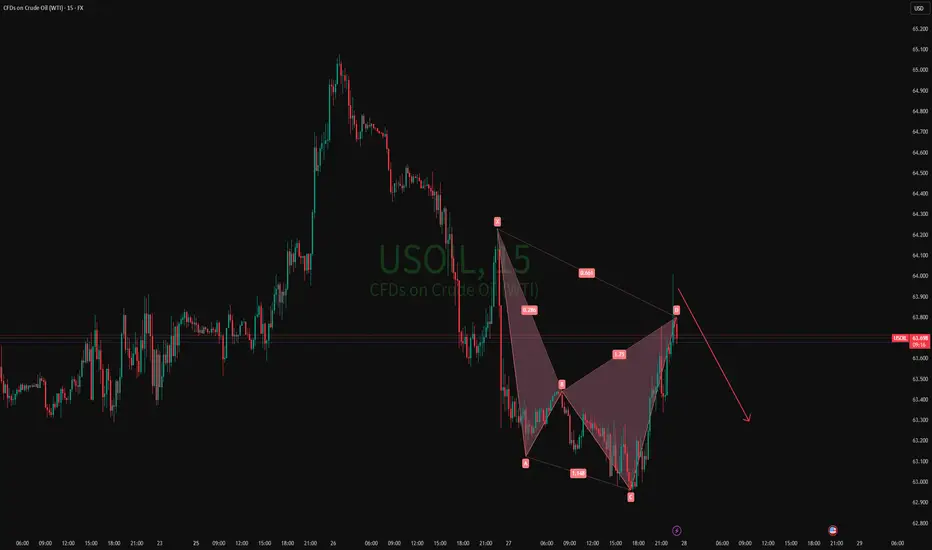
27-08-2025 USOILThe market is not always chaotic and disorderly, and there is a precise geometric beauty hidden in price fluctuations. The harmonic form long strategy is a powerful tool for accurately identifying potential market reversal points based on the Fibonacci ratio. When the form forms perfectly at the key support level, it often indicates the depletion of bearish momentum and the initiation of bullish trends.
As shown in the figure: 15M Bearish shark