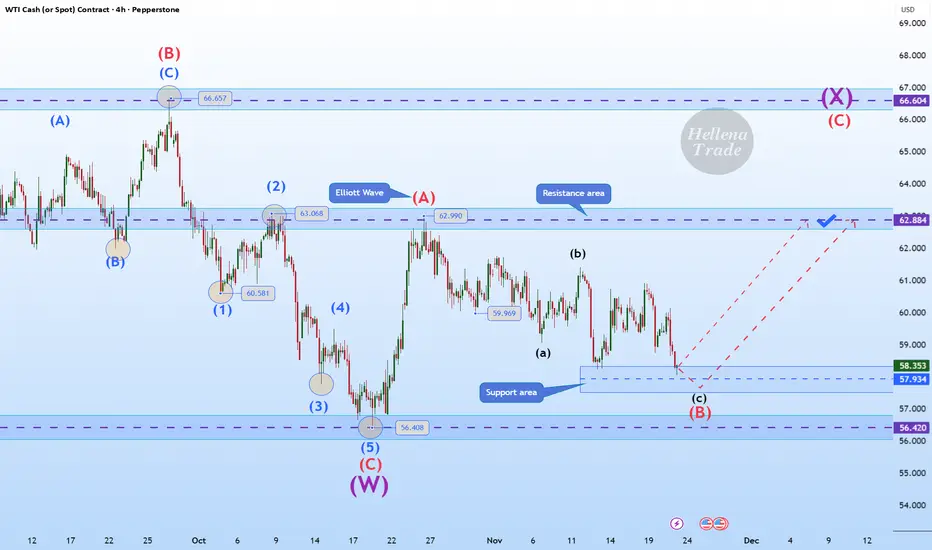
Hellena | Oil (4H): LONG to the area of the maximum of wave “A”.Colleagues, the past forecast has not been canceled, but I see some changes and therefore feel it is necessary to make a fresh forecast.
Apparently, the corrective wave “B” has extended to the area of 57.930. This is quite close to the low of wave “C” at 56.408 and the price should not update it, otherwise there will be a full-fledged break of the structure.
In connection with the above, I think that the price is already completing the downward movement and I expect the resumption of the upward movement at least to the area of the maximum of wave “A” - 62.990.
Manage your capital correctly and competently! Only enter trades based on reliable patterns!
Trade ideas
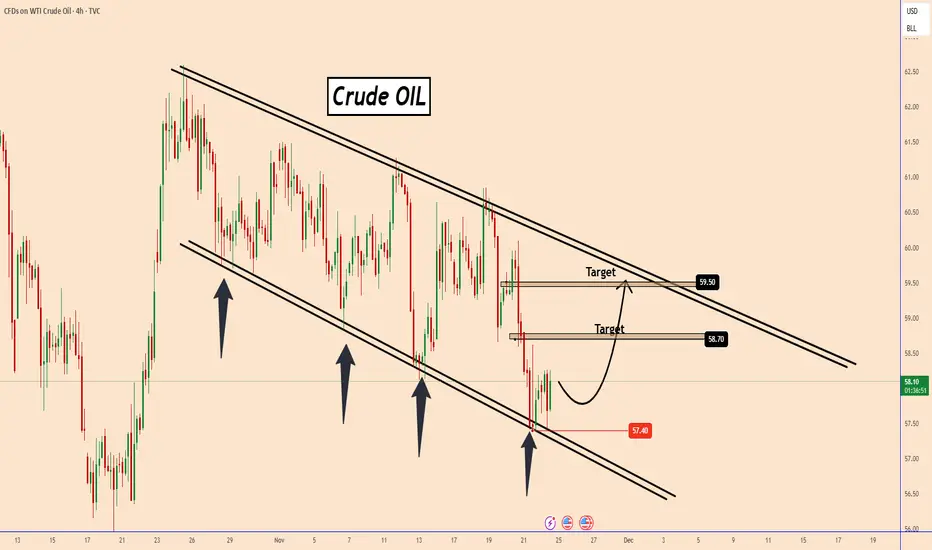
OIL: Time To Rise AgainOIL: Time To Rise Again
Oil is moving within a "Descending Channel Pattern" which is clear and well defined.
Every time the price tested the lower support of the pattern, the price moved back up and every time Oil tested the upper boundary of the pattern, the price moved back down.
It is more likely that Oil has found strong bullish momentum again near the 57.40 support area and is probably preparing to move higher as shown in the chart.
KeyTargets:
58.70
59.50
You may find more details in the chart!
Thank you and Good Luck!
❤️PS: Please support with a like or comment if you find this analysis useful for your trading day❤️
Potential bullish reversal?WTI Oil (XTI/USD) is falling towards the pivot and could bounce to the 61.8% Fibonacci resistance.
Pivot: 59.38
1st Support: 59.01
1st Resistance: 60.16
Disclaimer:
The opinions given above constitute general market commentary and do not constitute the opinion or advice of IC Markets or any form of personal or investment advice.
Any opinions, news, research, analyses, prices, other information, or links to third-party sites contained on this website are provided on an "as-is" basis, are intended to be informative only, and are not advice, a recommendation, research, a record of our trading prices, an offer of, or solicitation for, a transaction in any financial instrument and thus should not be treated as such. The information provided does not involve any specific investment objectives, financial situation, or needs of any specific person who may receive it. Please be aware that past performance is not a reliable indicator of future performance and/or results. Past performance or forward-looking scenarios based upon the reasonable beliefs of the third-party provider are not a guarantee of future performance. Actual results may differ materially from those anticipated in forward-looking or past performance statements. IC Markets makes no representation or warranty and assumes no liability as to the accuracy or completeness of the information provided, nor any loss arising from any investment based on a recommendation, forecast, or any information supplied by any third party.

USOIL ANALYSIS SETUP READ THE CAPTIONUSOIL is consolidating above a strong support zone while forming higher lows, indicating bullish pressure building. Price is currently testing the trendline resistance, and a clean breakout could open the way toward the upper target zone. As long as price stays above support, the bullish scenario remains valid.
Please Support with Boost and comments

Market Analysis: WTI Crude Oil Extends RecoveryMarket Analysis: WTI Crude Oil Extends Recovery
Crude oil price is rising and it could climb further higher toward $62.00.
Important Takeaways for WTI Crude Oil Price Analysis Today
- WTI Crude oil prices are moving higher above the $60.00 resistance zone.
- There is a key bullish trend line forming with support near $59.80 on the hourly chart of XTI/USD.
WTI Crude Oil Price Technical Analysis
On the hourly chart of WTI Crude Oil, the price started a decent increase from $58.00 against the US Dollar. The price gained bullish momentum after it broke $59.00.
There was a sustained upward movement above $59.50 and $60.00. The bulls pushed the price above the 50-hour simple moving average, and the RSI climbed toward 70. A high was formed near $60.75 before there was a minor pullback.
The price declined toward the 23.6% Fib retracement level of the upward move from the $58.11 swing low to the $60.75 high. However, the bulls are active above $60.00. There is also a key bullish trend line forming with support near $59.80.
Immediate resistance is near $60.75 level. If the price climbs further, it could face hurdles near $61.50. The next major stop for the bulls might be $62.20. Any more gain might send the price toward $63.50.
Conversely, the price might correct gains and retest the 50-hour simple moving average or the trend line. The next area of interest on the WTI crude oil chart is near the 61.8% Fib retracement at $59.10. If there is a downside break, the price might decline to $58.10. Any more losses may perhaps open the doors for a move toward $56.50.
This article represents the opinion of the Companies operating under the FXOpen brand only. It is not to be construed as an offer, solicitation, or recommendation with respect to products and services provided by the Companies operating under the FXOpen brand, nor is it to be considered financial advice.

Oil Upd:Price at Resistance–But the Real Story Is in OptionFlowRight now, price has reached the upper boundary of the 1σ Expected Range (ER).
A pause or rejection here is possible.
But that’s not the main story.
Bears are getting active in the options market.
First sign: A significant Put Condor has appeared — large enough to stand out.
Target range: $55–$57
Timeframe: 20 days to expiry
📌 For those still learning:
A Condor profits most when price stays within a tight range at expiry.
Second wave of bearish positioning:
Additional players are placing Put Spreads targeting $54–$55, but with a much shorter horizon — 5–7 days.
This shows a layered approach:
Short and mid- term pressure expected
🧠 Bottom Line:
I’m not jumping into shorts right now — and I wouldn’t advise it blindly.
But given this growing bearish sentiment, it’s smart to start looking for short setups
Sentiment is building.
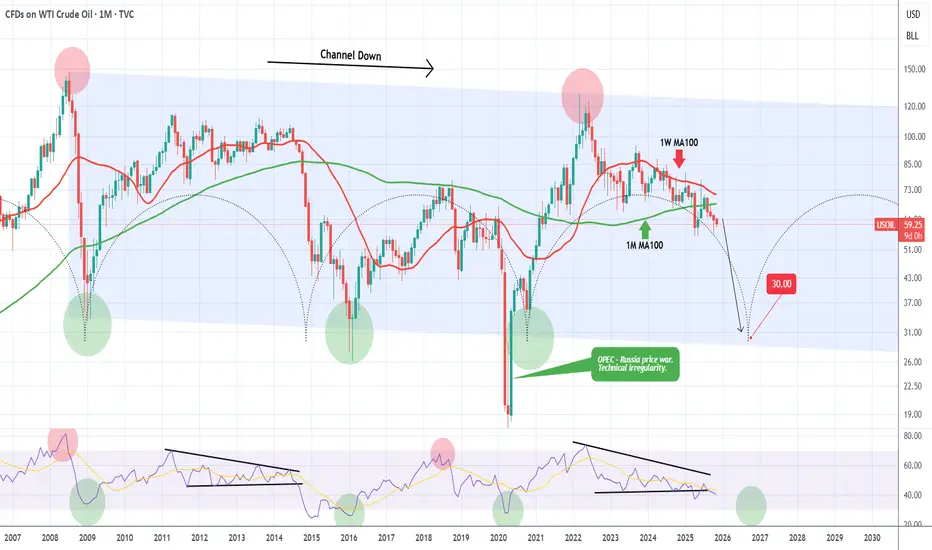
WTI OIL Is it possible to crash at $30.00?WTI Oil (USOIL) has been declining for 3 straight months (current red 1M candle is the 4th one) since the June 2025 rejection on the 1W MA100 (red trend-line). That has been the last rejection of a series of Lower Highs rejections on the 1W MA100 in the past 2 years.
On the much longer-term scale, this is the aftermath of the March 2022 market Top, made as a direct result of the Ukraine - Russia war. On a 17-year horizon, that was the 2nd Lower High of the multi-year Channel Down that WTI has been trading in since the July 2008 Top of the Housing Crisis.
As you can see, there is a high degree of symmetry on this pattern with Lower Lows in particular (market bottoms) getting formed around every 5-6 years. The use of the Time Cycles can fairly accurately project this. The next one is estimated to be towards the end of 2026, which matches perfectly the projected Bear Cycle bottom on the stock markets.
Based on this model, we may very well see WTI drop to as low as $30.00. A fairly solid bottom buy indicator would be when (if) the 1M RSI breaks below its 30.00 (oversold) barrier.
---
** Please LIKE 👍, FOLLOW ✅, SHARE 🙌 and COMMENT ✍ if you enjoy this idea! Also share your ideas and charts in the comments section below! This is best way to keep it relevant, support us, keep the content here free and allow the idea to reach as many people as possible. **
---
💸💸💸💸💸💸
👇 👇 👇 👇 👇 👇
WTI/USD: Bullish Rally to 62.45?CFI:WTI is gearing up for a bullish rally on the 4-hour chart , with price rebounding from a key support zone near cumulative long liquidation levels, setting up a strong entry opportunity if buyers maintain control and push toward resistance amid recent consolidation. Entry from current levels could also be favorable with proper risk management.
Entry zone between 57.5-58.3 for a buy position. Target at 62.45 near resistance.🎯 Set a stop loss at 56.335 , offering a risk-reward ratio greater than 1:2 . 📊 Watch for confirmation with a bullish close above entry and rising volume, capitalizing on oil's volatility.🌟
Fundamentally , WTI crude has fallen to around $58.13 per barrel as of November 21, 2025, amid supply outpacing demand, but recent breakouts above $60.7 signal near-term positivity despite forecasts of further drops to $53.50-$45.00 due to OPEC+ hikes and record US output. 💡
📝 Trade Setup
🎯 Entry Zone (Long): 57.5 – 58.3
🎯 Target (TP1): 62.45
❌ Stop Loss: 56.335
⚖️ Risk-to-Reward: Greater than 1:2, offering a clean upside swing with defined invalidation.
What's your take on this setup? Drop your thoughts below! 👇

USOIL The Target Is UP! BUY!
My dear friends,
USOIL looks like it will make a good move, and here are the details:
The market is trading on 57.97 pivot level.
Bias - Bullish
Technical Indicators: Supper Trend generates a clear long signal while Pivot Point HL is currently determining the overall Bullish trend of the market.
Goal - 58.98
About Used Indicators:
Pivot points are a great way to identify areas of support and resistance, but they work best when combined with other kinds of technical analysis
Disclosure: I am part of Trade Nation's Influencer program and receive a monthly fee for using their TradingView charts in my analysis.
———————————
WISH YOU ALL LUCK

BULLISH SCENARIO - USOILHello traders,
USOIL is currently moving inside a descending channel.
A bullish breakout is in focus:
If the price breaks the channel resistance and confirms the close above,
a strong upward movement is expected 🚀
🎯 TARGET: 65.150

WTI resumes slideExcess supply concerns continue to hold back oil each time it tries to stage a recovery, and today it looks like the market has decided that it wants to trade below $60 per barrel. WTI has been testing this barrier from underneath for a few days but today it looks like the advance has been rejected once again. Prices have broken below the lows of the past two days, thus triggering some stops. From here $58.00 could be the next stop, below which there is nothing significant in terms of support until $55.00.
By Fawad Razaqzada, market analyst with FOREX.com

CRUDE OIL (WTI): Bullish Move After Trap
There is a high chance that Crude Oil will pull back
from the underlined daily key level.
I see a confirmed bear trap followed by a bullish imbalance
candle on an hourly.
I expect a rise at least to 58.51 level.
❤️Please, support my work with like, thank you!❤️
I am part of Trade Nation's Influencer program and receive a monthly fee for using their TradingView charts in my analysis.

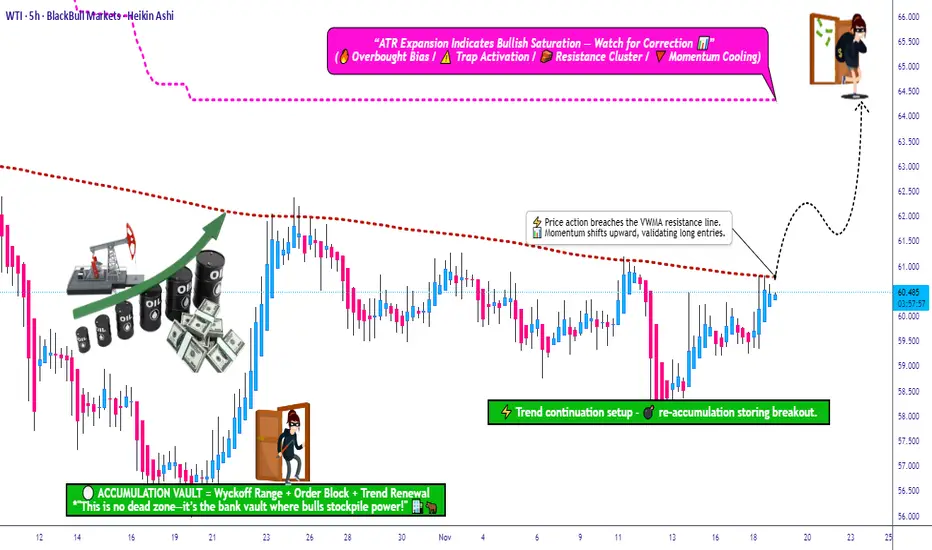
USOIL Breakout Confirmed—Is the Uptrend Ready to Extend?📈 WTI CRUDE OIL (USOIL) – SWING TRADE SETUP | VWMA BREAKOUT CONFIRMED 🛢️⚡
🎯 TRADE OVERVIEW
Asset: WTI Crude Oil (USOIL) – Energies Market
Trade Type: Swing Trade (Multi-Day Position)
Bias: 🟢 BULLISH – Volume Weighted Moving Average (VWMA) breakout confirmed near $61.00
📊 TRADE PLAN
🔹 Entry Strategy: "Thief Layering Method"
Primary Entry Zone: Post-VWMA breakout above $61.00
Layered Limit Orders (Multiple Entry Points):
🟦 Layer 1: $59.00
🟦 Layer 2: $59.50
🟦 Layer 3: $60.00
🟦 Layer 4: $60.50
Note: You can add more layers based on your capital allocation and risk tolerance. This strategy allows averaging into the position as price pulls back.
🛑 Stop Loss Management
Thief's SL: $58.00
⚠️ IMPORTANT: Dear Ladies & Gentlemen (Thief OG's),
This is MY stop loss level. Adjust YOUR stop loss based on YOUR strategy and risk management plan. I do not recommend blindly following my SL – manage your own risk and capital accordingly.
🎯 Take Profit Target
Primary Target: $64.00
Technical Reasoning:
SuperTrend ATR line acts as strong dynamic resistance
Potential overbought zone + bull trap risk
Escape with profits before reversal pressure
⚠️ IMPORTANT: Dear Ladies & Gentlemen (Thief OG's),
This is MY take profit target. Take YOUR money at YOUR own risk. You are responsible for your profit-taking strategy – trail stops, scale out, or exit fully based on YOUR trading plan.
🔗 CORRELATED PAIRS TO WATCH (USD-Denominated)
Monitor these related assets for confirmation and risk assessment:
🛢️ Energy Sector:
Brent Crude Oil (UKOIL) – Typically trades $2-5 above WTI; if Brent is bullish, WTI usually follows
Natural Gas (NATGAS) – Energy sector sentiment indicator
💵 Currency Pairs:
USD/CAD – Inverse correlation to oil (CAD = petro-currency). If oil rises, USD/CAD typically falls
DXY (US Dollar Index) – Strong dollar = bearish pressure on oil. Watch for weakness in DXY to support oil rally
📈 Equity Markets:
Energy Sector ETFs (XLE) – Tracks US energy stocks; bullish XLE confirms oil sector strength
S&P 500 (SPX) – Risk-on sentiment supports commodity prices
⚡ Key Correlation Points:
Oil ↑ + USD/CAD ↓ = Strong bullish confirmation
Oil ↑ + DXY ↓ = Supportive macro environment
Oil ↑ + XLE ↑ = Energy sector momentum aligned
💬 Engagement Call-to-Action
👍 If you found this analysis helpful, smash that LIKE button!
💬 Drop your thoughts in the comments – are you bullish or bearish on oil?
🔔 FOLLOW for more professional trade setups and market insights!
USOIL H4 | Bearish Drop OffMomentum: Bearish
The price is currently moving along a descending trendline and remains below the Ichimoku Cloud, indicating continued downside pressure.
Sell entry: 60.35
Pullback resitance
Stop loss: 61.42
Pullback resistance
Take profit: 58.21
High Risk Investment Warning
Stratos Markets Limited (tradu.com ), Stratos Europe Ltd (tradu.com ):
CFDs are complex instruments and come with a high risk of losing money rapidly due to leverage. 70% of retail investor accounts lose money when trading CFDs with this provider. You should consider whether you understand how CFDs work and whether you can afford to take the high risk of losing your money.
Stratos Global LLC (tradu.com ): Losses can exceed deposits.
Please be advised that the information presented on TradingView is provided to Tradu (‘Company’, ‘we’) by a third-party provider (‘TFA Global Pte Ltd’). Please be reminded that you are solely responsible for the trading decisions on your account. Any information and/or content is intended entirely for research, educational and informational purposes only and does not constitute investment or consultation advice or investment strategy. The information is not tailored to the investment needs of any specific person and therefore does not involve a consideration of any of the investment objectives, financial situation or needs of any viewer that may receive it. Past performance is not a reliable indicator of future results. Actual results may differ materially from those anticipated in forward-looking or past performance statements. We assume no liability as to the accuracy or completeness of any of the information and/or content provided herein and the Company cannot be held responsible for any omission, mistake nor for any loss or damage including without limitation to any loss of profit which may arise from reliance on any information supplied by TFA Global Pte Ltd.

CRUDE OIL Will Fall! Sell!
Hello,Traders!
USOIL is reacting inside the horizontal supply after a liquidity sweep, showing early bearish displacement. If rejection holds, price may continue lower toward the sell-side liquidity at the marked target zone.Time Frame 2H.
Sell!
Comment and subscribe to help us grow!
Check out other forecasts below too!
Disclosure: I am part of Trade Nation's Influencer program and receive a monthly fee for using their TradingView charts in my analysis.

USOIL Is Very Bearish! Sell!
Please, check our technical outlook for USOIL.
Time Frame: 15m
Current Trend: Bearish
Sentiment: Overbought (based on 7-period RSI)
Forecast: Bearish
The market is approaching a significant resistance area 57.983.
Due to the fact that we see a positive bearish reaction from the underlined area, I strongly believe that sellers will manage to push the price all the way down to 57.471 level.
P.S
We determine oversold/overbought condition with RSI indicator.
When it drops below 30 - the market is considered to be oversold.
When it bounces above 70 - the market is considered to be overbought.
Like and subscribe and comment my ideas if you enjoy them!

USOIL:LIVE TRADEHello friends
you can see that we had a decline and the sellers were in power until the support was determined with Fibonacci, where buyers entered and were able to support the price.
Now, with Fibonacci, we have determined a resistance area for buyers that can move up to there, but considering the main trend, which is negative, the price increase is an opportunity for a sell trade.
Don't forget risk and capital management.
*Trade safely with us*

Temporary Long .. Would have thought this is the bottom but it is hard to decide these things. There seems to be a little support at $57.4,
The only pattern i see it oil getting rejected at the 50mma (green line), so any up move might stop at that line. Will wait for price action this week to see if it still is in this downward channel.


USOIL : LIVE TRADEHello friends
Given the price growth, you can see that buyers have repeatedly tried to break the resistance but were unsuccessful and the weakness of the trend is quite clear.
Now we can trade with capital and risk management and account management.
This is not a buy or sell offer.
*Trade safely with us*

Supply sideThe situation of excess has become a definite trend, with weak supporting force
- OPEC + increased production, coupled with the conclusion of supply surplus, Securities Times e-Company: The OPEC report in November changed the global oil situation from healthy to surplus. Currently, the world's oil production exceeds demand by 500,000 barrels per day, while a month ago it was estimated to be a shortage of 400,000 barrels. Although OPEC + decided to suspend production increase in the first quarter of 2026, it will still increase production by 137,000 barrels per day in December, and the continuous rounds of production increase in the past have continuously accumulated market supply pressure. At the same time, the compensation for production cuts by some oil-producing countries can slightly offset the impact of production increase, but it is difficult to change the overall surplus situation.
- Non-OPEC oil-producing countries have high production: The U.S. crude oil production remains at a high level, with the production reaching 13.862 million barrels per day in the week of November 7th. Although it has slightly declined later, it still remains at a historical high level. EIA also raised the 2026 U.S. crude oil production by 200,000 barrels per day to 13.5 million barrels per day. Its continuous production increase further intensifies the expectation of global supply surplus.
Next week's crude oil strategy analysis
sell:58-58.5
tp:57.5-57
sl:59.5

WTI Crude Returns to the Year’s LowsIn recent trading sessions, WTI crude oil has posted three consecutive losing sessions, recording a decline of more than 4.7% in the short term. Selling pressure remains steady, driven by concerns over a potential market oversupply, especially with the upcoming OPEC+ meeting in December. Additionally, weaker market confidence has raised expectations of lower short-term demand for oil, reinforcing a sense of uncertainty in crude price movements. If this trend persists, it could result in stronger selling pressure in the coming sessions.
Downtrend Remains Firm
For now, the downward movements have maintained a bearish trendline that has persisted over recent months. So far, buying attempts have not been strong enough to challenge this structure. As the price approaches the year’s lows, the downtrend could become even steeper in the coming sessions.
RSI
The RSI indicator continues to show consistent oscillations below the neutral 50 level, suggesting that the average momentum over the past 14 sessions remains predominantly bearish. If the RSI continues to decline, this could indicate stronger selling pressure in the next few sessions.
TRIX
Meanwhile, the TRIX indicator remains below the neutral 0 level, signaling that the average strength of the exponential moving averages continues to favor a bearish bias. As long as this sentiment persists, selling momentum is likely to remain dominant in WTI crude’s price action.
Key Levels to Watch:
$57 – Key Support: Represents the year’s low zone and serves as the main bearish barrier. A break below this level could reinforce the ongoing downtrend and extend selling pressure in the coming sessions.
$60 – Nearby Barrier: Corresponds to the 50-period simple moving average. Price movements returning to this level could trigger indecision and lead to a short-term sideways range.
$64 – Major Resistance: Aligns with the 200-period moving average and represents the most important bullish barrier in the short term. If the price reaches this level, it could revive buying momentum and challenge the current bearish structure.
Written by Julian Pineda, CFA, CMT – Market Analyst

OIl in to start wave e of traingle B (Long - Short/Medium Term)- The clearest count right now is that we are in the start of wave E around 65- 70 of traiangle B.
- To follow a deeper correcton for wave C to around $30 a Barrel
