SPX500 LongElite Analysis
Price came to structured liquidity
Transitional switch confirmed in 1m, 3m, 5m
Targeting structured liquidity above
Trade ideas

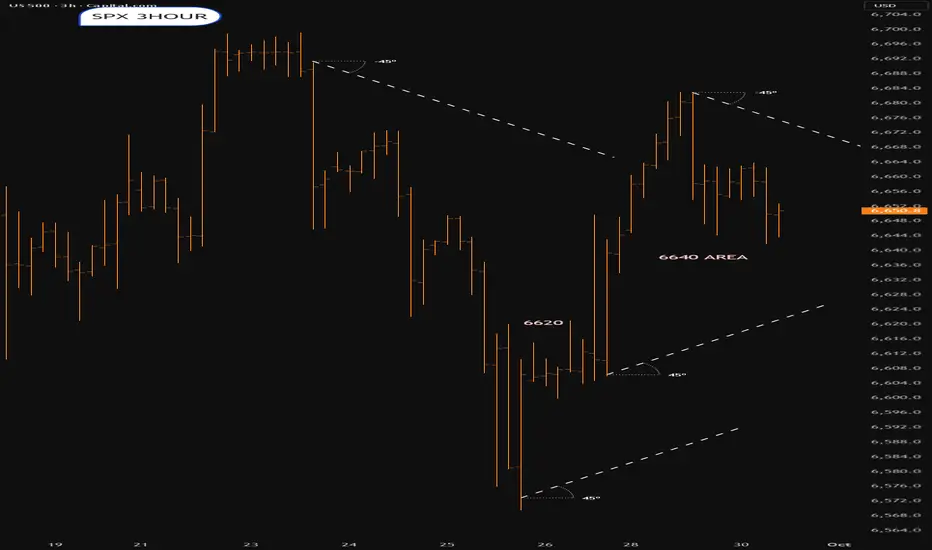
SPX into Quarter endDifficullt.Direction unclear.Some sort of festering around 6620-6640 area.Lets see
SPX500 – Bearish Below 6,662 as Shutdown Risks Cloud Fed OutlookSPX500 – Overview
SPX500 is trading cautiously as Wall Street weighs the risk of a potential U.S. government shutdown and the Fed’s next policy steps.
The lack of clarity over upcoming economic data—especially if NFP is delayed—adds to volatility and makes short-term moves highly data- and headline-driven.
Technical Outlook
The index has stabilized below the 6,662 pivot, which supports ongoing bearish momentum.
→ As long as price stays under 6,662, downside targets are 6,635 and 6,617, with a further extension toward 6,580 if momentum accelerates.
However, if price stabilizes above 6,673, the bullish trend could resume toward 6,699 and higher.
Pivot: 6,662
Support: 6,635 – 6,617 – 6,580
Resistance: 6,674 – 6,699 – 6,742

Capital Flows: Introduction and Its Types1. Introduction to Capital Flows
Capital flows refer to the movement of money for the purpose of investment, trade, or business production across borders or within a country. These movements are essential for financing economic activities, promoting growth, and integrating economies globally. Capital flows can occur in various forms, such as foreign direct investment (FDI), portfolio investment, loans, and grants, and they play a crucial role in determining a country’s financial stability, exchange rates, and overall economic health.
In a globalized economy, capital flows are influenced by multiple factors, including interest rate differentials, economic growth expectations, political stability, and global financial conditions. They not only provide resources for investment but also affect the balance of payments, exchange rates, and financial market dynamics.
Importance of Capital Flows
Economic Growth: Capital inflows provide funds for investment in infrastructure, technology, and industry.
Financial Market Development: They enhance liquidity and depth in domestic capital markets.
Exchange Rate Stability: Capital inflows can stabilize or destabilize currencies, depending on their nature and volume.
Integration with Global Economy: Facilitates trade and investment linkages across countries.
Risk Diversification: Allows investors to diversify portfolios internationally, reducing exposure to domestic risks.
Capital flows can be both short-term and long-term, each having distinct impacts on an economy. Understanding the types of capital flows helps policymakers manage them effectively and mitigate associated risks.
2. Classification of Capital Flows
Capital flows can be classified based on their nature, duration, and purpose. Broadly, they are categorized into foreign direct investment (FDI), portfolio investment, other investments, and financial derivatives and loans.
2.1. Foreign Direct Investment (FDI)
FDI refers to investments made by a foreign entity to acquire a lasting interest in a domestic company or asset. This usually involves significant influence or control over the enterprise. FDI is a long-term form of capital flow and is considered relatively stable compared to short-term portfolio flows.
Types of FDI
Horizontal FDI: Investment in the same industry abroad as in the investor's home country.
Vertical FDI: Investment in a business abroad that plays a role in the investor’s supply chain.
Backward Vertical: Investment in suppliers.
Forward Vertical: Investment in distributors or buyers.
Conglomerate FDI: Investment in unrelated industries in the host country.
Advantages of FDI
Transfer of technology and management expertise
Creation of jobs in the host country
Promotion of export-oriented growth
Risks of FDI
Political and regulatory risks
Profit repatriation affecting domestic capital availability
2.2. Portfolio Investment
Portfolio investment refers to investments in financial assets such as stocks, bonds, or other securities in a foreign country without seeking control over the entities invested in. These flows are typically more volatile and are influenced by market sentiment, interest rate differentials, and exchange rate expectations.
Types of Portfolio Investments
Equity Investments: Buying shares in foreign companies.
Debt Investments: Investment in foreign bonds or debt instruments.
Mutual Funds & ETFs: Indirect investment through global funds.
Advantages of Portfolio Investment
Provides liquidity to financial markets
Encourages efficient capital allocation
Access to higher returns
Risks of Portfolio Investment
Sudden outflows due to changes in global investor sentiment
Exchange rate risks affecting returns
Vulnerability to financial crises
2.3. Other Investments
This category includes capital flows that are not strictly FDI or portfolio investments but still impact the financial system significantly.
Examples
Bank Loans & Trade Credits: Funds borrowed from foreign banks or trade partners.
Currency & Deposit Flows: Short-term movements of foreign currency deposits.
Intercompany Loans: Funds transferred between parent companies and subsidiaries.
Advantages
Provides short-term liquidity to markets
Facilitates international trade and business operations
Risks
Susceptibility to sudden reversals
Exchange rate volatility impacts repayment costs
2.4. Financial Derivatives
Derivatives such as forwards, futures, options, and swaps also constitute capital flows in the form of investment in risk management and speculative activities. Though not physical capital, these instruments influence liquidity, hedging, and capital allocation in global markets.
3. Direction of Capital Flows
Capital flows can be inflows (into a country) or outflows (from a country). Each type has different economic implications.
3.1. Capital Inflows
Capital inflows bring foreign funds into a domestic economy.
Benefits: Boosts investment, improves liquidity, strengthens currency reserves.
Risks: Can create asset bubbles, currency appreciation, and overdependence on foreign capital.
3.2. Capital Outflows
Capital outflows involve domestic capital moving abroad.
Reasons: Seeking higher returns, diversification, or risk hedging.
Risks: Can weaken domestic currency, reduce investment, and trigger financial instability.
4. Determinants of Capital Flows
Several factors influence the magnitude and direction of capital flows:
Interest Rate Differentials: Higher returns attract capital inflows.
Economic Growth Prospects: Fast-growing economies attract FDI and portfolio flows.
Political Stability & Policy Environment: Investor confidence depends on legal and political frameworks.
Exchange Rate Expectations: Anticipated currency appreciation or depreciation drives speculative flows.
Global Financial Conditions: Changes in global liquidity, crises, or monetary policies influence flows.
5. Risks and Challenges Associated with Capital Flows
While capital flows are essential for growth, they pose several risks:
Volatility Risk: Sudden inflow or outflow can destabilize financial markets.
Exchange Rate Risk: Large inflows can lead to currency appreciation, harming exports.
Debt Sustainability Risk: Excessive reliance on foreign borrowing may lead to debt crises.
Inflationary Pressure: Large capital inflows can increase money supply and inflation.
Policymakers often use capital controls, macroprudential measures, and hedging mechanisms to manage these risks.
6. Trends in Global Capital Flows
Global capital flows have changed significantly in recent decades due to globalization, technological advancement, and financial market liberalization:
Pre-2008 Crisis: Rapid growth in cross-border portfolio flows, especially to emerging markets.
Post-2008 Crisis: Greater emphasis on long-term FDI and cautious portfolio flows.
Current Trends: ESG-driven investments, digital asset flows, and regional investment blocs (e.g., ASEAN, EU).
7. Policy Implications
Governments and central banks actively manage capital flows to achieve economic stability:
Encouraging FDI: Through tax incentives, ease of doing business, and infrastructure development.
Regulating Portfolio Flows: To prevent sudden reversals affecting currency and financial markets.
Macroprudential Measures: Controlling credit growth, currency exposure, and leverage.
Capital Controls: Temporary restrictions on inflows or outflows to stabilize markets.
8. Conclusion
Capital flows are vital for the functioning and development of modern economies. They provide the necessary funds for investment, enhance financial market liquidity, and facilitate economic growth. However, the benefits of capital flows come with inherent risks, including volatility, currency fluctuations, and potential financial instability. Understanding the types, determinants, and impacts of capital flows is essential for policymakers, investors, and economists to maximize economic benefits while mitigating potential adverse effects.
By effectively managing capital flows, countries can harness global financial integration to fuel sustainable growth and development. As globalization continues, monitoring and adapting to changes in capital flows will remain a critical aspect of economic planning and financial stability.
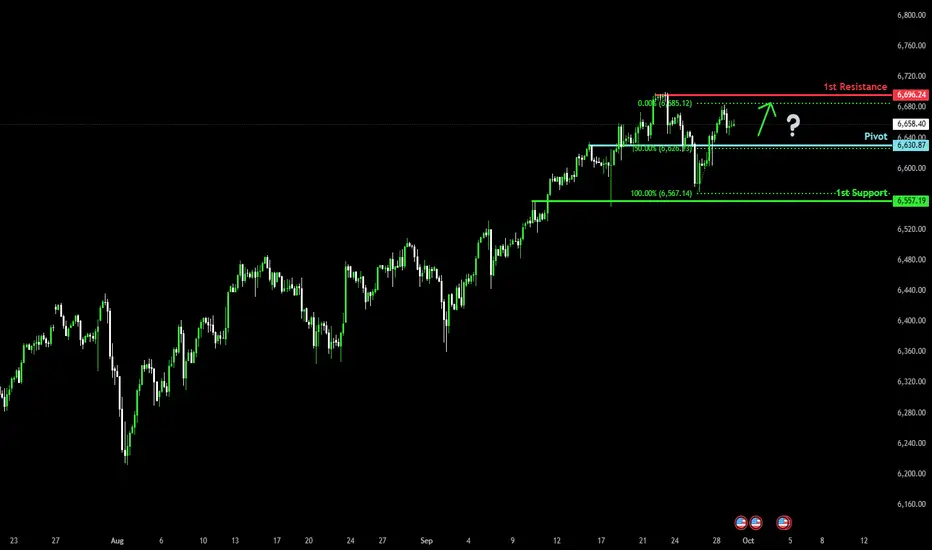
Falling towards 50% Fibonacci support?S&P500 (US500) is falling towards the pivot, which acts as an overlap support that aligns with t e 50% Fibonacci retracement and could bounce to the 1st resistance which has been identified as a swing high resistance.
Pivot: 6,630.87
1st Support: 6,557.19
1st Resistance: 6,696.24
Disclaimer:
The above opinions given constitute general market commentary, and do not constitute the opinion or advice of IC Markets or any form of personal or investment advice.
Any opinions, news, research, analyses, prices, other information, or links to third-party sites contained on this website are provided on an "as-is" basis, are intended only to be informative, is not an advice nor a recommendation, nor research, or a record of our trading prices, or an offer of, or solicitation for a transaction in any financial instrument and thus should not be treated as such. The information provided does not involve any specific investment objectives, financial situation and needs of any specific person who may receive it. Please be aware, that past performance is not a reliable indicator of future performance and/or results. Past Performance or Forward-looking scenarios based upon the reasonable beliefs of the third-party provider are not a guarantee of future performance. Actual results may differ materially from those anticipated in forward-looking or past performance statements. IC Markets makes no representation or warranty and assumes no liability as to the accuracy or completeness of the information provided, nor any loss arising from any investment based on a recommendation, forecast or any information supplied by any third-party.
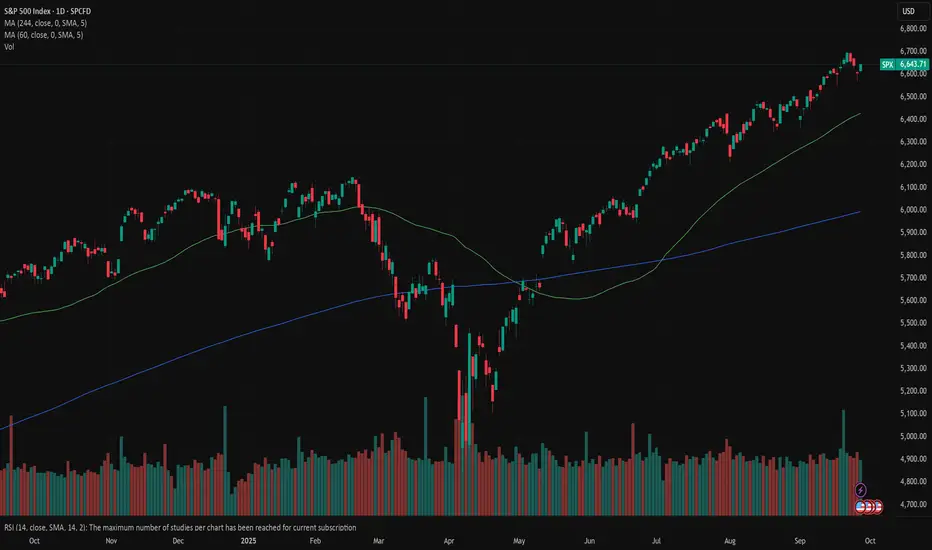
S&P 500, Has the Annual High Been Reached?Has the S&P 500 index made its annual peak at 6,700 points? This is the legitimate question technical analysts are asking after the market reached the upper part of a long-term bullish channel last week. The valuation of the S&P 500 has surpassed its late 2021 highs, and the market seems to have reached the end of a bullish rally that began last April.
1. It is logical that the market entered a technical pause after reaching a major target (6,700 points)
In an analysis published on TradingView in mid-September, we highlighted the presence of a medium/long-term bullish channel on the S&P 500. This channel passes around 6,700 points, which was also the median price target of financial analysts for 2025.
The 6,700-point level was therefore both a technical and a fundamental target, so it is logical that this resistance triggered a pause in the S&P 500.
However, it is still far too early to speak of the end of the long-term bullish trend, even if the market enters a short-term correction. The first chart below shows this bullish channel acting as resistance, but it also shows that there is currently no bearish price/momentum divergence (with momentum represented here by the RSI).
2. Market sentiment analysis still does not display the characteristics of a final top
Market tops are always built during phases of retail investor euphoria, while bottoms occur during phases of extreme fear. The latest sentiment survey by the American Association of Individual Investors shows that there is still a balance between buyers and sellers, despite the strong bullish phase between April and September. Here too, the characteristics of a final annual market top are not present, even if a short-term correction is legitimate.
3. Quantitative analysis also does not indicate the end of a long-term bullish trend
It is therefore too early to claim that this upper channel boundary is the final peak of 2025. This is also the message conveyed by quantitative market analysis, which shows that US equities (S&P 500 components) are not in an extreme overheating zone overall. In fact, only 55% of S&P 500 stocks are above their 50-day simple moving average, and the market has not recently entered a phase of excessive bullishness.
DISCLAIMER:
This content is intended for individuals who are familiar with financial markets and instruments and is for information purposes only. The presented idea (including market commentary, market data and observations) is not a work product of any research department of Swissquote or its affiliates. This material is intended to highlight market action and does not constitute investment, legal or tax advice. If you are a retail investor or lack experience in trading complex financial products, it is advisable to seek professional advice from licensed advisor before making any financial decisions.
This content is not intended to manipulate the market or encourage any specific financial behavior.
Swissquote makes no representation or warranty as to the quality, completeness, accuracy, comprehensiveness or non-infringement of such content. The views expressed are those of the consultant and are provided for educational purposes only. Any information provided relating to a product or market should not be construed as recommending an investment strategy or transaction. Past performance is not a guarantee of future results.
Swissquote and its employees and representatives shall in no event be held liable for any damages or losses arising directly or indirectly from decisions made on the basis of this content.
The use of any third-party brands or trademarks is for information only and does not imply endorsement by Swissquote, or that the trademark owner has authorised Swissquote to promote its products or services.
Swissquote is the marketing brand for the activities of Swissquote Bank Ltd (Switzerland) regulated by FINMA, Swissquote Capital Markets Limited regulated by CySEC (Cyprus), Swissquote Bank Europe SA (Luxembourg) regulated by the CSSF, Swissquote Ltd (UK) regulated by the FCA, Swissquote Financial Services (Malta) Ltd regulated by the Malta Financial Services Authority, Swissquote MEA Ltd. (UAE) regulated by the Dubai Financial Services Authority, Swissquote Pte Ltd (Singapore) regulated by the Monetary Authority of Singapore, Swissquote Asia Limited (Hong Kong) licensed by the Hong Kong Securities and Futures Commission (SFC) and Swissquote South Africa (Pty) Ltd supervised by the FSCA.
Products and services of Swissquote are only intended for those permitted to receive them under local law.
All investments carry a degree of risk. The risk of loss in trading or holding financial instruments can be substantial. The value of financial instruments, including but not limited to stocks, bonds, cryptocurrencies, and other assets, can fluctuate both upwards and downwards. There is a significant risk of financial loss when buying, selling, holding, staking, or investing in these instruments. SQBE makes no recommendations regarding any specific investment, transaction, or the use of any particular investment strategy.
CFDs are complex instruments and come with a high risk of losing money rapidly due to leverage. The vast majority of retail client accounts suffer capital losses when trading in CFDs. You should consider whether you understand how CFDs work and whether you can afford to take the high risk of losing your money.
Digital Assets are unregulated in most countries and consumer protection rules may not apply. As highly volatile speculative investments, Digital Assets are not suitable for investors without a high-risk tolerance. Make sure you understand each Digital Asset before you trade.
Cryptocurrencies are not considered legal tender in some jurisdictions and are subject to regulatory uncertainties.
The use of Internet-based systems can involve high risks, including, but not limited to, fraud, cyber-attacks, network and communication failures, as well as identity theft and phishing attacks related to crypto-assets.

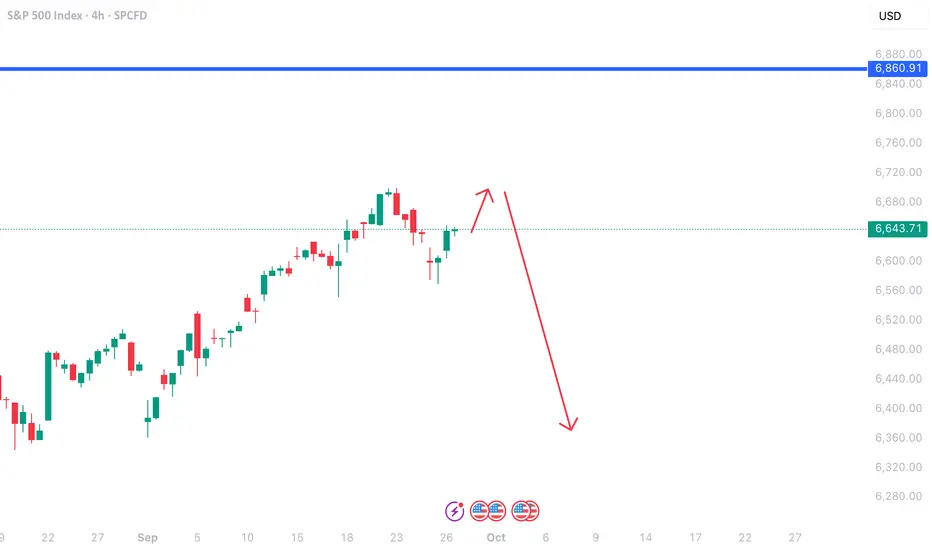
Bear trap....SPX to fall soonToday was somewhat decent, but let's not get too giddy! There's looming Gov shutdown on Wed and a few sizable calls on the VIX on the tape. We can see technicals showing a decline, at least in the short term, and I guess we'll see what happens post-Wed. One thing is for sure is that we are overdue a nice healthy pullback. Would not bet the farm on AI esp. with astronomical CAPEX, and highest concentration ever in the market. Best of luck!

SPX defying gravity!It's a BULL market until it's not! Some how some way the markets will set new ATHs? I don't know how or why every macro economic indicator is yelling recession or worse but the chart tells me a different story. Bulls ball.....

SPX - That's all folks?The world has gone nuts, but markets didn't even blink.
Now the SPX has reached it's U-MLH, which means, it's at a real extreme.
This is a level where price starts to stall, then turn.
Often we see "a last attempt" to break through, and it really could happen. But then, gravity again takes it's toll and the rocket starts to turn south.
Here are the scenarios I see:
1. Immediate turn at the U-MLH. Target is the Centerline.
2. A break of the U-MLH, then back into the fork and a fall down to the Centerline.
3. Break the U-MLH, continuation to the WL1.
The most unlikely would be 3.
In my view, Party People should have left allready, but they refused to.
And that's why this time headaches will be the least problem they face.
Wating for a short signal, to load up heavy.

SPX500 – Bullish Bias Holds Above 6,680SPX500 – OVERVIEW
The price pushed higher last week following the PCE and GDP results, though uncertainty remains over a potential Fed rate cut at the next meeting.
Overall, the short-term trend remains bullish.
Upside Scenario:
Price is expected to test 6,699 and 6,708.
A confirmed break above these levels would open the way toward the next key target at 6,742.
Range Scenario:
If the index fails to hold above 6,700, expect consolidation between 6,700 and 6,672 until a decisive breakout occurs.
Pivot: 6,680
Resistance: 6,699 – 6,708 – 6,742
Support: 6,680 – 6,662 – 6,634

The S&P 500 Index Remains Positive Against the OddsThe S&P 500 Index Remains Positive Against the Odds
Today, the S&P 500 Index is trading close to a new all-time high, having opened Monday above 6,675 points. This reflects continued optimism among market participants despite factors such as:
→ The risk of a U.S. government shutdown on 1 October.
Today, President Trump will meet with Democratic and Republican leaders in Congress to try to prevent a halt to government funding. However, Reuters reports that chances of reaching an agreement are slim. At the same time, Bank of America analysts remain calm, noting that a shutdown would shave only around 0.1% off GDP per week, and historically such closures have had little impact on financial markets.
→ Jerome Powell’s hawkish stance at the September Federal Reserve meeting.
Nevertheless, most market participants expect the Fed to make another move towards cutting rates at its next meeting on 29 October. The publication of the PCE index on Friday increased this likelihood, as the figures came in line with forecasts, reducing the risk of a renewed inflation surge.
Technical Analysis of the E-mini S&P 500 Chart
On 17 September, analysing the 4-hour chart of the S&P 500 Index, we noted:
→ the price continues to fluctuate within an ascending channel, highlighted in blue;
→ the long body of the bullish candle on 11 September points to strong buyer pressure, indicating an imbalance, or, in Smart Money Concept terminology, a Fair Value Gap (FVG).
At present, the channel remains relevant, but it has expanded — bullish sentiment has shifted the key line (marked in orange) from resistance to support. At the same time, the FVG zone has confirmed its role as support.
Possible developments: the chart indicates a buyer advantage:
→ strong demand near the channel’s median (evident in the long lower shadows from Friday, marked with an arrow);
→ buying activity has been strong enough to push the price back (for now) within the ascending channel.
If buyer dominance continues, this could lead to a new all-time high, testing the upper boundary of the channel. From a bearish perspective:
→ the psychological level of 6,700 could act as resistance;
→ continued growth at Monday’s open could push the RSI indicator into overbought territory, creating potential for a correction.
However, as long as the S&P 500 Index remains above the orange support line, there is reason to believe that the bulls remain in control.
This article represents the opinion of the Companies operating under the FXOpen brand only. It is not to be construed as an offer, solicitation, or recommendation with respect to products and services provided by the Companies operating under the FXOpen brand, nor is it to be considered financial advice.

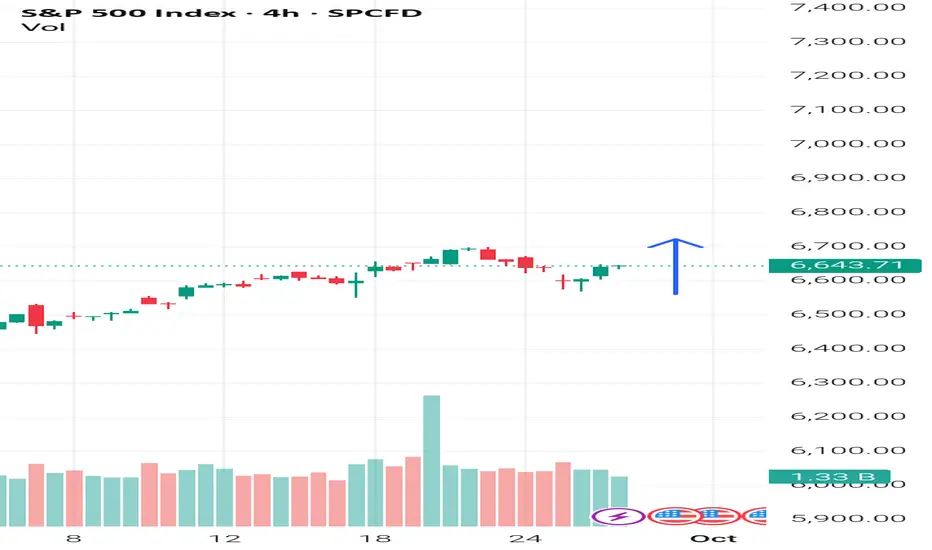
SPX: modest pullback, eyes on jobsDuring the previous week a small correction occurred on the US equity markets. The S&P 500 slipped down to the level of 6.570 on Thursday, but ended the week at 6.643. Regardless of a modest correction, the index is still moving close to the overbought territory. The key U.S. economic indicator this week was the August PCE Price Index. It rose 0.3% month-over-month, pushing the annual rate to 2.7%. Core PCE, which excludes food and energy, increased 0.2% m/m and 2.9% y/y. As per CME Fed WatchTool investors are continuing to price two rate cuts till the end of this year.
Among the biggest losers in the index was CarMax, whose stock plunged around 20 % after disappointing earnings and weak commentary about demand and inventory pressures. Oracle also underperformed, falling 5.6 % after concerns were raised over optimistic cloud growth projections. On the upside, Intel was a top gainer in the S&P 500 that day, surging 8.9 %, driven by reports of possible investment talks with Apple. IBM also posted a strong gain (5.2 %), buoyed by optimism around applying its quantum computing capabilities to bond trading.
The week ahead will be focused on US jobs data. The JOLTs Job Openings in August and Unemployment rate will be posted. This might bring again some higher volatility to the US stock markets, especially if data do not meet investors expectations.
September 29 - October 3 Market AnalysisHello everyone - it has been a while since I have posted an Idea. I tried to come up with a template for recurring posts earlier in the year that just became too time-consuming so I decided to wait until I worked out something different.
Lately, I have been moving away from purely focusing on technical analysis and more towards building a framework that helps me assess the overall market structure to set my bias before then looking to technicals and other indicators to find trade entries. My current approach utilizes three dashboards for market structure, which I call Macro, FX, & Risk. From there, I have a specific layout on Futures that helps me track order flow and momentum. When I feel like I have a good read on the market and am ready to make a trade, I then look at the 0DTE options chain and AMEX:SPY intraday chart to determine support/resistance and good entry points.
I’m still working on improving using this style of trading, but will try to journal my bias on a weekly basis from here forward if possible, which can help me determine areas where I am succeeding and others that could use improvement. For today, I will try to briefly run through each of my layouts with brief notes about how I am perceiving the market’s activity in context. I’ll look at this on a shorter scale in the future, but for now I am going to look at roughly the last 12 months, going back to October 2024.
Layout 1: Macro
On this layout, the goal is to gauge the overall market backdrop. Here, we can see that TVC:DXY declined until July where it began to flatten. It’s still moving down slightly on average but the slope is not as steep, however I would not yet call this a bottom as the current candlestick setup makes me think more downside is still a possibility.
The next two panes show a comparison of
• TVC:US03MY (risk-free short term yield); black
• TVC:US10Y (risk-free short term yield); white
• FRED:DFII10 (10Y real yield: US10Y minus inflation expectations from TIPS); blue
indexed to 100 and the “Inflation Gauge” which is the difference between the average nominal US bond yield ((US10Y+US03MY)/2) minus the 10Y Real Yield, which provides a rough estimate of inflation expectations. Here we can see that nominal and real yields have been on the decline since June. In the first part of this phase, the inflation gauge was rising, suggesting true risk-on behavior. Fed policy remained unchanged while there was a modest rise in inflation expectations, yet investors did not pile into gold, so equities were the preferred risk asset during this period, especially since the dollar remained flat as previously mentioned.
On the righthand side, inflationary commodities (namely Oil NYMEX:CL1! and Corn CBOT:ZC1! ) have mostly been suppressed during this calendar year, however Oil has remained in a flat range since June and Corn has been on the rise since the middle of August. Copper COPPER1! , which is more of a signal of industrial demand, has been on a steady rise since markets bottomed in April 2025 and may even be accelerating.
Since inflation expectations have been falling, the rise in Copper and Corn may be more of a demand signal, however if something causes Oil or the other two commodities to surge too quickly, these could turn into inflation drivers.
For now, the picture I’m seeing here is that the market’s risk-on appetite may be waning, in favor of safer bets like US Treasuries and Gold, even when inflation expectations are taken into account. Commodities and the Inflation Gauge will be important to keep watching, as correlation to the upside could quickly change the economic backdrop.
Layout 2: FX
Here, I am seeing that US nominal yields remain higher than most other major countries (Germany and Italy are both Blue to match EXY and are the solid and dotted lines, respectively) while the Dollar has seen a steep decline compared to other currency baskets over the same period. The message this sends to me is that investors are demanding a higher return on US debt while betting that monetary policy will ease, growth will slow, or both.
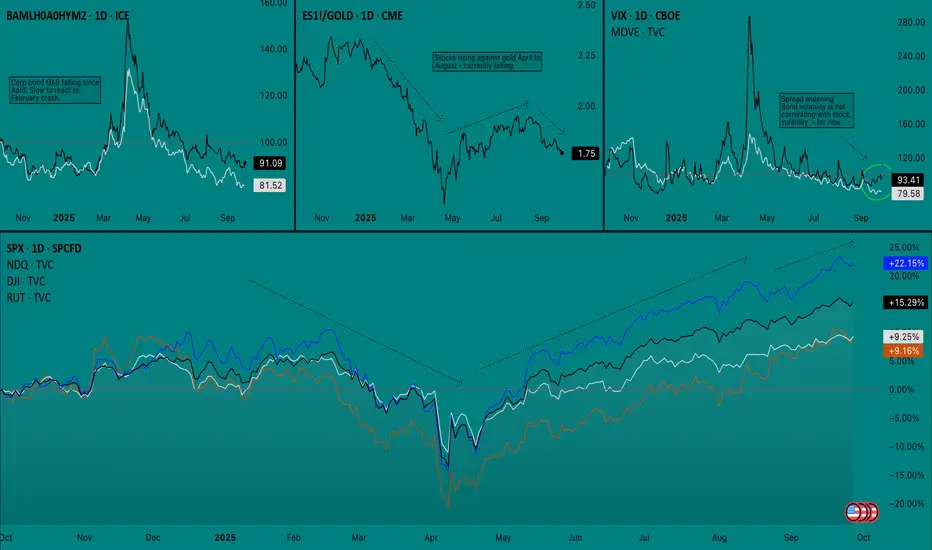
Layout 3: Risk
On this layout I am keeping track of the following
Top Left: Option adjusted spread (OAS) of corporate High Yield bonds/Investment Grade bonds
Top Middle: S&P 500 Futures/Gold spread
Top Right: TVC:VIX and TVC:MOVE overlay
Bottom: Stock index comparison (SPX, NDQ, DJI, RUT)
I should have mentioned earlier that I’m trying to keep the start/end of the arrows on all of the charts aligned. The takeaway here is that the last time we saw CME_MINI:ES1! sharply fall against TVC:GOLD , it provided an early signal for an equity sell off. The sell off Feb-April was a true risk-off event since both High Yield and Investment Grade bond yields surged and there was a simultaneous spike on VIX and MOVE. So far in September, we have seen stock volatility while bond volatility has remained flat. While VIX and MOVE were not leading indicators before, at the very least this indicates that equities are not yet ready to sell off.
Still, I cannot stress the point enough that Gold is very important to watch right now, especially as it relates to stocks since it can suggest that investors view it as the better risk asset, which cold lead them to dump the other (stocks) if an event makes it seem warranted.
——————————
Put simply, I think the market is saying the following:
1. More rate cuts are expected
2. Slower growth may be the bigger fear than inflation (at the moment)
3. Inflation worries are still present, yet diminished
4. Hedging with safe assets (bonds, gold) may be more attractive than stocks
5. Recent stock declines do not have risk-off confirmation
Next, I will take a look at my Bias chart, which right now mostly covers September thus far.
Layout 4: Bias
There’s a few things going on here that not everyone may be familiar with, so I’ll break it down pane-by-pane, as I have found this layout for Futures CME_MINI:ES1! to be very effective
Top Left: 50R chart with indicators only. CVD Daily (blue), CVD Weekly (black), Fisher Transform (y-axis log scale), Anchored OBV (daily)
Bottom Left: ES1! Line Break (3 lines, 1h)
Center: ES1! Renko (ATR, 15m)
Right: VIX (1h)
I’m using a 50R chart on the top left pane to filter time-based noise and to provide more data to be calculated into each bar on the CVD indicator, which gives more conviction to each move. CVD is the most important indicator here and I have found that comparing Daily and Weekly CVD becomes more effective as the week progresses and often shows hidden order-flow divergences.
Line Break creates a new line when the price closes in the same direction of the trend. Reversals only occur when the price crosses above or below three lines in the opposite direction. Successions of small boxes (like we see here) are easy to reverse than several long boxes in a row.
Renko is similar to line break but it is filtered by ATR and new boxes only have to clear the filter before a reversal prints.
On this layout, we can see that there was a battle last week on the order flow but buyers ended up finishing on top. Volatility was climbing for six sessions straight but ended up getting dumped on Friday (9/26). Futures are currently climbing back towards ATH on Sunday night, however the print on the Line Break chart has me cautious about if this will be quickly reversed. I’d like to see at least one long bar print heading into Monday if I’m going to go long, as Line Break must be aligned with whichever direction I trade in.
——————————
Conclusion: I’m approaching this week with a good deal of caution. While I do not think that we will see a true risk-off event until the market approaches a point where policy tightening is getting priced in (i.e. Fed is too dovish and accelerates inflation, leading to a quick policy reversal). Still, the market’s defensive positioning and relative waning of interest in stocks cannot be ignored. With Q4 being traditionally strong, the market may sell into the weakness in order to reposition for a bullish end of the year, even if the broader outlook is starting to signal trouble ahead.
I’m not confident about trading either side on Monday, so it could be a volatility rebalancing day. What I will watch for, however, is VIX finding support and whether or not Futures reach new ATHs before pulling back. ATH before a pullback would be the best bullish scenario, while a failure to make new highs could lead to a flat distribution or re-accumulation range. In which case, order flow and daily options positioning will be important to watch.
If this becomes a weekly thing I will definitely not be explaining all of my charts and indicators each time, and will opt to keep it brief but wanted to at least explain it all once in case anyone ends up following along. Let me know if you have any questions or suggestions on how I can sharpen my analysis. Thank you for reading - AP.
SPX should see a pump to 6,700$ immediately upon openas the title says..... and thereafter, price should get crushed for the rest of the week.
see linked ideas for our accuracy, we are here predicting financial meltdown on SPX and the cryptocurrency markets looming.
Despite AI valuation pressures, US500 outlook remains positive.
Robust US data tempered Fed rate-cut bets, dragging equities lower for a third day, though investors expect the pullback to be short-lived. Nvidia’s (NVDA) 100 bln USD investment in OpenAI has raised questions over vendor financing risks, deepening worries over elevated valuations. Still, institutions expect US equities to hold a tactical bullish stance. JPMorgan (JPM) projected that while a government shutdown and fragile sentiment may trigger midweek weakness, solid economic growth, a resilient labor market, and AI momentum could drive the S&P; 500 to 7,000 by year-end.
US500 remains within the ascending channel, sustaining its steady uptrend. After briefly testing EMA21 and the channel’s lower bound, the index rebounded, indicating the potential extension of a bullish structure. If US500 continues to hold within the channel, the index may gain upward momentum toward the resistance at 6700. Conversely, if US500 breaks below the channel’s lower bound and EMA21, the index could retreat toward the support at 6530.

US500 Long Idea: Bullish Retest of Flipped Support LevelHello TradingView Community,
This post outlines a potential long trade setup on the USA S&P 500 Index (US500) based on the 15-minute chart.
Technical Analysis:
The index is currently in a clear uptrend, showing consistent higher highs and higher lows. We can identify a key horizontal price level at approximately 6,571.95. This level acted as a significant resistance point in the past, where the price struggled to break through.
Recently, we have seen a decisive breakout above this resistance, which is a strong bullish signal. The trading idea is based on the "resistance-turned-support" principle. We are anticipating a pullback to this broken level, which is now expected to act as a new support floor. A bounce from this area would confirm the continuation of the bullish trend.
Trade Setup:
The long position tool on the chart visualizes a specific plan for this bullish scenario:
Entry: Approximately 6,571.95 (at the retest of the new support).
Stop Loss: 6,531.55 (placed below the support structure to protect against a failed retest).
Take Profit: 6,689.67 (targeting a new higher high in the current trend).
This setup provides a structured approach with a clear risk-to-reward ratio for a potential move higher.
Disclaimer: This analysis is for educational and discussion purposes only and should not be considered as financial advice. Trading indices and other financial instruments involves significant risk. Please conduct your own research and manage your risk accordingly.

As ES broke previous resistance, I’m buying to next last highbroke previous resistance, I’m buying to next last high

The Truth Behind Profitable TRADING ( must read)Please note : This post isn't meant to scare you away from trading. Quite the oposite. It's meant to show you what NO ONE TALKS ABOUT IT. Better to see it clearly now than learn it expensively later. This post comes from someone with more than 7 years of market experience
♾️How To Really Become Profitable?
Profitable trading is not about finding a magic holy grail, strategy, course or even mentor.
Of course, they can help you, but at the end of the day... You are the ONLY ONE behind the final click.
Profitable trading is all about you! but how?
Let’s get into it !
The average human is not wired to properly trade the financial markets...We are wired in the worst way to be a consistently profitable trader. Trading goes against the human psychology.
To all those learning to trade the financial markets, this game is not what you think it is.
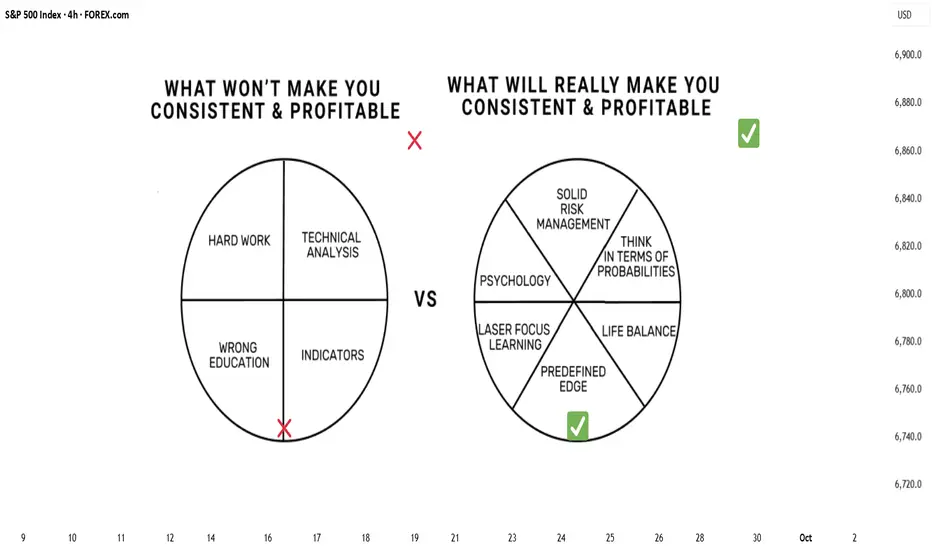
Most books and courses simply do not paint an accurate picture of the reality. Most of traders think the only way to become profitable is focusing on the wrong things:
❌ WHAT WON'T MAKE YOU PROFITABLE
MORE INDICATORS
MORE HARD WORK
MORE TECHNICAL ANALYSIS
MORE WRONG EDUCATION
The truth is that all of these will never really bring you consistent results.
Here’s a list of 6 elements that from my experience are game changers. I will go deep in each element so that you can really understand. Do us a favor and please support and comment this IDEA so that we can reach more traders.
The first and most important element:
✅ PROPER RISK MANAGEMENT
That is the number one killer and doer.
For most traders, they open a position size much larger than they can mentally afford. The problem is that by over risking you automatically let emotions have control over you.
someone once told me:
When emotions increase, accuracy decrease.
Trading is a Game of probabilities you can do everything right and end up wrong and you can do everything wrong and end up winning. There is a random distribution of winning and losing trades. You must be ready to become confortable by losing. You must understand your degree of tolerance. Only you know your risk profile. Only you know what you can afford to lose
Only you know the weight of your current life situation. Only you know you risk apetite.
If you are having a bad situation with risk, just reduce your risk so you can get back the control. You must find the proper position size. This is not about the size of your account or the size of the position in dollars. It's about how confortable you are with proper position sizing.
PROPER POSITION SIZE IS ALSO MENTAL !
✅ PROPER PSYCHOLOGY
For most traders without seing consistent results, they believe their system needs some implementations or modifications, and they focus more on the “analysis” side by learning more stuff. They are in a infinite loop hoping to find that next holy grail. The truth is that you don't need more technical analysis indicators or course. You just need to sit in front of a mirror and understand how your bain acts when you trade.
You must understand how you are affected when trading.
There are many psychological aspects you should focus. We can talk years about it. I advise you to read Mark Douglas for that. One of the most important things is to Dissolve or reduce all your fears. You must learn to trade by dealing daily with your FEARS. You must understand and have a deep talk with yourself to see the way fear control your mind.
Here are 4 types of fears when it comes to trading:
Fear of being wrong
Losing money ,
Distribute profit
Missing out
By other side you must understand the neuro associative conditioning that created good trading habits and self-destructive habits.
Here are some examples of different neuro associative conditioning:
Pro trades see retracements as opportunity to add to their positions while newbies see retracements as threats and might close the trade in profit in a simple pullback.
Pro traders have hope when they have a winning trade and despair when they have a losing trade. While newbies have hope when they have a losing trade because they don't want to be proven wrong, they also have despair to distribute profits when they have a winning trade simply doing a pullback
there are infinite examples. EVERY TRADER HAS IT'S OWN neuro associative conditioning that make or break them.
✅ Healthy LIFE BALANCE
As Paul Sartre said, we are our choices.
What we do with our 24 hours will define the kind of person we are & we become. This is all about changing and adopting proper habits in your pro and personal life.
If you don't manage to balance your personal life... All those bad vibes will send resistive energy and when you get this energy you can either shut down or step through and doo exactly what you are supposed to do regardless. Take care of your personal habits and problems.
Avoid bad habits that drain your energy and focus on good habits that will make your BODY MIND perform well or at least well such as working out, sleeping well, eating clean etc...
Trading is not made for the undisciplined human being. Take care of your body & mind.
Before getting serious with trading, I I used to have a lot of bad habits that honestly, I’m not proud of it. But everything can change.
It’s all about building a proper internal well-being environment.
✅ THINK IN TERMS OF PROBABILITIES
Mismanaging risk is a bad habit. Most of traders have the worst trading habits because they asume the outcome and they don’t like to be wrong. They assume they know what the outcome will be, so they bail out of trades. They think it will make them more money, so they risk more in one single trade because they believe this trade is a high probability one that it will make them money. They have a trade by trade approach. they execute with a Can’t lose mentality
They assume that after a few wins the next trade is likely to be a winner, so they double up. They assume that after a few losses the next trade is likely to be a loss, so they do not execute or they reduce the risk.
It’s okay we all have been there.
By adopting simple proper” SERIES OF TRADE APPROACH” your outcome will change and you will become profitable in the long run. This is what we call think in terms of probabilities.
This is the approach that a few minorities of the traders use. This approach is not based on predicting anything; rather this is a precise pre-defined system of pulling the trigger when your system or edge presents itself, and the outcome of the trade is irrelevant. ALL YOU CARE IS about the outcome of a series of trades.
We take a series of trades, and we are entirely focused on the outcome of the series, and NOT the outcome of each individual trade. The outcome of each trade and attempting to predict the outcome of each and every trade is an uphill battle. You won't be able to predict the outcome of one single trade but yes you will be able to predict the outcome of a series of trades
✅ SOLID PREDEFINED EDGE
Mentors can transfer you knowledge but never experience. You need to use their experience to create your own plan make sure to set rules to find good trades execute those good trades and let those good trades play out. Trading is very personal. What might work for some might not work for you and that's okay. What might work for you might not work for someone else. Everyone is different.
✅ LASER FOCUS LEARNING CURVE
Those who make it in this business were laser-focused; they made a decision to either be right or wrong. A laser shines a coherent beam of light and is powerfully focused on a single point. That point will undergo immense heat or pressure. Same applies to learning to trade. It requires all your energy to be put forth on a single objective.
Compare this with a light bulb or the sun, which shines its rays outwardly with its energy distributed in all directions. You will barely feel the heat as the energy is unfocused and dissipates accordingly. This applies to those traders who have issues They doubt their decisions and jump from one strategy to another they chase the holy grail they change from system, they buy multiple courses, change of style etc….. There is million ways to make money in the markets but only you will make it with your own way. My advice if to become like a laser focus.
SOLID EDGE SOLID EXECUTION NOTHING ELSE.
Make a decision and instead become focused like the laser beam on what it is that you desire to develop, and you are more likely to achieve your target.
In order to keep in mind this, remember this quote of Bruce Lee “I fear not the man who has practiced 10,000 kicks once, but I fear the man who has practiced one kick 10,000 times.”…
⚔️ Final Word
Trading can be simply if you focus on the right things and quit the wrong things.
Forex weekly review: fundamental analysis.Contrary to many predictions (mine included), the USD maintained its strength throughout the week starting Monday 22 September.
The USD has been on the front foot since the FOMC meeting. Even though rate cuts are coming, it won't be as fast paced as the market priced in a few weeks ago. And this week the 'rate cut dial' moved again, (two cuts instead of three before year end?), thanks to a bout of positive US data (GDP and unemployment claims).
Friday's 'in line with concenciuos' PCE data didn't give any clues as to what next week will bring, trading is a lot more straightforward when data releases are 'outside of concenciuos'.
All things considered, inflation is falling (albeit slowly), company earnings remain upbeat, 'softening data' isn't softening too rapidly. Barring geopolitical concerns or fresh tariff woes, the 'soft landing narrative' remains. And I'll behind the new week with a 'tentative risk on bias'.
My preference for a 'risk on' trade is AUD or GBP long vs JPY. But I am prepared to trade whichever currency has the momentum at the time Vs the JPY. And it is still up in the air as to whether the USD could be the long part or the short part of a 'risk on'' trade.
Failing a risk on trade. It does seem the currencies are at times behaving according to 'interest rate speculation' the NZD in particular is having periods of weakness (dovish RNBZ, 0.5bp rate cut incoming?). Which opens the door to an AUD (hot CPI) NZD relative fundamental trade.
Finally, the SNB held interest rates at 0%, seemingly reluctant to revert to negative rates. The SNB's hands are tied in terms of future moves. And until inflation falls far enough to warrant another cut, the CHF could remain relatively strong.
On a personal note, I unfortunately missed the 'prime opportunities of the week'. ( Post CPI AUD long and Thursday's post US data USD long). It's easy to say with the benefit of hindsight but I would suggest both were valid opportunities in the immediate aftermath of the data release.
Instead, I had to make do with a 'speculative' AUD USD 4hr support and resistance trade, which stopped out as the USD maintained its strength.
Let's see what the new week brings.
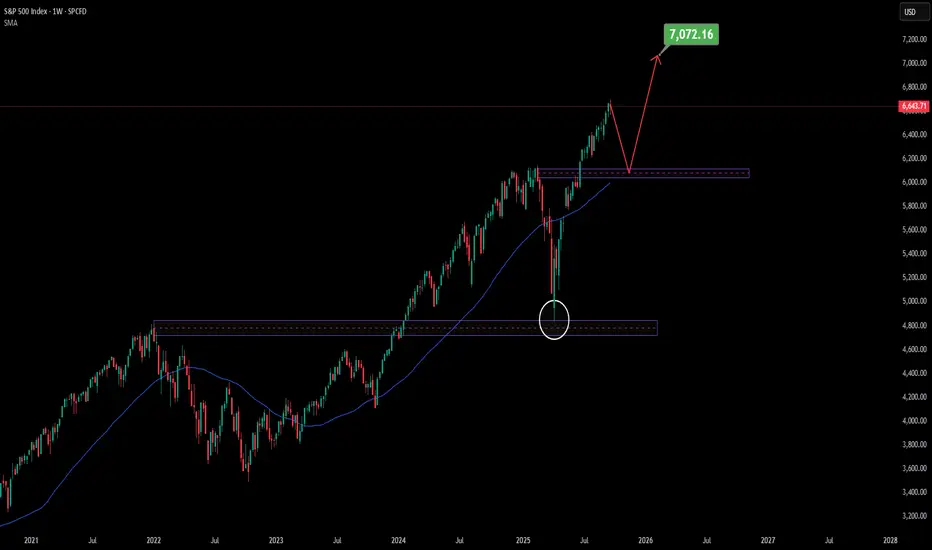
My view on S&P 500Looking at the structure, I think the S&P 500 may first pull back to retest the support zone, just as it did in April of this year when price dipped to that same area before continuing higher.
This time, the support and the 50-week SMA are aligning together, creating a strong confluence that could serve as a base for the next upward move.
From there, my view is that SPX could rebound and eventually push into a new all-time high around 7,000.
🎯 Conclusion: My outlook is constructive — I expect SPX to repeat its April-like retest, find strength at the confluence of support and the 50 SMA together, and then rally toward the 7,000 level. Still, markets are unpredictable, and this remains only my view.
👉 For more structured market insights and professional analysis, follow along.
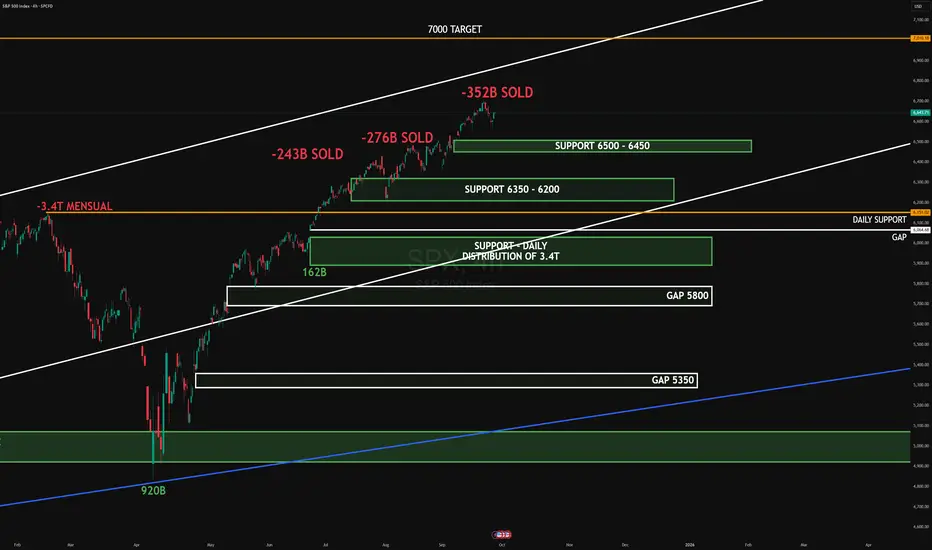
SPX SEP-OCT 2025SPX rejected at the 6600 area after heavy institutional distribution (-352B). Price is consolidating above key support zones at 6500–6450 and 6350–6200. Stronger demand sits at 6100, where the 3.4T daily absorption was previously noted. Below that, unfilled gaps remain at 5800 and 5350.
Upside target: 7000 if supports hold and momentum returns.
Downside target: 5800 gap fill if 6350 breaks.
#SPX #globaltrade #investment #investing #stockmarket #wealth #realestate #markets #economy #finance #money #forex #trading #price #business #currency #blockchain #crypto #cryptocurrency #airdrop #btc #ethereum #ico #altcoin #cryptonews #Bitcoin #ipo
US 500 trade idea1. The market is currently above both moving averages: 50 ema and 200 ema
2. H4 support zone was tested, market showed some rejections, and is bouncing off to the upside
4. RSI >50, This confirms momentum to the upside
5. Buy the market at a current price and apply proper risk management (at least 2:1 risk to reward)

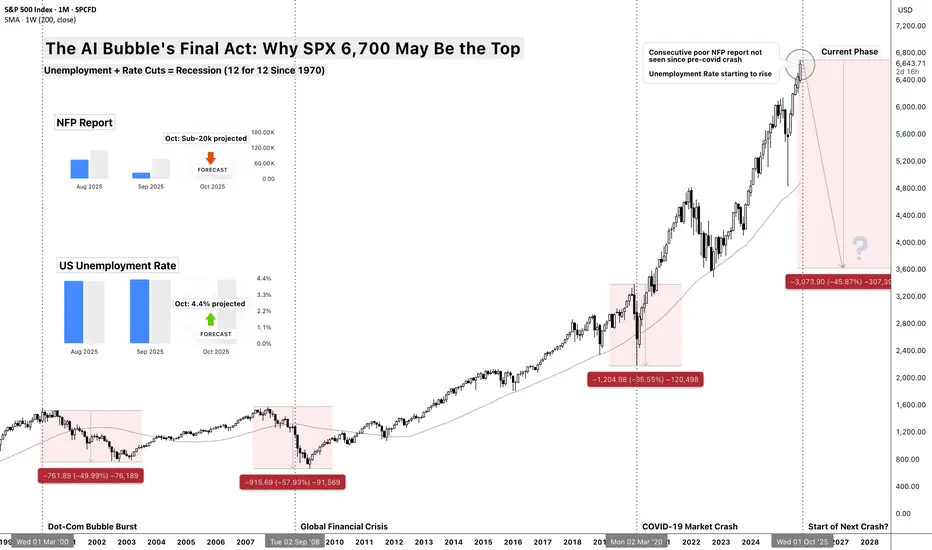
The AI Bubble's Final Act: Why $SP:SPX 6,700 May Be the TopThe AI Bubble's Final Act: Why SP:SPX 6,700 May Be the Top
Unemployment + Rate Cuts = Recession (12 for 12 Since 1970)
The Death Cross Pattern
There's a simple rule that's worked for 55 years: When the Fed cuts rates while unemployment is rising from cycle lows, recession follows within 12 months - every single time.
Think of it like a doctor taking your temperature while giving you painkillers. The medicine might make you feel better temporarily, but if the fever is rising, something serious is wrong underneath.
Current Status:
✅ Fed just cut rates ECONOMICS:USINTR (September 2025)
✅ Unemployment ECONOMICS:USUR rising from 3.4% cycle low
✅ TVC:SPX at all-time high ($6,700)
Historical Result: 12/12 times = recession + 35% average equity crash
The Precedent: Crisis Follows a Script
2000 Dot-Com Bubble:
Setup: TVC:SPX at ATH (1,550), ECONOMICS:USUR unemployment at 3.9%, ECONOMICS:USINTR Fed starts cutting
Crisis: Technology "revolution" story breaks down
Result: -49% crash over 2.5 years
Recovery: 7 years to new highs
2008 Financial Crisis:
Setup: CBOE:SPX at ATH (1,576), ECONOMICS:USUR unemployment at 4.4%, ECONOMICS:USINTR Fed starts cutting
Crisis: Housing/credit bubble bursts
Result: -57% crash over 1.5 years
Recovery: 5 years to new highs
2025 AI Bubble:
Setup: SPREADEX:SPX at ATH (6,700), ECONOMICS:USUR unemployment at 3.4%→4.2%, ECONOMICS:USINTR Fed starts cutting ✅
Crisis: AI productivity story meets employment reality
Projection: -35 to -45% crash over 18 months
Recovery: 3-5 years (faster due to tech infrastructure remaining)
The AI Employment Paradox
The Productivity Mirage
Wall Street celebrates AI boosting productivity, but here's the paradox:
productivity gains = job losses = reduced consumer spending = recession.
Think of it like a factory owner celebrating a new machine that replaces 100 workers. Great for margins, terrible for the local economy when those 100 families stop spending.
Jobs ECONOMICS:USNFP at Risk by Sector:
Customer Service: 2M jobs (chatbots replacing agents)
Software Development: 500K jobs (AI-assisted coding reducing teams)
Transportation: 3M jobs (autonomous vehicles accelerating)
Administrative: 4M jobs (AI handling routine tasks)
Content Creation: 1M jobs (AI writing, design, video)
Total Impact: 10+ million jobs facing displacement over next 2-3 years
Why This Time is Different?
Unlike previous automation waves that created new job categories, AI is targeting cognitive work directly. A factory worker could become a service worker, but what does a displaced knowledge worker become?
Valuation Extremes: 1929 Levels with 2025 Leverage
Current Valuation Metrics:
Shiller CAPE: 38+ (higher than 1929's 33)
Buffett Indicator: 195% (market cap/GDP, historical average 85%)
Price/Sales: 3.3x (vs 1.4x historical average)
Forward P/E: 23x (on optimistic AI earnings assumptions)
Valuations today exceed 1929 by most measures - but with far more leverage embedded in the system. If 1929 was a valuation bubble, 2025 is that bubble layered with derivatives, corporate debt, and passive flows.
The Leverage Layer:
Margin Debt: $1.023 trillion (record high)( as of July 2025, ycharts )
Corporate Debt/GDP: 85% (vs 45% in 2000)
Derivatives Exposure: $700 trillion notional ( as of June 2025, BIS semiannual data )
ETF/Passive Flows: $1.5 trillion annually (forced selling on reversals)
When liquidity stress hits, derivatives amplify shocks - notional exposure dwarfs underlying assets.
Think of today's market like a house of cards built on a trampoline. Even small bounces can bring the whole structure down.
Technical Breakdown: The Charts Don't Lie
Major Warning Signals:
Market breadth has deteriorated from 90% in Q4 2024 to ~60% today,
Defensives led earlier in the year,
TVC:VIX Volatility’s floor has shifted higher
Credit risk appetite (HYG/TLT) is stretched.
Together, these signal fragility beneath the index surface.
The Three-Stage Technical Collapse:
Stage 1 - The Warning (Now-Q4 2025):
Current Level: $6,700
Initial Support: $6,200 (previous resistance)
Character: Failed rallies, rotating leadership, "healthy correction" narrative
Target: 5,800-6,000 (-10 to -13%)
Stage 2 - The Cascade (Q4 2025-Q2 2026):
Breaking Point: Below 5,800 triggers algorithmic selling
Character: "Buy the dip" stops working, margin calls begin
Target: 4,800-5,200 (-25 to -30%)
Stage 3 - Capitulation (Q2-Q4 2026):
Final Flush: Panic selling, ETF redemptions
Character: "Markets will never recover" sentiment peaks
Target: 3,700-4,200 (-35 to -45%)
The Catalyst: When Reality Meets Hype
Q4 2025 Earnings Season - The Reckoning
Companies will face impossible questions:
"You spent $50B on AI - where's the revenue growth?"
"Productivity is up 20%, why are you laying off workers?"
"If AI is so transformative, why are margins declining?"
The Employment Data Domino Effect:
October/Nov NFP: First print above 250K unemployment claims
November Consumer Spending: Down 2%+ as job fears spread
December Holiday Sales: Weakest since 2008
January Layoff Announcements: Tech companies start "right-sizing"
Think of it like the moment in 2000 when investors finally asked: "How exactly does Pets.com make money?" or 2007 when they wondered: "What's actually in these mortgage bonds?"
Sector-by-Sector Breakdown
Technology (-50 to -70%)
AI hype stocks get destroyed first
Software companies face declining growth + competition
Semiconductor cycle turns negative
Biggest Losers: NVDA, MSFT, GOOGL
Consumer Discretionary (-40 to -55%)
Unemployment hits spending immediately
High-end retailers crushed first
Auto sales collapse with higher rates
Biggest Losers: TSLA, AMZN, NKE
Financials (-30 to -45%)
Credit losses surge as economy weakens
Interest margin compression
Commercial real estate exposure
Biggest Losers: Regional banks, non-bank lenders
Relative Outperformers (-15 to -25%)
Utilities, Healthcare, Consumer Staples
Companies with genuine AI cost savings
High-dividend yielders in low-rate environment
Key Dates and Catalysts
October 2025:
Jobs report (first warning?)
Q3 earnings disappointments
Fed meeting (dovish pivot?)
November 2025:
Election aftermath volatility
Black Friday sales data
Thanksgiving week low-volume crashes
December 2025:
Year-end tax selling
Institutional rebalancing
Holiday retail reality check
Q1 2026:
Layoff announcements surge
Earnings guidance slashed
Credit events begin
The Recovery Setup
Why This Crash Creates Opportunity:
Valuation Reset: P/E ratios back to historical norms
Weak Hands Flushed: Margin traders eliminated
Government Response: Fiscal + monetary stimulus
AI Infrastructure Remains: Real productivity gains continue post-bubble
Recovery Timeline:
Bottom: Q4 2026 around 3,700-4,200
Initial Rally: 30-50% bounce over 6 months
New Bull Market: Begins 2027 with stronger foundation
New Highs: 2029-2030 timeframe
Risk Management Rules
This Analysis Fails If:
Fed pivots to massive QE before crisis
Fiscal stimulus exceeds $2 trillion quickly
AI productivity gains offset job losses faster than projected
Geopolitical crisis overrides economic fundamentals
Probability Assessment:
60%: Correction to 4,800-5,500 range (25-30% decline)
25%: Major crash to 3,700-4,200 range (40-45% decline)
15%: Continued melt-up through 2026 (soft landing achieved)
Conclusion: The End of the Everything Era
At SPX 6,700 with unemployment rising and the Fed cutting rates, we're witnessing the final act of the 15-year "everything bubble."
The AI revolution is real, but like the Internet in 2000, revolutionary technology doesn't prevent financial gravity.
The bubble is ending exactly like the previous ones - with everyone believing "this time is different" right until it isn't.
Smart money is already rotating defensive. The question isn't whether a correction is coming - it's whether you'll be positioned for it.