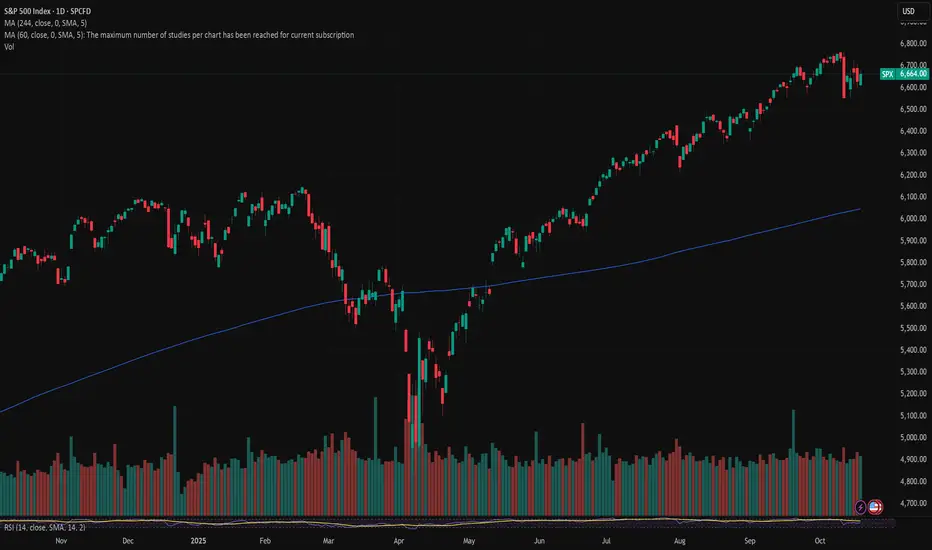
S&P 500 Index Near Key Resistance – Correction Ahead?Recently, the S&P 500 ( SP:SPX ) has seen some sharp moves with high momentum due to the tariff tensions between the US and China over the past couple of weeks. These moves have also impacted other correlated markets like cryptocurrency .
In the past day, news came out that Trump is planning to meet the Chinese president on October 31st . With markets opening, the S&P 500 started to rise and is currently moving near a Resistance zone($6,734_$6,690) and close to its Resistance lines .
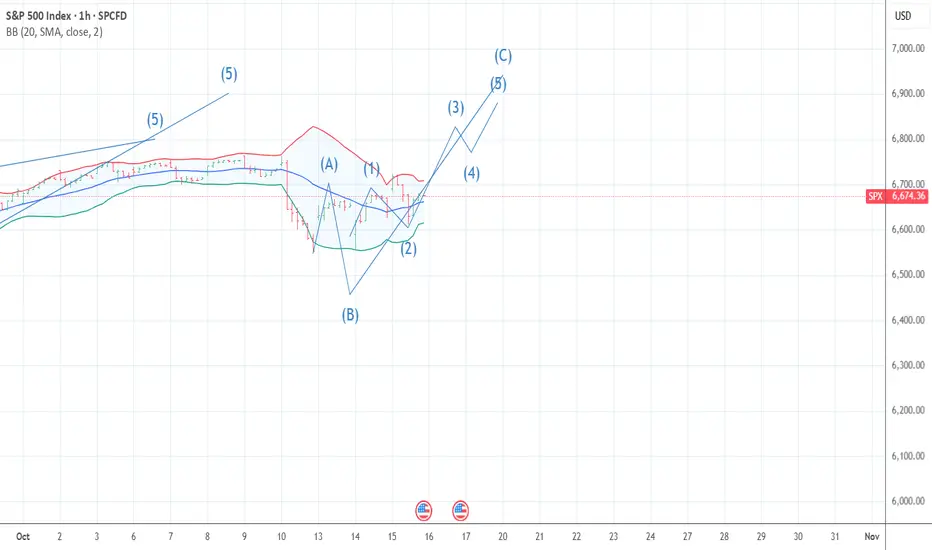
From an Elliott Wave perspective, it seems that the S&P 500 is completing a microwave 5 of the main wave C , and the corrective structure looks like an Regular Flat(ABC/3-3-5) .
I expect that in the coming hours, the S&P 500 index could drop at least to around $6,641(First Target) .
Second Target: $6,611
Stop Loss(SL): $6,735
Note: The $6,641 level is quite important in the context of the recent rally and could act as both support and resistance for the S&P 500.
A possible decline or fall in the S&P 500 index could also cause Bitcoin to decline (due to Bitcoin's high correlation with the S&P 500 index in recent weeks).
Please respect each other's ideas and express them politely if you agree or disagree.
S&P 500 Index Analyze (SPX500USD), 1-hour time frame.
Be sure to follow the updated ideas.
Do not forget to put a Stop loss for your positions (For every position you want to open).
Please follow your strategy and updates; this is just my Idea, and I will gladly see your ideas in this post.
Please do not forget the ✅' like '✅ button 🙏😊 & Share it with your friends; thanks, and Trade safe.
Trade ideas

SPX: Markets have spokenThe previous week continued to be volatile on US equity markets, after the Fridays sell off, two weeks ago. It seems like with all uncertainties coming from the US Government, the market took the time and said: it's enough. This was especially evident on intraday trading, where values of equity indicators were moving from highly negative to highly positive. It seemed like there was no direction in trading. Eventually, the Friday trading session ended up in a positive territory, where the S&P 500 closed the week at 6.664 or 0,5% higher for the day. In order to save the day, the US President commented shortly on Friday on social networks, that 100% tariffs on imports from China is not sustainable. Previously, Fed Chair Powell noted at NABE Conference that further cuts are still an option in the future period, but it will depend on data. At the same time, the US Government continues to be in the state of “shutdown”, not providing any relevant macro data. Both investors and the Fed are currently acting in a sort of blindfolded territory.
Nvidia was especially under pressure during the previous week. The only positive day for the stock was Friday, where the share price increased by 0,78%, but still marking negative territory for the second week in a row. Shares of Apple surged by 1,96% on Friday after the announcement of a contract between Apple and Formula 1 over five-year exclusive U.S. media-rights with Formula 1, starting from 2026, under which Apple TV will become the sole U.S. broadcaster of all F1 races. On the other hand, the semiconductor industry has not experienced such a high volatility. The TSMC delivered a standout performance, topping earnings expectations and raising its guidance, through which the company fuelled investors' confidence.
Without official macro data, the week ahead will be another one which will be guided by fundamentals and/or announcements from the US Administration. It means that markets are going to stay within the “yellow” zone. Analysts are commenting that this zone does not mean that the market will switch to the red zone and significant correction, but only that they are currently highly alerted.
forecast for how it should be forming like 12/6 to 2/19 topping My view of how it should form it this wave . The fear index is in a place bottoms form so what I think is about to happen
Failure to Reach 6813 Will Result In Bloodshed for SPXThis will get ugly very quick if buyers/investors can't reach 6813 quickly.
SPX500 Slips as Netflix Earnings Cool Wall Street OptimismWall Street Futures Struggle as Netflix Results Weigh on Sentiment
U.S. stock index futures fluctuated on Wednesday as investors moved cautiously through a heavy earnings season, with Netflix’s weaker-than-expected profits cooling risk appetite and adding pressure to market sentiment.
🕯 Technical Outlook
SPX500 has collected volume below the 6,754 pivot line, suggesting potential bearish correction ahead.
As long as the price trades below 6,754, the bias remains bearish, targeting 6,738 → 6,717 → 6,699.
Conversely, a 1H close above 6,771 would confirm a bullish continuation, paving the way toward 6,792 → 6,838.
Pivot: 6,754
Support: 6,738 – 6,717 – 6,699
Resistance: 6,771 – 6,792 – 6,838

SPX500 – Overview | Bearish Pressure Below 6,699SPX500 – Overview | Bearish Pressure Below 6,699
U.S. stock futures opened the week flat, as easing U.S.–China trade tensions offered some relief to markets.
Investors are now turning their focus to a busy earnings week and upcoming inflation data, while diplomatic meetings between U.S. Treasury Secretary Scott Bessent and Chinese Vice Premier He Lifeng aim to further defuse tensions ahead of a potential Trump–Xi summit later this month.
🕯 Technical Outlook
SPX500 remains under bearish momentum while trading below 6,699, targeting 6,670 → 6,633 → 6,610.
If the price closes a 1H candle above 6,716, it would shift momentum bullish, with upside targets at 6,754 and beyond.
Pivot: 6,699
Support: 6,670 – 6,633 – 6,610
Resistance: 6,716 – 6,731 – 6,755

S&P500 - $8.000 is the ultimate target!🎊S&P500 ( TVC:SPX ) continues the bullrun:
🔎Analysis summary:
Over the course of the past couple of months, the S&P500 has been rallying +40%. However, this does not mean that the bullrun is over any time soon. Since the S&P500 perfectly respects the rising channel pattern, a move to the upper trendline is the target.
📝Levels to watch:
$8,000
SwingTraderPhil
SwingTrading.Simplified. | Investing.Simplified. | #LONGTERMVISION

S&P 500 Index Shows Elevated VolatilityS&P 500 Index Shows Elevated Volatility
On the 4-hour chart of the S&P 500 Index (US SPX 500 mini on FXOpen), the ATR indicator with standard settings has not fallen below the 30 mark, signalling higher current market volatility compared to previous periods. Traders’ decisions are being influenced by the ongoing government shutdown, developments around a potential US-China tariff deal, and an increasingly active earnings season. Market sentiment has also been shaped by renewed concerns over regional bank stability and profit-taking in AI-related stocks.
Looking ahead, the new week is also expected to bring heightened volatility, as:
→ US Treasury Secretary Scott Bessent and Chinese Vice Premier He Lifeng are set to meet in the coming days, paving the way for a potential meeting between Presidents Trump and Xi later this month.
→ Attention will also turn to quarterly results from Netflix, Coca-Cola, Tesla, IBM, and Intel. With key US economic data releases suspended due to the government shutdown, investors are likely to look to corporate earnings for direction.
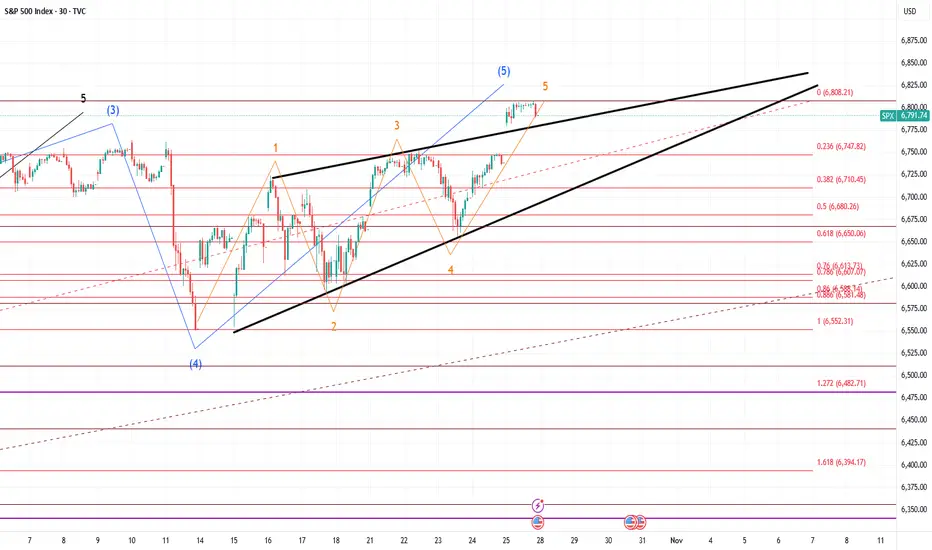
Technical Analysis of the S&P 500 Chart
Major turning points on the 4-hour S&P 500 chart, highlighted in bold, outline a broad ascending channel that reflects the market’s expanded price swings.
From a bullish perspective:
→ The price remains in the upper half of the channel.
→ Market sentiment is improving, with prices moving closer to last week’s highs during the European session.
→ As indicated by the arrow, a wide bullish engulfing pattern formed near the lower boundary of the channel, confirming strong buying interest around the 6,560 level.
From a bearish standpoint:
→ Selling pressure was particularly aggressive near 6,720, pushing the price lower on 10 October.
→ Last week, this level once again acted as resistance, suggesting that bears maintain control there, limiting near-term upside potential.
Given these dynamics, traders may wish to adjust their strategies to account for the prevailing volatility. Should positive headlines emerge on US-China trade progress, supported by upbeat corporate forecasts, the S&P 500 could make a push towards the upper channel boundary, potentially setting a new record near the 6,800 mark.
This article represents the opinion of the Companies operating under the FXOpen brand only. It is not to be construed as an offer, solicitation, or recommendation with respect to products and services provided by the Companies operating under the FXOpen brand, nor is it to be considered financial advice.

SPX500 Bullish Breakout!
HI,Traders !
#SPX500 is going up now
And the price broke the
Key horizontal level
Around 6695.82 and
The breakout is confimred
So we are bullish biased
And we will be expecting
A further bullish move up !
Comment and subscribe to help us grow !

SPX500 On the way to the upside! BUY NOWSPX500 is in a clear upwards channel and has broken the last bit of resistance (white trendline shown) - this is a clear confirmation that the next target will be the red trendline to the upside (next resistance level) - this is a great time to buy

This is the END(ing diagonal)The ending diagonal has formed. If you check RSI you will see a double daily and fresh WEEKLY divergence. It will crash hard next week. 6480 is the first target, but it can be just a bounce area. 1.618 level from low to top of the diagonal is at 6400 level on SPX and at 6300 level on US500 - I think we can get a flash-crash into this area next week. And if this is a reversal, it can trend down to February peak and lower according to fibs.
SPX500 Eyes 7000 — Breakout or Bull Trap Ahead?🦸♂️ SPX 500 Heist: The 7K Bull Run Playbook (Swing Trade Setup) ✅
Alright, crew, listen up! The market is a vault, and we're here to make a strategic withdrawal. The SPX 500 is showing us the blueprints for a potential bullish breakout. This is our plan to ride the wave.
🎯 The Master Plan: BULLISH
We're looking for a classic breakout play. The gates are at 6780, and once they're open, we're going in.
⚡ Entry Signal (The "Go" Signal)
Action: Consider long positions ONLY AFTER a confirmed daily breakout and close above the key level of 🎯 6780.00.
Translation: Don't jump the gun. Wait for the market to show its hand.
🚨 Stop Loss (The "Escape Route")
Location: My suggested escape hatch is down at 🛡️ 6600.00. Place it after the breakout we talked about.
A Note from the OG: "Dear Ladies & Gentleman (Thief OG's), I am not recommending you set only my SL. It's your own choice. You can make money, then take money at your own risk." 😉
💰 Profit Target (The "Loot Bag")
Destination: We're aiming for the major resistance zone at 🎯 7000.00. This is a psychological magnet and a previous area where sellers stepped in.
Why Here? It's a zone of strong resistance, potential overbought conditions, and traps for the greedy. Be smart and escape with your profits!
Another OG Note: "Dear Ladies & Gentleman (Thief OG's), I am not recommending you set only my TP. It's your own choice. You can make money, then take money at your own risk." 😎
🔍 Market Intel: Pairs to Watch
A master thief always checks the surrounding area. Keep an eye on these correlated assets:
AMEX:SPY (SPDR S&P 500 ETF): The direct tracker. Moves almost tick-for-tick with the SPX.
NASDAQ:NDX (Nasdaq 100): Tech-heavy cousin. If NDX is strong, it often pulls SPX up with it.
TVC:DXY (U.S. Dollar Index): Our usual antagonist. A stronger dollar can be a headwind for large-cap stocks.
CME_MINI:ES1! (S&P 500 E-mini Futures): The real-time action. This is where the big moves often happen first.
✨ Community Boost
If you find value in my analysis, a 👍 and 🚀 boost is much appreciated — it helps me share more setups with the community!
#SPX500 #SP500 #SwingTrading #MarketPlaybook #PriceAction #ThiefTrader #IndexAnalysis #TechnicalAnalysis #TradingStrategy #US500 #Equities #BreakoutStrategy #TradingView #StockMarket #RiskManagement

SPX500 | Futures Rise on Intel Boost Ahead of CPI DataSPX500 | Futures Rise on Intel Boost Ahead of CPI Data 📊
Wall Street futures edged higher on Friday, lifted by strong Intel earnings, as investors await a crucial U.S. inflation report (CPI) that could influence the likelihood of a December rate cut.
Technically, the SPX500 maintains a bullish structure, with potential to extend gains toward 6,792 → 6,838, especially if CPI data comes in below or in line with expectations.
However, if inflation prints higher than expected, the index could face bearish pressure toward 6,720 → 6,670.
Pivot Line: 6,770
Resistance: 6,792 – 6,838
Support: 6,720 – 6,670
S&P 500 Bear Market in 2026The Stock market is going to send Crypto into a Bear market in 2026.
It just broke it's weekly cycle count and it's currently painting a bullish divergence. This means only one thing - we are going into a blow-off top within the next 2 months.
We are going to top above 7000 area, and in case we don't have a proper retracement into the Weekly Cycle low within November, we are going to make a blow-off top in December/January.
2026 Year will be profit taking year and the stock market is expected to retrace 20%, while Bitcoin will go down by more than 50%.
It's the last leg of the bull and it's time to get allocated in the market.

BUY SPX - S&P500- Amazing low risk high reward trade!Based on our deep analysis we can see that SPX - S&P500 will head to the upside. Great time to buy - it has broken major resistance levels + trends.

S&P Stalls, Gold & Silver Reality Check, US vs China WatchGold and Silver finally correcting - and I'm dollar cost averaging into dips
US Indexes (S&P, Nasdaq, Dow, Russell) stalling just off of all-time highs
Sideways is a behavior and it might seem boring, but it's certainly better than
the market rolling over and falling hard for 5-10% corrections (TBD)
AI Narrative remains optimistic
-I like the utilities, energy, and physical goods side of AI over software and hype
Financials and CAPEX spending remains firm
-money continues to flow into this AI buildout
Trump vs China is likely noise and eventual concessions and agreements
are likely the outcome - but the market is waiting for proof for now
US CPI data hitting Friday (first real US news in weeks) - does the market react?
Watch for broadening pattern and fakeouts, but the big tell with this market
pushing for more upside is the massive drop in VIX last week and once again
flirting with all-time highs
Thanks for watching!!!
-Chris

Causes of Global CrashesEconomic, Political, and Psychological Factors.
Global financial crashes have been recurring phenomena throughout modern economic history. From the Great Depression of 1929, the Dot-Com Bubble of 2000, the Global Financial Crisis of 2008, to the COVID-19 market crash of 2020, each episode has revealed vulnerabilities in the global financial system. Despite different triggers, all share underlying causes linked to economic imbalances, political decisions, and collective psychological behavior. Understanding these factors is crucial for policymakers, investors, and economists to anticipate and mitigate future crises.
1. Economic Factors: The Foundation of Market Instability
Economic factors form the backbone of most global crashes. They often arise from systemic imbalances, over-leverage, speculative bubbles, and policy missteps that distort market efficiency.
a) Asset Bubbles and Overvaluation
One of the most common precursors to a crash is the formation of asset bubbles—situations where asset prices rise far beyond their intrinsic value due to excessive speculation. Investors, driven by the belief that prices will continue to climb, pour money into overvalued assets. When reality strikes and prices begin to fall, panic selling ensues, leading to a sharp market correction.
Examples include:
The Dot-Com Bubble (2000): Exuberance over internet startups drove technology stocks to irrational valuations, with companies having minimal profits being valued in billions.
U.S. Housing Bubble (2008): Excessive lending and subprime mortgages inflated real estate prices until defaults triggered a collapse, spreading through global financial markets via securitized mortgage products.
These bubbles illustrate how the combination of easy credit, speculative mania, and weak regulation can inflate asset values to unsustainable levels.
b) Excessive Debt and Leverage
High levels of debt—whether by households, corporations, or governments—create systemic vulnerability. When asset prices fall, overleveraged entities struggle to meet obligations, leading to a chain reaction of defaults and bankruptcies. Leverage amplifies both gains and losses; thus, when confidence erodes, deleveraging occurs rapidly, deepening the crisis.
The 2008 Financial Crisis serves as a textbook example, where banks and financial institutions had high exposure to mortgage-backed securities financed through short-term debt. Once the housing market declined, the inability to refinance debt led to liquidity freezes and institutional failures such as Lehman Brothers.
c) Monetary Policy and Interest Rate Mismanagement
Central banks play a crucial role in maintaining economic stability. However, prolonged periods of low interest rates and quantitative easing can encourage speculative behavior and excessive borrowing. Conversely, sudden tightening of monetary policy can burst bubbles and reduce liquidity.
For instance:
The U.S. Federal Reserve’s tightening before the 1929 crash is believed to have reduced liquidity, accelerating the market collapse.
Similarly, the rate hikes of 2022–2023 to combat inflation led to a correction in tech stocks and cryptocurrencies that had benefited from years of cheap money.
d) Global Trade Imbalances
Trade imbalances between major economies—such as the U.S. and China—can lead to distortions in capital flows and currency valuations. Persistent current account deficits or surpluses create dependency and volatility. When these imbalances adjust abruptly, global financial markets experience turbulence, as seen during the Asian Financial Crisis of 1997, when capital flight led to currency collapses and regional recessions.
e) Banking System Fragility
Weak regulation, risky lending practices, and insufficient capital buffers make banking systems vulnerable. The interconnectedness of global finance means that the failure of one major institution can cascade across borders, as seen in 2008 when the collapse of Lehman Brothers triggered a global credit crunch.
2. Political Factors: The Role of Governance and Geopolitics
While economic indicators often signal a crash, political factors can act as both catalysts and amplifiers. Governments influence markets through fiscal policies, regulation, and geopolitical actions.
a) Policy Uncertainty and Mismanagement
Political instability and inconsistent economic policies create uncertainty that undermines investor confidence. Sudden tax reforms, nationalization, or trade restrictions can shock markets. For instance:
The Brexit referendum (2016) caused massive volatility in global markets due to uncertainty about trade and investment flows.
The U.S.-China trade war (2018–2019) disrupted global supply chains, leading to stock market fluctuations and slower growth.
In emerging markets, policy mismanagement, corruption, and lack of transparency can drive capital flight, devalue currencies, and cause inflationary spirals—factors often preceding financial crises.
b) Geopolitical Conflicts and Wars
Wars and geopolitical tensions disrupt trade routes, increase commodity prices, and trigger risk aversion in investors. The Russia-Ukraine war (2022), for instance, caused spikes in energy and food prices, contributing to global inflation and slowing growth. Similarly, the Oil Crisis of 1973—triggered by OPEC’s embargo—plunged Western economies into stagflation, demonstrating how political decisions in one region can create worldwide economic turmoil.
c) Regulatory Failures and Deregulation
Governments and financial regulators are tasked with maintaining market integrity. However, deregulation or lax oversight can allow risky practices to proliferate.
The U.S. financial deregulation in the 1980s and 1990s encouraged complex derivatives and speculative trading, setting the stage for the 2008 crash.
In developing economies, weak regulatory frameworks have allowed unmonitored capital inflows that later reversed abruptly, causing crises.
d) Globalization and Policy Interdependence
Globalization has tightly interlinked economies, but it also means that crises can spread faster. The collapse of one major economy now has ripple effects through trade, finance, and investment channels. When political decisions—like sanctions, tariffs, or capital controls—are implemented by major powers, they can unintentionally trigger market dislocations worldwide.
e) Fiscal Deficits and Unsustainable Public Debt
Governments running persistent fiscal deficits often resort to excessive borrowing. When investors lose confidence in a government’s ability to service its debt, bond yields rise sharply, leading to a debt crisis.
Examples include:
The Eurozone Sovereign Debt Crisis (2010–2012), where Greece, Spain, and Italy faced massive sell-offs in government bonds due to high debt-to-GDP ratios.
Argentina’s repeated debt defaults illustrate how fiscal indiscipline can repeatedly destabilize markets and economies.
3. Psychological Factors: The Human Element in Market Crashes
While economic and political factors lay the groundwork for crashes, psychology drives the timing and intensity of market collapses. Investor sentiment, herd behavior, and cognitive biases play central roles in shaping market dynamics.
a) Herd Behavior and Speculative Mania
Markets are not purely rational systems—they are deeply influenced by crowd psychology. When prices rise, investors fear missing out, leading to herd behavior where everyone buys simply because others are buying. This collective optimism inflates bubbles beyond fundamental values.
Historical examples include:
Tulip Mania (1637) in the Netherlands, where tulip bulbs sold for the price of houses before crashing overnight.
Bitcoin and crypto booms (2017 and 2021), where social media hype and retail participation drove valuations to extreme levels before sharp corrections.
b) Overconfidence and Illusion of Control
Investors often overestimate their ability to predict markets. During bull markets, this overconfidence bias leads to risk-taking and neglect of fundamentals. Financial analysts, fund managers, and even policymakers may believe “this time is different,” ignoring signs of overheating.
Before the 2008 crash, many economists and bankers genuinely believed that new financial innovations had made the system more resilient—an illusion that collapsed once subprime defaults surged.
c) Panic and Loss Aversion
Once asset prices start falling, fear takes over. Loss aversion, the psychological principle that people feel losses more intensely than gains, causes panic selling. The speed of modern digital trading and algorithmic systems amplifies this panic, leading to rapid market declines.
During the COVID-19 crash of March 2020, stock markets fell over 30% within weeks as investors rushed to liquidate positions amid uncertainty, demonstrating how fear can drive faster collapses than fundamentals alone would justify.
d) Media Influence and Narrative Contagion
Media and social networks can accelerate both optimism and fear. Positive stories during bubbles and alarmist headlines during downturns amplify collective emotions. Economist Robert Shiller’s concept of “narrative economics” highlights how viral stories—such as “housing prices never fall” or “AI will revolutionize everything”—fuel speculative behavior detached from reality.
e) Behavioral Finance and Feedback Loops
Modern behavioral finance explains how psychological feedback loops amplify volatility. Rising prices attract attention, which draws more investors, pushing prices even higher—a self-reinforcing cycle. When this reverses, selling pressure creates a downward spiral, often far exceeding what fundamentals justify.
4. Interconnection Between Economic, Political, and Psychological Forces
Global crashes rarely result from a single cause—they emerge from a complex interaction of economic misalignments, political actions, and psychological dynamics.
For instance:
The 2008 crisis combined excessive leverage (economic), weak regulation (political), and investor complacency (psychological).
The COVID-19 crash reflected a sudden geopolitical shock (pandemic response), economic slowdown, and psychological panic selling.
The Asian Financial Crisis (1997) arose from overborrowing (economic), weak policy responses (political), and investor herd behavior (psychological).
This interconnectedness makes prediction and prevention challenging, as policymakers must manage not only economic fundamentals but also public sentiment and political realities.
5. Lessons and Preventive Measures
To prevent or mitigate global crashes, lessons from past crises must be applied systematically:
Stronger Financial Regulation:
Transparent accounting, capital adequacy norms, and limits on leverage can reduce systemic risks.
Balanced Monetary Policy:
Central banks should avoid prolonged ultra-low interest rates that encourage asset bubbles, while managing liquidity during downturns.
International Coordination:
Global financial stability requires coordination among central banks, governments, and institutions like the IMF to manage cross-border capital flows and crises.
Investor Education and Behavioral Awareness:
Educating investors about cognitive biases, speculative risks, and market psychology can foster more rational decision-making.
Crisis Communication and Transparency:
Governments and regulators should maintain clear, transparent communication to prevent misinformation and panic during economic shocks.
Conclusion
Global crashes are inevitable episodes in the cyclical nature of financial markets, driven by a combination of economic imbalances, political misjudgments, and psychological dynamics. While the specific triggers may vary—be it a housing bubble, a war, or a pandemic—the underlying patterns remain strikingly similar. Understanding these causes not only helps explain past collapses but also equips policymakers and investors to build more resilient financial systems. Ultimately, preventing future crashes requires recognizing that markets are not just machines of numbers—they are reflections of human behavior, confidence, and collective decision-making in an ever-interconnected world.

Market Pulse: Cracks in the Bull?We kick off the week with the S&P still riding its two-month uptrend, supported by the 55-day MA at 6541. But signs of fatigue are emerging.
📉 Amazon is slipping below its 200-day MA 📊 NVIDIA’s recent high at 195.62 hovers near the 197 Fibonacci extension and the 200 psychological level
Technically, the uptrend holds—and if 6765 the recent high breaks, the bull may charge on. If the 55-day MA erodes, brace for a correction.
🔍 Keep chart levels in focus 📌 Tighten stops ⚠️ Not investment advice
#TechnicalAnalysis #SP500 #Amazon #NVIDIA #MarketUpdate #TradingStrategy #RiskManagement #Fibonacci #BullMarket #ChartWatch #FinanceTwitter #LinkedInFinance

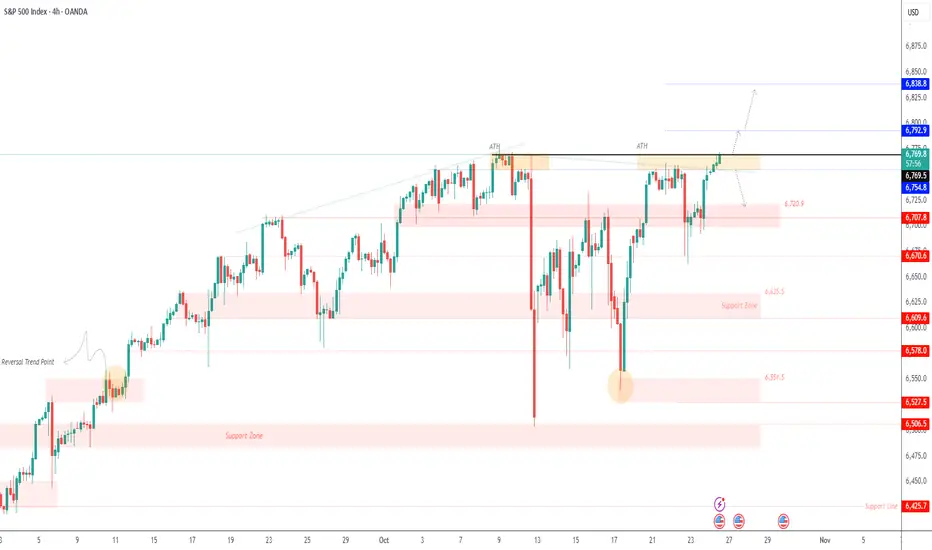
W Pattern In SPX/USD Good day or night fellow traders and followers!
I see a W pattern on the 4hr chart in SPX/USD. Who wants to make around 176 points? I know I do so if price can break out over the break-line @ 6,691.6 then it's going to 6868.9 area like it or not, as it looks like Institutional buying coming in.
Follow the rules wait for 4hr chart to show price clearing the break-line on a 4hr candle close before going long. Don't bother with chop if it occurs. Waiting is the stress free way to insure direction.
Best of luck in all your trades $$$

BUY SPX - S&P500- Profitable trade opportunity!Based on our deep analysis we can see that SPX (S&P500) will head to the upside. Great time to BUY - it is currently in a uptrend and is holding on to powerful support levels. The next target is the resistance level to the upside. This is a great low risk high reward trade. BUY NOW!

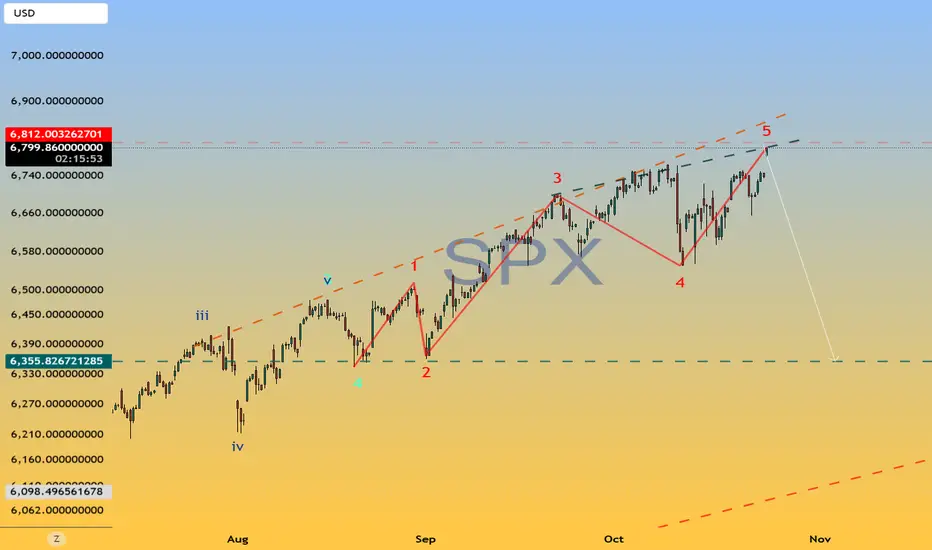
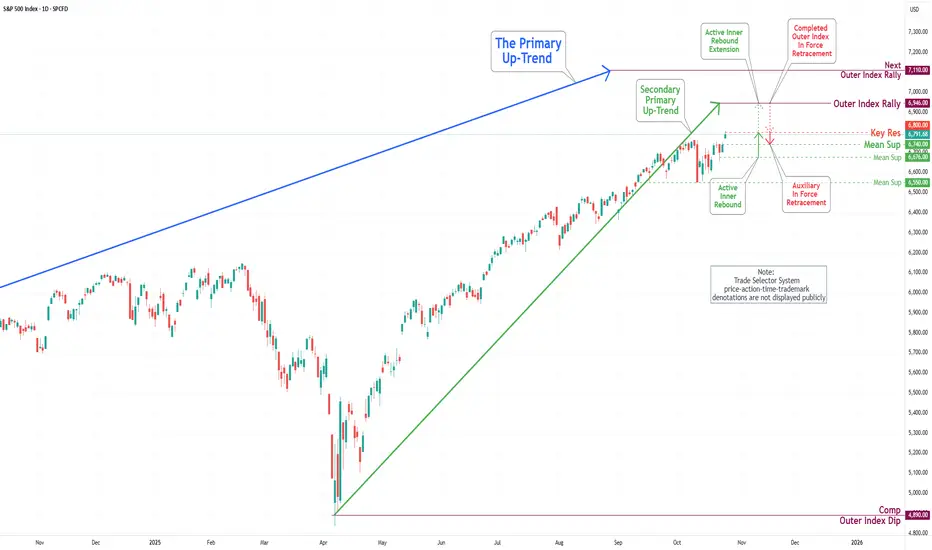
S&P 500 Daily Chart Analysis For Week of Oct 24, 2025Technical Analysis and Outlook:
The most recent trading session exhibited significant volatility in the S&P 500 Index, marked by pronounced price fluctuations between the Mean Resistance at 6671 and the Key Resistance at 6753. This range served as a crucial threshold for market participants, prompting a series of rapid buying and selling that influenced the index's overall wild movement. Ultimately, this price action culminated in a breakout above the completed Outer Index Rally at 6768.
At present, the index is situated at the newly established Key Resistance level of 6800, which lies just below the historical high of 6807. This positioning indicates the potential for further upward momentum, as the prevailing trend suggests a well-structured Active Inner Rebound extension toward the Next Outer Index Rally target of 7110.
Conversely, it is imperative to acknowledge the possibility of a sustained, steady-to-lower pullback from the Key Resistance level of 6800 to Mean Support 6740 for the Secondary Primary Up-Trend to continue on its path.
S&P 500 back at 6750 resistance *TRUMP: MAYBE MEETING WON'T HAPPEN WITH XI
That was enough to cause the S&P to give up its earlier modest gains, as the index traded near an all-time high and resistance around 6750 where it had struggled in recent weeks. At the time of writing, it was bouncing back again, but let's see what it wants to do around 6750 now.
A couple of Fridays ago it tumbled from around this area when Trump re-ignited trade war concerns, before the usual TACO trade caused the index to bottom and make back all of its losses. Now we are back to square one.
Let's see if Trump will use the higher stock prices as a vote of confidence to up the pressure on China ahead of the trade truce deadline.
In any case, the bears will need to see a clear reversal pattern, before entertaining the idea of shorting what has been a very strong bull market. But like we saw in the case of gold and silver, market don't always go up in a straight line. Profit-taking ahead of earnings and trade deadline could shake things up a little.
By Fawad Razaqzada, market analyst with FOREX.com

SPX for Thursday October 23rdSimilar pattern to Dax.There is now an uptrend.Running into resistance.Lets see what happens
