Dow Jones is back in playThe rotation from tech stocks back to the industrial sector is the main trend in late September: Dow Jones gets back in play. The price consolidates in the ascending wedge, and ready to break it to the upside as shown on the chart, with a potential target area above $48000.
The alternative scenario would be a false breakout with a continuation of a consolidation and another attempt to break it closer to PCE index publication on September 25th, 2025.
Don't forget - this is just the idea, always do your own research and never forget to manage yoru risk.
WALLSTREETCFD trade ideas

US30 - Potential TargetsDear Friends in Trading,
Bull trend and HL series of demands remain intact despite FOMC week.
Let me know if anything is unclear.
I sincerely hope my point of view offers a valued insight.
Thank you for taking the time study my analysis.

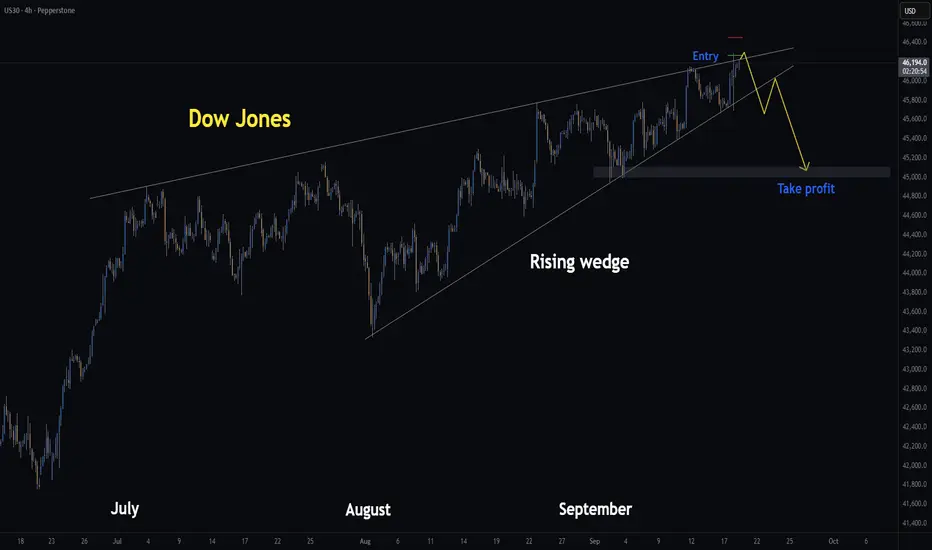
Dow Jones | H4 Rising Wedge | GTRadingMethod👋 Hello Traders.
Yesterday I mentioned I’d be watching for a breakout and retest setup — that plan still stands. However, I’ve also taken a short position off the diagonal resistance line.
🧐 Market Overview:
I’m currently seeing rising wedge structures across Nasdaq, S&P, Russell 2000, and Dow Jones. These patterns typically lean bearish, and I can’t ignore the confluence. That said, wedges can fail, and with the market leaning bullish after of the FOMC announcement, I’m aware this is swimming against the trend.
📊 Trade Plan:
Risk/Reward: 6.7
Entry: 46 267
Stop Loss: 46 450
Take Profit 1 (50%): 45 000
Take Profit 2 (50%): 45 000
(I’m already short from 46 267 and will look to add if price retests that level.)
💡 GTradingMethod Tip:
Bearish patterns like rising wedges can offer high R/R setups, but always remember — strong bullish backdrops (like major data events) can cause them to fail. Risk management is everything.
🙏 Thanks for checking out my post!
Make sure to follow me to catch the next idea and share your thoughts on what you think the markets will do today and how you would trade rising wedges :)
📌 Please note:
This is not financial advice. This content is to track my trading journey and for educational purposes only.
Dow at record highs, outperfoms peers! But are risks brewing?The Dow Jones DJIA surged to new record highs, driven by defensive sector strength and expectations of Fed rate cuts. Dow outperformed due to its heavier weighting in defensive sectors (industrials, financials, consumer staples), which are favoured during economic uncertainty and falling yields. Technical analysis suggests further upside potential, as investors seek stability and dividends in Dow components amid lingering recession risks. However, key support levels must hold to sustain the rally.
The Dow has completed a V-shaped recovery, breaking above previous double-top highs from 2024/2025 (45,150), now acting as support. An open triangle pattern was identified, with the current move likely the fifth wave to the upside. The index trades above all major moving averages, confirming bullish momentum, but RSI shows hidden bullish divergence, supporting the case for continued upside only if support holds after a pullback.
Dow has critical support at 45k, must hold to maintain bullish momentum. A drop below 45,581 could trigger a correction. Short-term upside shows 47k, with a major Fibonacci cluster and technical inflexion in focus. Intermediate levels sit at 46300/45900/45640, with important long-term Targets at 45k, 49500, 50k, 53k.
Risks & Potential Scenarios
Divergence: Despite strong momentum, technical divergence suggests a possible corrective move if the Dow falls below 45581.
Bullish : Holding above 45581 and 45k supports further upside toward 47k and beyond.
Bearish : A break below 45581 could trigger a deeper pullback before any renewed rally.
Market Sentiment :
The bond market’s caution contrasts with stock market optimism, so stay vigilant.
This content is not directed to residents of the EU or UK. Any opinions, news, research, analyses, prices or other information contained on this website is provided as general market commentary and does not constitute investment advice. ThinkMarkets will not accept liability for any loss or damage including, without limitation, to any loss of profit which may arise directly or indirectly from use of or reliance on such information.

BEARISH ESCENARIO15m chart accumulation forming right now, expecting a sweep of liquidity to the upside tomorrow.

US30Success in forex and stocks comes from a combination of knowledge, discipline, and patience. Understanding market trends, economic factors, and company
fundamentals is crucial, but equally important is controlling emotions and sticking to a well-planned strategy. Continuous learning, adapting to changing conditions, and managing risk wisely can turn opportunities into consistent growth over time.
Consistency, not luck, separates successful traders from the rest.
US30 LONG SETUP Price has successfully broken into a new level 46.. First test of new support was clean and now we looking for a second test as it continues with an up trend

US30_push_46 625US30_push_46 625
this was something we noticed
lets see of the push to the 50% Q4 level, .. also just above a key level of 46 500, what some might call a mid-points
what we have seen is that the TRUMP markets favours the light blue lines / 50% q4'rs
lets see; how this plays.


Us30 Trade Set Up Sep 18 2025www.tradingview.com
Price has swept PDH and pushed down hard inverting 1h FVGs and creating a bearish 1h FVH so if price continues to make internal bearish structure i will look for sells down to PDH

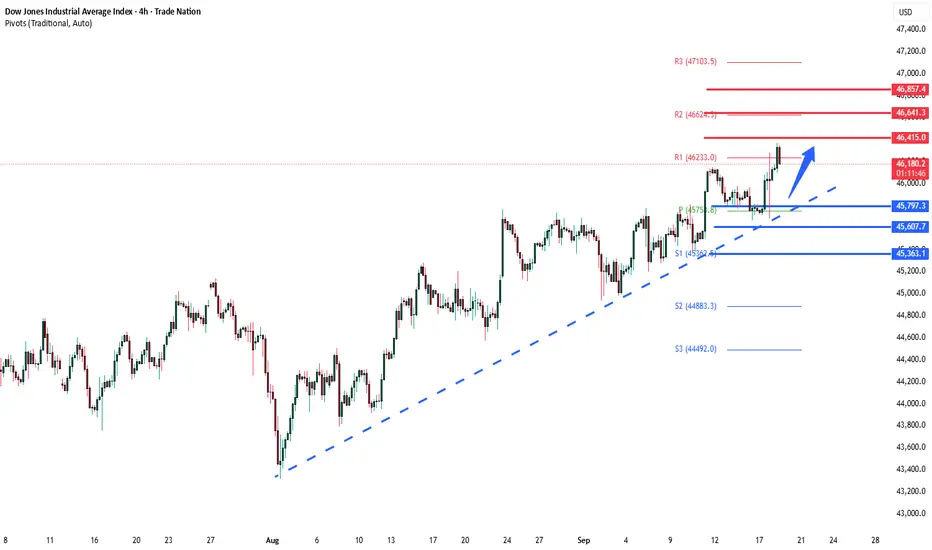
DowJones Key Trading LevelsKey Support and Resistance Levels
Resistance Level 1: 46415
Resistance Level 2: 46640
Resistance Level 3: 46860
Support Level 1: 45800
Support Level 2: 45600
Support Level 3: 45360
This communication is for informational purposes only and should not be viewed as any form of recommendation as to a particular course of action or as investment advice. It is not intended as an offer or solicitation for the purchase or sale of any financial instrument or as an official confirmation of any transaction. Opinions, estimates and assumptions expressed herein are made as of the date of this communication and are subject to change without notice. This communication has been prepared based upon information, including market prices, data and other information, believed to be reliable; however, Trade Nation does not warrant its completeness or accuracy. All market prices and market data contained in or attached to this communication are indicative and subject to change without notice.
US30 ShortElite Analysis
All confirmations met
Executed late
Elite execution TOB marked by orange rectangle

US30 Price Consolidation a Top Resistance The Dow Jones (US30) is currently consolidating around the 45,900 support level as traders position ahead of the upcoming Federal Reserve rate decision later this week. but the real driver of volatility will be Chair Powell’s forward guidance—particularly his tone on
Technical View
A break and close above 46,500 could open the path toward 47,000–47,200, while failure to hold 45,900 risks a pullback toward 45,500.
You may find more details in the chart.
Trade wisely best of Luck.
Ps; Support with like and comments for better analysis Thanks for Supporting.

DOW/US30 - TIME FOR A KILLTeam, we have not been trading DOW/US30 since last week's successful short
WHY, we wait for the rate decision to come out
NOW, investors' hope is invalid, no momentum for a rate cut
LETs short the beast at 46135-46160
STOP LOSS AT 46250- OR 46280
EASY TARGET AT 46117-46070 - take partial 50-70% and bring stop loss to BE
2ND TARGET at 45972-45955
LETS GO

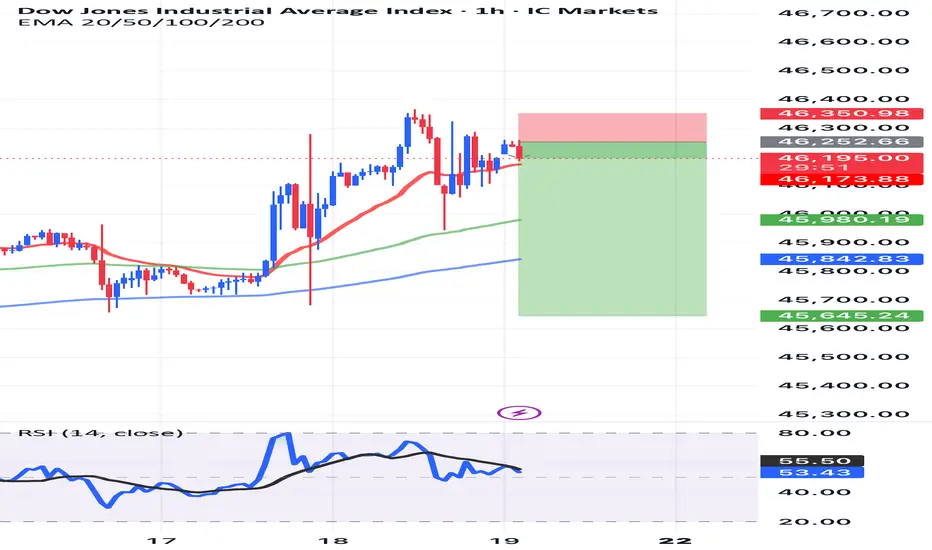
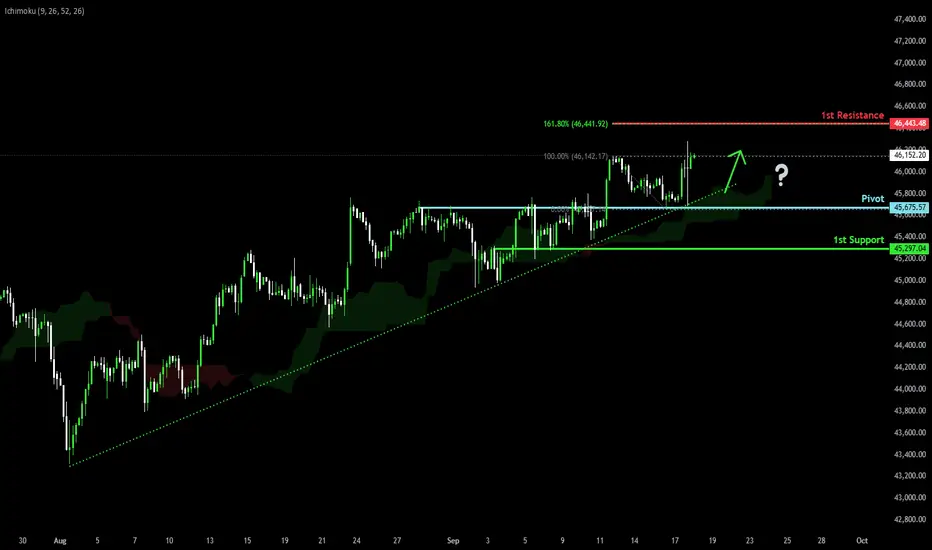
Bullish momentum to extend?Dow Jones (US30) has bounced off the pivot, which has been identified as a pullback support and could potentially rise to the 1st resistance which aligns with hte 161.8% Fibonacci extension.
Pivot: 45,675.57
1st Support: 45,297.04
1st Resistance: 46,443.48
Disclaimer:
The above opinions given constitute general market commentary, and do not constitute the opinion or advice of IC Markets or any form of personal or investment advice.
Any opinions, news, research, analyses, prices, other information, or links to third-party sites contained on this website are provided on an "as-is" basis, are intended only to be informative, is not an advice nor a recommendation, nor research, or a record of our trading prices, or an offer of, or solicitation for a transaction in any financial instrument and thus should not be treated as such. The information provided does not involve any specific investment objectives, financial situation and needs of any specific person who may receive it. Please be aware, that past performance is not a reliable indicator of future performance and/or results. Past Performance or Forward-looking scenarios based upon the reasonable beliefs of the third-party provider are not a guarantee of future performance. Actual results may differ materially from those anticipated in forward-looking or past performance statements. IC Markets makes no representation or warranty and assumes no liability as to the accuracy or completeness of the information provided, nor any loss arising from any investment based on a recommendation, forecast or any information supplied by any third-party.
Dow projections after yesterday's rate cutEverything is mentioned in chart.
This is my Elliott Wave breakdown of the Wave 5 cycle rally from my last year's projections.

Most probable scenario (Rates remain unchanged)Ever since my last year's downward correction projection on Dow, the market has been steadily going upward forming our wave 5.
For past couple weeks, I have been monitoring the Expanding Triangle forming in market ever since the major RSI drop in July downward swing, which was our wave C.
22 August was the day most people like me were expecting the drop in market which would have been our Wave E, but since the GDP news pumped the market turning an ABC zigzag into an Impulse with the 5th wave being the pump upon news release, the wave D was hence prolonged and we had to wait for another 5 wave structure to complete the wave D zig-zag as shown in the image below.
Now, we can see that even though wave D has traced more than 200% of wave B, it is still a valid Triangle. The ending diagonal further strengthens this scenario to play out.
Even though this scenario's success is dependent upon the news, which is impossible to predict. The price action so far we have seen along with the GDP and other news reports suggest that even though market is highly anticipating 25 basis points cut or even 50 basis points, the likelihood of Interest rates remaining unchanged is still very high because the US economy is still strong and does not necessarily require rate cuts yet.
After this wave E, we can enter our usual end of year pump.

US30 US30 is bullish.
Trading above last week’s open.
Momentum is pushing higher highs.
US30 is showing a bullish bias, trading comfortably above last week’s open. The market is forming higher highs and higher lows, indicating strong upward momentum. Pullbacks to key levels, like the current week open, may offer good entry opportunities in line with the trend.

Dow Jones: Market Ready for a New Upward ImpulseMarket Overview:
The Dow Jones Index is holding above the key support zone of 45,100–45,200, forming a bullish structure. After a consolidation phase, the index is showing signs of an upside breakout.
Technical Signals:
Fibonacci levels point to potential growth toward 46,100, 46,350, and 46,700.
EMA 144 supports the bullish scenario, staying below the current price.
AO indicator is turning positive, confirming strengthening bullish momentum.
Key Levels:
Support: 45,100 – 45,200
Resistance: 46,100 – 46,700
Scenario:
The main scenario remains bullish — if the index consolidates above 45,600, we expect growth toward 46,100–46,700. The alternative scenario is a breakdown below 45,100, which could lead to a move toward 44,800.

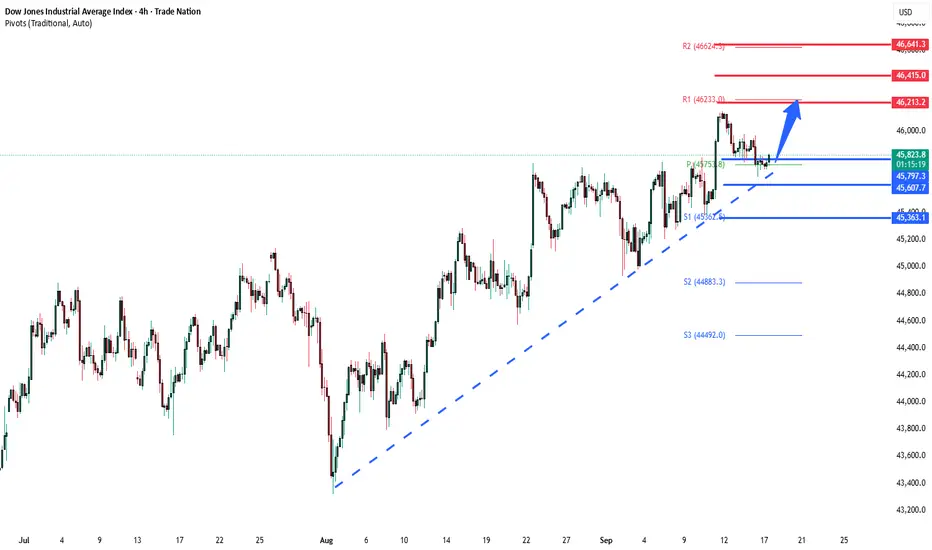
DowJones Key trading levels ahead of Fed rate decisionKey Support and Resistance Levels
Resistance Level 1: 46210
Resistance Level 2: 46415
Resistance Level 3: 46640
Support Level 1: 45800
Support Level 2: 45610
Support Level 3: 45360
This communication is for informational purposes only and should not be viewed as any form of recommendation as to a particular course of action or as investment advice. It is not intended as an offer or solicitation for the purchase or sale of any financial instrument or as an official confirmation of any transaction. Opinions, estimates and assumptions expressed herein are made as of the date of this communication and are subject to change without notice. This communication has been prepared based upon information, including market prices, data and other information, believed to be reliable; however, Trade Nation does not warrant its completeness or accuracy. All market prices and market data contained in or attached to this communication are indicative and subject to change without notice.
US30 LONG/BUY Hello there
Looks like a high probability trade is forming on US30
1. Regular flat formation
2. MACD divergence 1HR TF forming
3. 3 WAVE corrective structure
4. 61.8 FIB retracement of impulsive move
Strategy: Entry at 61.8 FIB retracement entry
Entry: Current Market Price/ 45641 (little gap left)
Stop Loss: 45391
Take Profit: 46300
Trade with care
God Bless you

US30 – Rejected at 46,145, Holding Above 45,700 SupportThe Dow Jones Index faced rejection near the 46,145 resistance and is now pulling back toward the 45,700 support zone. Price action here will determine whether buyers can sustain momentum or if sellers push lower.
Support at: 45,700 / 45,000 / 44,000 🔽
Resistance at: 46,145 🔼
🔎 Bias:
🔼 Bullish: Holding above 45,700 could lead to another retest of 46,145, with a breakout opening room for higher highs.
🔽 Bearish: A break below 45,700 would shift focus toward 45,000, and further weakness could target 44,000.
📛 Disclaimer: This is not financial advice. Trade at your own risk.
