US30 - potential head and shoulders on 30min chartWatching the US30Cash for a potential short setup.
A head and shoulders pattern may be forming on the 30-minute timeframe. I’m still waiting for confirmation on some key variables before entering the trade.
Trade Details:
📊 Risk/Reward: 2.7
🎯 Entry: 45 224
🛑 Stop Loss: 45 261
💰 Take Profit 1 (50%): 45 141
💰 Take Profit 2 (50%): 45 084
Thanks for checking out my post! Make sure to follow me to catch the next update. If you found this helpful, give it a like 👍 and share your thoughts 💬 — I’d love to hear what you think!
Please note: This is not financial advice. This content is to track my trading journey and for educational purposes only.
Trade ideas

DowJones uptrend supported at 44380Key Support and Resistance Levels
Resistance Level 1: 45400
Resistance Level 2: 45660
Resistance Level 3: 46000
Support Level 1: 44380
Support Level 2: 44080
Support Level 3: 43675
This communication is for informational purposes only and should not be viewed as any form of recommendation as to a particular course of action or as investment advice. It is not intended as an offer or solicitation for the purchase or sale of any financial instrument or as an official confirmation of any transaction. Opinions, estimates and assumptions expressed herein are made as of the date of this communication and are subject to change without notice. This communication has been prepared based upon information, including market prices, data and other information, believed to be reliable; however, Trade Nation does not warrant its completeness or accuracy. All market prices and market data contained in or attached to this communication are indicative and subject to change without notice.

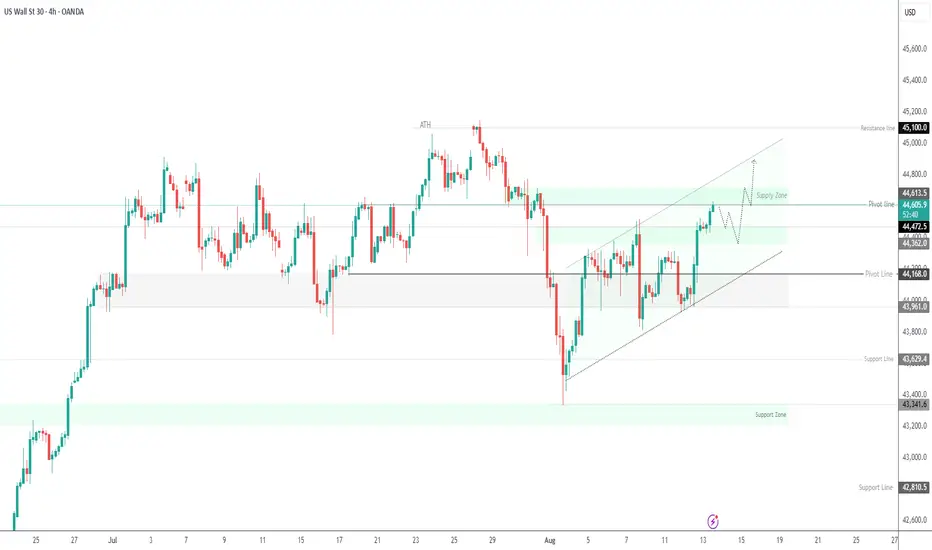
Possibility of uptrend The recent uptrend is expected to continue to the identified resistance levels. With the resistance trendline broken, a continuation of the uptrend will be more likely.
US30 Long Position US30 has broken passed the major resistance level at $45000 finally and is currently priced at $45200. The Bullish trend from the past week has created strong bullish confluences with price trading above the 21 and 50 day Moving Averages and in the bullish region of the RSI, expecting further upside potential.
With the break of the $45000 barrier, we can expect price to retrace and test this point sometime in the future and with that see a bounce from this level with the resistance turning support.
Will also be looking at other keys levels such as $44980 and $44730 should price have a deep retracement before the bullish trend resumes.

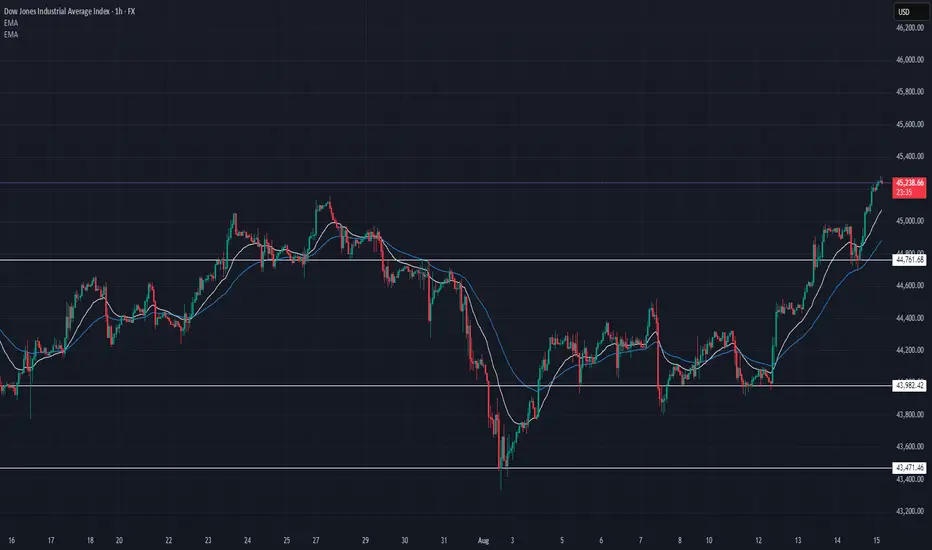
Will The Prospect of Fed Rate Cuts Continue to Support US30?Fundamental approach:
- US30 has been pushing toward a fresh high this week, aided by softer CPI and growing confidence in a Sep Fed cut. On Wed, it was within about 1% of a record and posted substantial gains earlier in the week.
- The US Jul PPI rose 0.9% MoM and 3.3% YoY, well above forecasts, reviving tariff-driven inflation worries and pressuring cyclicals. Earlier CPI relief had supported a midweek bounce and fresh risk-on tone in parts of the market. Headlines flagged mixed mega-cap moves, and Dow heavies like Apple (AAPL) and Caterpillar (CAT) fluctuated with growth and trade sensitivity as traders reassessed the rate path.
- US30 could remain supportive as markets weigh amid Fed policy expectations that could shift based on next week's flash PMIs and further data signals on pricing and activity. Traders may also react to guidance updates and sector rotations if inflation surprises persist, potentially delaying aggressive easing prospects.
Technical approach:
- US30 created a new swing high, closing above the resistance at 45000. The index is above both EMAs, indicating upward momentum.
- If US30 remains above 45000, it may approach the 100% Fibonacci Extension at around 46670.
- On the contrary, staying below 45000 may prompt a retest of the EMA21 and the ascending channels' lower bound.
Analysis by: Dat Tong, Senior Financial Markets Strategist at Exness

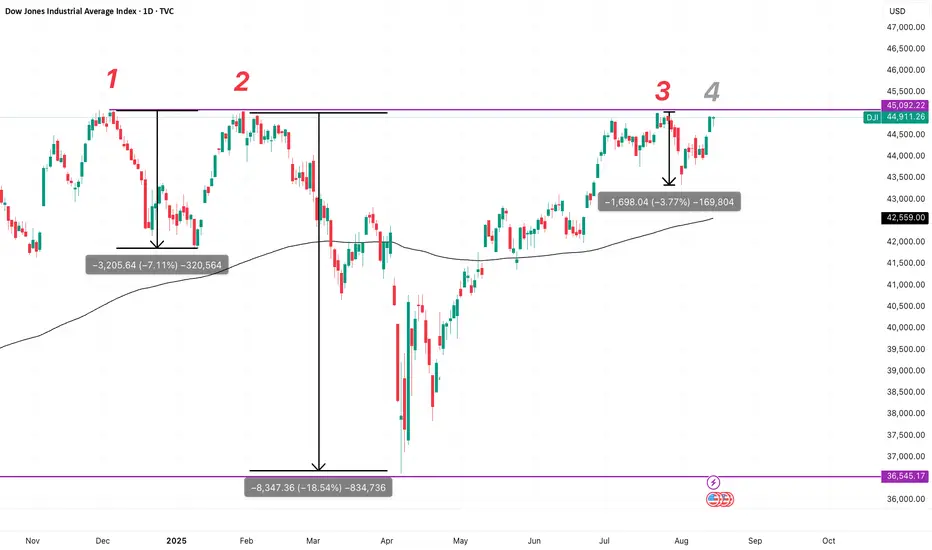
Dow: Fourth Attempt at the CeilingThree times since late 2024, the Dow has run head-first into the same resistance zone around 45,092 — each time pulling back, but each time finding higher lows and quicker recoveries.
Now we’re at attempt #4. The prior pullbacks have been smaller, and breadth is improving — only 5 out of 30 Dow components are negative since December 24, 2024.
Yes, there are plenty of unknowns — macro headwinds, earnings gaps, global geopolitical and tariff risks — but the chart says one thing loud and clear: the bulls are still in control.
A clean breakout here could open the door to new highs. Until proven otherwise, momentum belongs to the buyers.
US30 TCBFlow Plan📌 TCBFlow Plan – US30
Bias: Bullish (Trend + Breakout Phase)
Setup Quality: A (High Probability)
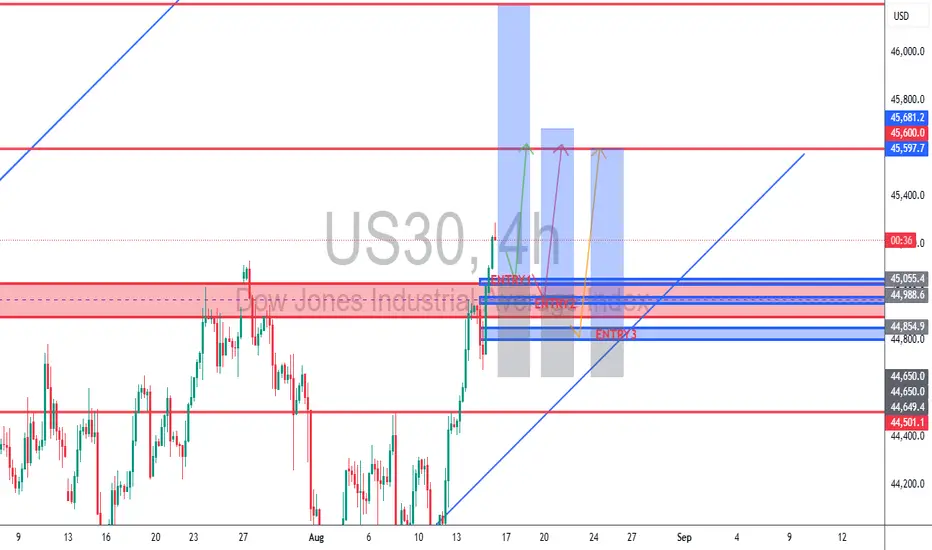
1️⃣ 4H Timeframe – Structure Confirmation
Main Zone: 44,800 (old resistance, now potential support)
Bullish Confirmation Triggers:
Bullish engulfing candle closing above the retest low
Long-tailed rejection wick that holds above 44,800
Invalidation: 4H close below 44,650
2️⃣ 1H Timeframe – Precision Entry
After 4H confirmation, drop to 1H for exact entry.
My Entries:
EP1: 45,055.4 → Aggressive entry (anticipating bounce before full retest)
EP2: 44,988.6 → Ideal zone touch entry
EP3: 44,854.9 → Deep retest entry near demand base
Stop Loss: 44,650.0
Below rejection wick / structure low (~80–120 pts risk depending on entry)
Take Profits:
TP1: 45,600 → Partial close + SL to breakeven
TP2: 46,200 → Measured move from breakout
3️⃣ Trade Management
At 1:1 RRR → Move SL to breakeven
Trail SL behind 1H swing lows as price climbs
If stopped at BE but structure holds → re-enter on next 1H bullish signal
4️⃣ Risk Notes
Avoid entering if price rallies straight to 45,600 without retest (chasing)
No trade if price breaks below 44,650 (failed breakout)
💬 Drop your comment below if you’re also looking at the exact same setup!
DOW - TRUMP MEETING WITH PUTIN - Team,
Today we got LONG GOLD, SHORT UK100, SHORT AUS200, all target meet at our chat room
Here is the set up trade for US30
Entry: 45,272–45,300
Stop: 45,340–45,360
TP1: 45,080
TP2: 44,880
LETS GO
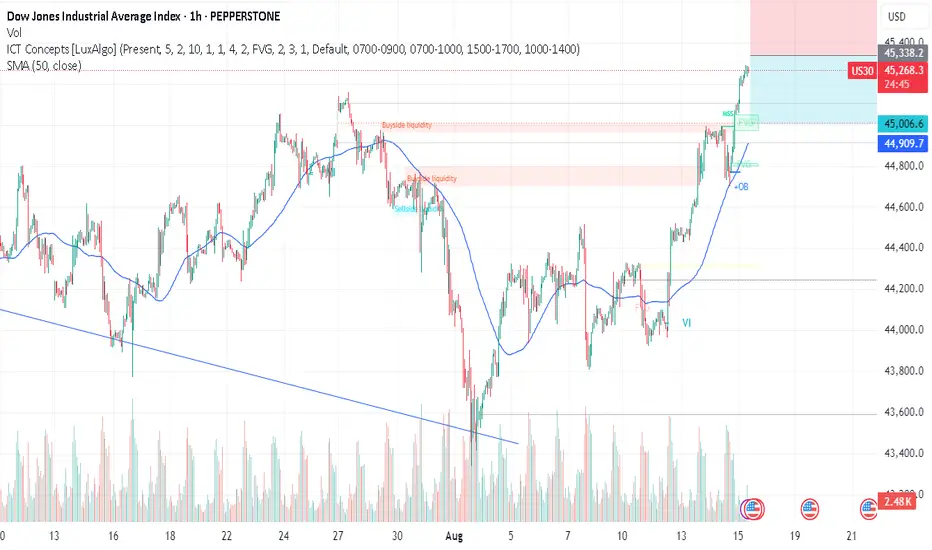
US30 Technical Breakdown – 08/15/2025📍 US30 Technical Breakdown – 08/15/2025
US30 is trading at 45,238, extending its sharp rally from the 43,471 low. Price ripped through the 44,761 resistance, turning it into fresh support, with EMAs in strong bullish alignment. Momentum remains with the bulls, but the next key obstacle sits around 45,400–45,600.
📊 Current Market Behavior:
📈 Strong impulsive rally, higher highs & higher lows
📊 EMAs steeply pointing up — bullish momentum
🧱 Immediate resistance above current price
⚠️ Overextended short-term, potential for intraday pullbacks
📌 Key Levels:
🔹 Resistance Zones:
45,400 → Immediate upside target
45,600–45,800 → Supply zone
46,200 → Major swing high
🔹 Support Zones:
44,761 → Fresh support
44,200 → Secondary support
43,982 → Key demand
🧠 Bias:
📈 Strong Bullish
Trend favors continuation while above 44,761, but after such a steep move, watch for profit-taking.
US30 Risky Long!
HI,Traders !
#US30 is trading in an uptrend
So despite a local correction
We are bullish biased and
As we are already seeing
A bullish rebound from the
Local horizontal support
Of 43885.9 a further
Bullish move up is
To be expected !
Comment and subscribe to help us grow !

US30 15M DEMAND SETUPAsia session opened in consolidation before London session breaking both session lows and highs. Price swept liquidity above the highs then reversed with solid downside volume. At 8:30 AM news injected strong volatility driving price into my 15M demand zone. With the broader trend still showing strong bullish structure. I took the trade entering on a 5M candle break and placing stops below the zones low targeting 1:2 R:R. Price consolidated briefly hit my stoploss then reversed directly to target. Solid setup and execution — market simply moved on its own terms.

US30 ShortElite Analysis
Discretionary Trade
Price bounced off a weekly structured liquidity
Targeting lower liquidity pools - 4H Structured liquidity
Executed in the 3m time frame.

DowJones bullish breakout support at 44380Key Support and Resistance Levels
Resistance Level 1: 45080
Resistance Level 2: 45400
Resistance Level 3: 45660
Support Level 1: 44380
Support Level 2: 44077
Support Level 3: 43675
This communication is for informational purposes only and should not be viewed as any form of recommendation as to a particular course of action or as investment advice. It is not intended as an offer or solicitation for the purchase or sale of any financial instrument or as an official confirmation of any transaction. Opinions, estimates and assumptions expressed herein are made as of the date of this communication and are subject to change without notice. This communication has been prepared based upon information, including market prices, data and other information, believed to be reliable; however, Trade Nation does not warrant its completeness or accuracy. All market prices and market data contained in or attached to this communication are indicative and subject to change without notice.

US30 Short This trade is massively overbought on all timeframes and at the all-time high with very good resistance
There is a crab pattern on H1 and H4
Multiple tops on M15 and M30 are showing massive divergence
stoploss above 150 pips
This is against the trend so will have to monitor when it is time to exit
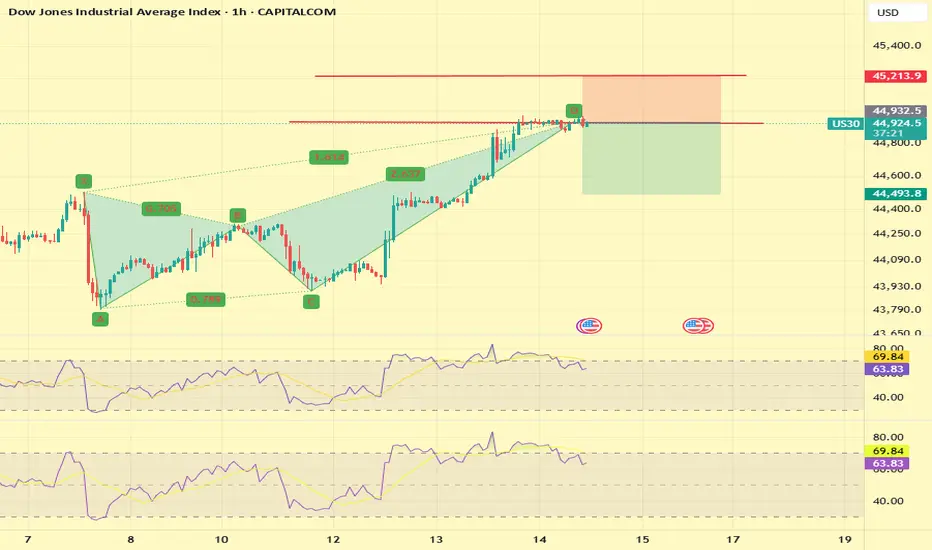
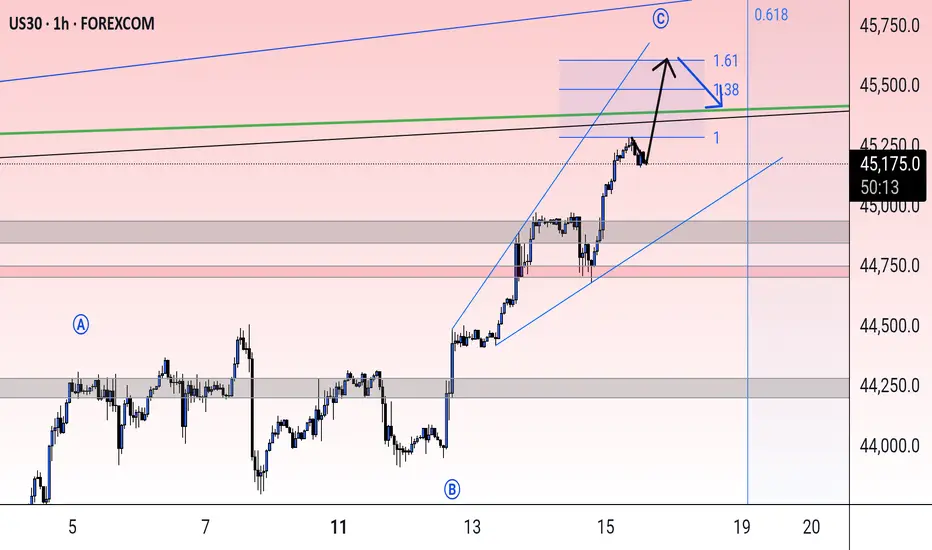
Dow Jones - Expecting Bullish Continuation In The Short TermH1 - Strong bullish momentum.
No opposite signs.
Until the two Fibonacci support zones hold I expect the price to move higher further.
If you enjoy this idea, don’t forget to LIKE 👍, FOLLOW ✅, SHARE 🙌, and COMMENT ✍! Drop your thoughts and charts below to keep the discussion going. Your support helps keep this content free and reach more people! 🚀
--------------------------------------------------------------------------------------------------------------------

US30 | Post-CPI Surge – Key Levels at 44470 & 44610US30 Overview
The Dow Jones surged over 500 points on Wednesday, supported by growing confidence that the Federal Reserve could restart its monetary policy easing cycle next month.
A softer CPI report, following weak non-farm payrolls, has strengthened the case for a September Fed rate cut.
Technical Outlook:
The price appears to be in a corrective move toward 44470 before resuming its bullish trend.
Below 44470, the bias turns bearish toward 44170.
A 1H close above 44610 would support a bullish move toward 44730 and 44950.
Support: 44470, 44360, 44170
Resistance: 44710, 44920, 45100
SELLING US30strong selling expected from marked area
H4 chart already overbought now
Daily trend also gonna overbought
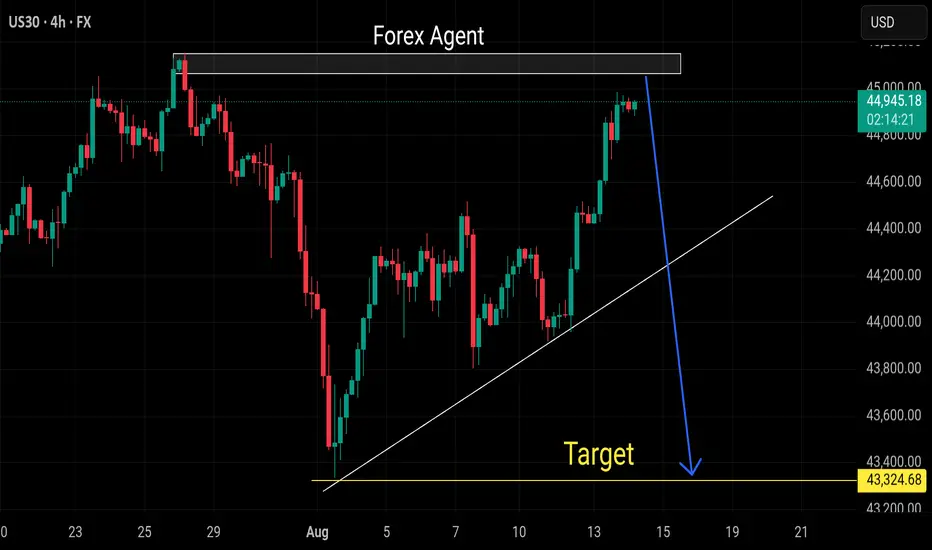
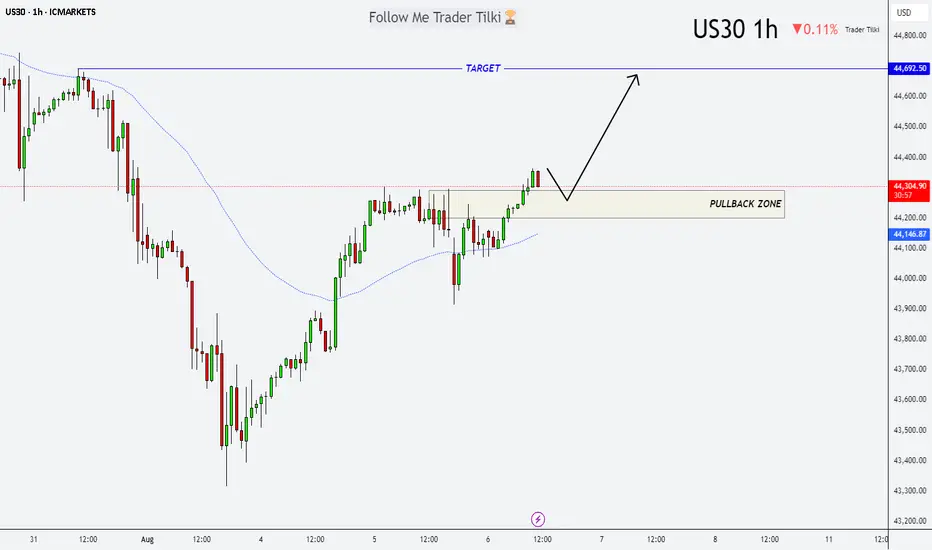
US30 at the Turn: Buy Setup from the Pullback ZoneHey friends 👋
Here’s my latest analysis on US30 (Dow Jones). I’m watching a potential pullback into the zone I marked: 44,292 – 44,190. I plan to open a buy position from that range, targeting 44,692 as my take-profit level.
Every single like you send is a huge source of motivation for me to keep sharing these insights. Big thanks to everyone supporting with a tap of appreciation 🙏
45,000 or Bust: Dow Faces Familiar Resistance Test45000 and Dow Jones bulls have not been the best of friends over the past year, with the index repeatedly rejected at the level going back to November after the Presidential election. But that hasn’t been enough to deter the bulls from having another crack, with the price back knocking on the door again following the latest rally.
RSI (14) is trending higher but not yet overbought, signalling a bias in the same direction. MACD has just confirmed the bullish signal, crossing the signal line from below in positive territory.
Combined, the price action and momentum picture suggests that if we see another attempt on the level, the move may well stick.
If we see a clean break above 45000, consider initiating longs with a stop beneath for protection. A close above 45000 would be preferred given how many times the price has failed at the level. Rather than nominate a specific target, big figures and watching for obvious reversal patterns may provide guidance on when to exit the trade.
If the bulls fail again, 45000 has proven to be a rich hunting ground for bears over the past year. Shorts can be established beneath the level with a stop above for protection. 44500, 43822 and the Aug 1 low of 43332 are possible targets depending on desired risk-reward.
Good luck!
DS

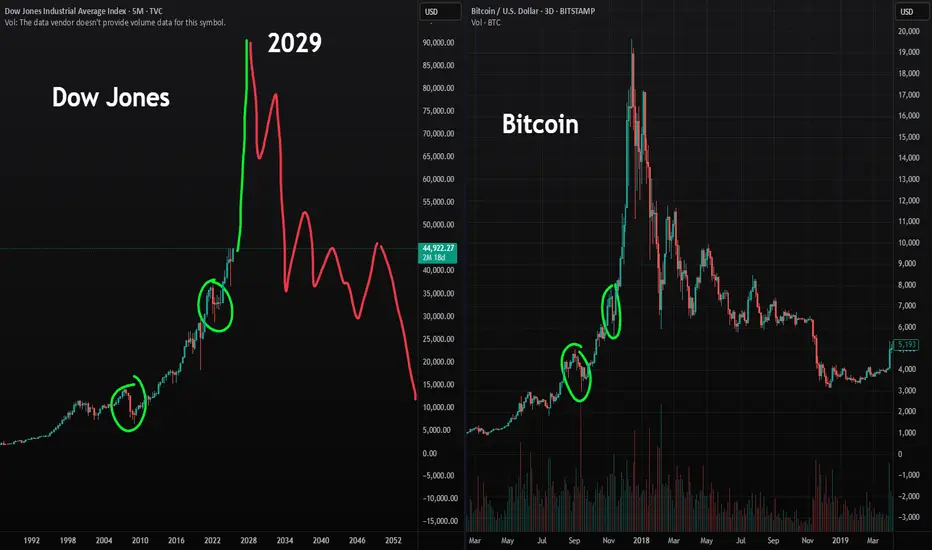
US STOCK MARKET PUMP AND DUMP.My view on the U.S. economy: The U.S. stock market is ready for a blow-off top (similar to Bitcoin in 2017, but a larger fractal of the same psychology). This will lead to a Great Depression 2.0. The smartest thing you can do is buy assets like crypto now, get rich, take profits on everything, and prepare to buy the dip in the housing market, land market, stock market, and everything else during the upcoming crash. I believe this will top out in 2029, marking a 100-year cycle from the last stock market peak in 1929. Crypto will follow it both up and down. This is the official High Altitude Investing position on what’s coming for crypto and the world markets.
As always, stay profitable.
- Dalin Anderson
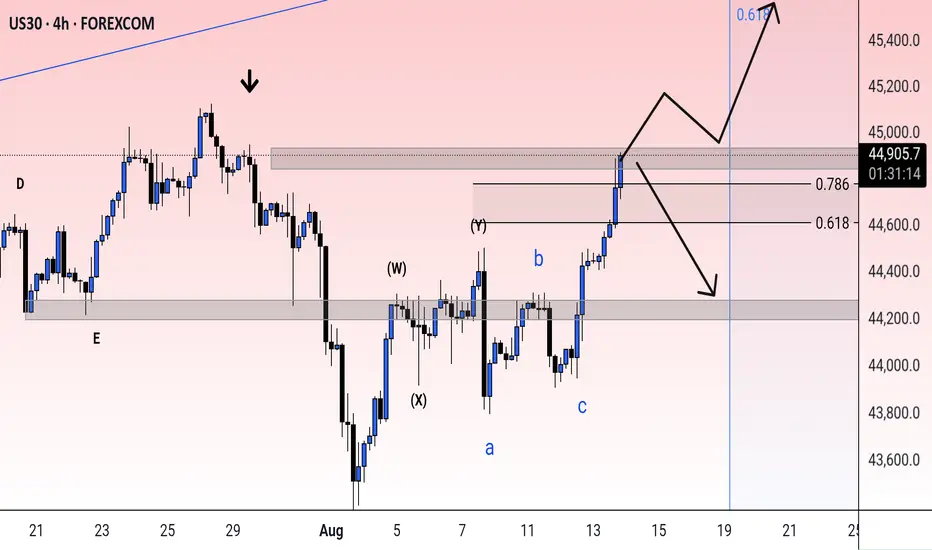
Check the trend Given the behavior of the index within the current resistance range, possible scenarios have been identified. As long as the index does not show above the resistance range, the continuation of the correction trend is likely.