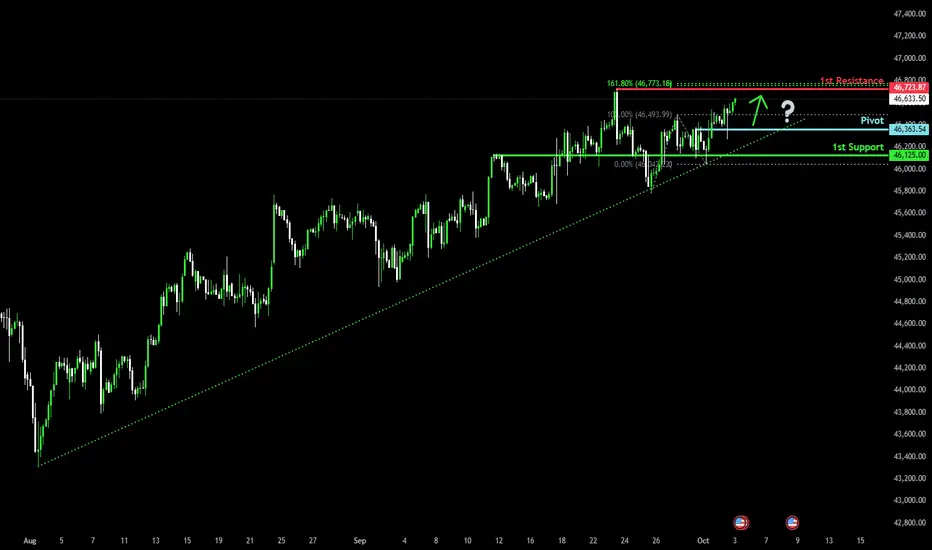
Bullish momentum to extend?Dow Jones (US30) has bounced off the pivot and could rise to the 1st resistance whch acts as a swing high resistance.
Pivot: 46,363.54
1st Support: 46,125
1st Resistance: 46,723.87
Disclaimer:
The above opinions given constitute general market commentary, and do not constitute the opinion or advice of IC Markets or any form of personal or investment advice.
Any opinions, news, research, analyses, prices, other information, or links to third-party sites contained on this website are provided on an "as-is" basis, are intended only to be informative, is not an advice nor a recommendation, nor research, or a record of our trading prices, or an offer of, or solicitation for a transaction in any financial instrument and thus should not be treated as such. The information provided does not involve any specific investment objectives, financial situation and needs of any specific person who may receive it. Please be aware, that past performance is not a reliable indicator of future performance and/or results. Past Performance or Forward-looking scenarios based upon the reasonable beliefs of the third-party provider are not a guarantee of future performance. Actual results may differ materially from those anticipated in forward-looking or past performance statements. IC Markets makes no representation or warranty and assumes no liability as to the accuracy or completeness of the information provided, nor any loss arising from any investment based on a recommendation, forecast or any information supplied by any third-party.
Trade ideas
US30: Consecutive breakouts signal an emerging downtrend
SPREADEX:DJI – When price rejects the high, the market begins to shift
On the 30-minute chart, price action is clearly signaling a loss of bullish momentum and a transition toward a bearish structure.
________________________________________
🧠 Price Action Analysis
1. First Failed Breakout
Price initially broke above the ascending trendline that had held since early October — but failed to hold the breakout.
➤ A classic early warning of buyer exhaustion, often seen during distribution phases.
2. Multi-Layered Resistance Zone
The 46,725 – 46,779 region has become a clustered resistance zone, rejecting price repeatedly.
➤ Multiple rejections here suggest dominant selling pressure, with strong supply overhead.
3. Second False Breakout
A more subtle second breakout attempt followed — but again, price was swiftly rejected.
➤ Consecutive failed breakouts typically indicate a lack of conviction and precede sharp reversals.
________________________________________
📉 Trend Structure Has Shifted Bearish
• Lower highs and lower lows now visible
• Price broke below the previous trendline
• Pullback attempts failed to reclaim broken support
• Market is respecting resistance instead of support
➡ These are clear signs of a short-term downtrend emerging.
________________________________________
🔻 Trading Strategy: Favoring Sell Setups in the New Bearish Context
✴️ Scenario 1: Sell at Retest of Proven Resistance Zone
• Optimal Sell Zone: 46,700 – 46,750
• This area has already triggered two failed breakouts — a third touch could be the ideal trap for late buyers
• Watch for bearish rejection candles (pin bars, bearish engulfing, etc.)
Suggested Sell Limit Order:
→ Entry: 46,730
→ Stop Loss: 46,830 (above prior swing high)
→ TP1: 46,500
→ TP2: 46,300
→ Risk-Reward: At least 1:2
_______________________________________
✴️ Scenario 2: Momentum Sell on Breakdown of Local Support
• Trigger Level: 46,580 — if price breaks below with strong momentum (long red candle, increased volume)
• Confirms trend continuation after consolidation
Suggested Sell Breakout Order:
→ Entry: 46,580
→ Stop Loss: 46,680
→ Target: 46,350 – 46,200
→ Tip: Use smaller position size if breakout appears weak to avoid getting trapped in a fakeout
________________________________________
🎯 Trade Management
• Only enter trades with clear price rejection or momentum confirmation
• Move SL to breakeven after TP1 is hit to lock in safety
• Exit the trade if price closes above 46,830 — that would invalidate the bearish thesis
________________________________________
False breakouts leave a trail — for those who know how to read it. It's not a failure. It’s the market whispering that direction has changed.
Please like and comment below to support our traders. Your reactions will motivate us to do more analysis in the future 🙏✨
Harry Andrew @ ZuperView

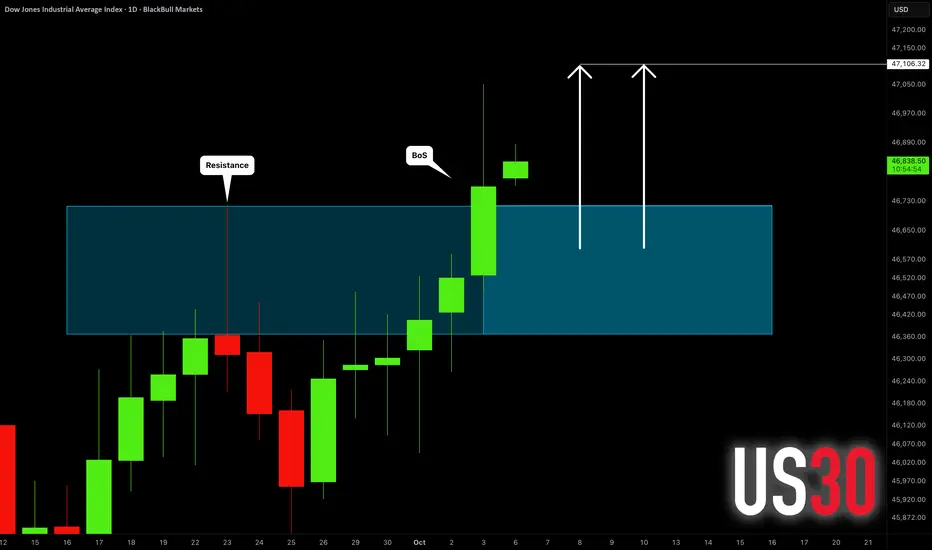
DOW JONES INDEX (US30): Another BoS Confirmed
US30 updated the all-time high on Friday, breaking and closing
above a major daily horizontal resistance cluster.
It opens a potential for more growth now.
Next resistance is 47100.
❤️Please, support my work with like, thank you!❤️
I am part of Trade Nation's Influencer program and receive a monthly fee for using their TradingView charts in my analysis.
ANALYSIS OF THE CURRENT 5-YEAR BULL CYCLEWe would look at the 20 year cycle in the stock market, there are two individual 20-year cycles running together at a time. One cycle defines tops and the other identifies the major market lows. We would also look at the 20- year periodicity of repeating market fractals and the 5-year bull cycle that commences at the beginning of each 20-year cycle.
In subsequent updates we will identify the 8 - 13 subdivision of the 20-year cycle. To make the chart clean we have only indicated the cycle that defines bottoms. Top cycles will be identified in the description and both cycles combined on one linear scale to see how they relate to the 5-year bull cycle.
Our pivot point is taken at the 22nd August 1921 low.
First Cycle duration:
22/08/1921 - 27/04/1942 = (7553 days /1079 weeks /248.2 months)
= 20 years, 08 months, 05 days.
Cycle 2:
27/04/1942 - 25/06/1962 = (7364 days / 1052 weeks / 242 months)
= 20 years, 01 month, 29 days.
Cycle 3:
25/06/1962 - 16/08/1982 = (7357 days / 1051 weeks / 241.7 months)
= 20 years, 01 months, 22 days
Cycle 4:
16/08/1982 - 07/10/2002 = (7352 days / 1051 weeks / 241.7 months)
= 20 years, 01 month, 21 days
Cycle 5:
07/10/2002 - 10/10/2022 = (7308 days / 1044 weeks / 240.1 months)
= 20 years, 0 month, 03 days
By observation, cycle 3 and 4 have the same duration 7357 days while cycle 2 is (+7 days) off 7357 days, i.e 1 candle on the weekly timeframe. Now, looking at the beginning points of each cycle, within the identified ellipses we see a striking fractal that has been consistent in all 5 cycles.
Cycle 1 and 2
Cycle 3 and 4
Cycle 5 and 6
The 20-year cycle that defines tops are on :
27th May 1946
7th February 1966
24th August 1987
8th October 2007
XX - XX - 2027
Cycle 1 origin point is on 22/08/1921 but has a split focus at two points, one on the 1921 pivot and the other on the much popular May 1924 low.
Representing both cycles (Bottoms and tops)
This shows that between the two origin points is approximately a 5-year cycle
This cycle is actually an astrocycle and varies according to the changing speed.
By observation, Fractal 1 is very much identical to fractal 4 and fracal 2 very much identical to 5. A time span of 60 years averagely separate fractals 1 and 4 as well as 2 and 5. This leaves the 1962 - 1966 cycle, 60 years from 1962 puts the origin for the new identical fractal at the October 2022 low.
The above justifies that if the cycle is not inverted then a point on the current price action should not be broken. Also it negates the numerous calls for a crash that has been chanted since the 2020 low and never materialized.
HOWEVER, there is the 101-year cycle which alternate tops for bottoms and vice versa after its completion, and considering the pivot from 22/08/1921 the 101 years ended at the October 2022 low.
Interesting... check back as we would go through the numerical expansions that shed more light on what to expect forward, price levels, and time resistances.
Thanks for your time, all opinions are much appreciated, questions would be answered too.
Good luck.

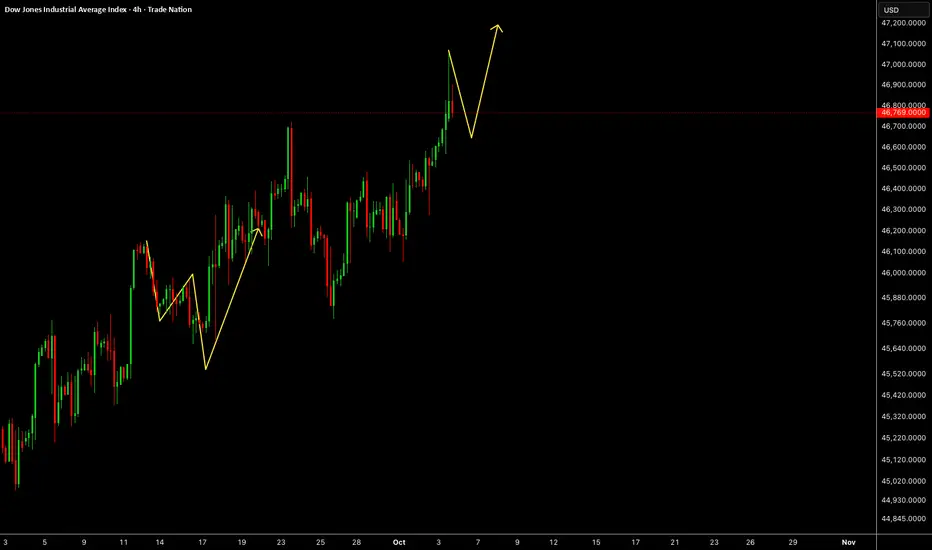
US30US30 needs some more correction before pushing up.
Disclosure: We are part of Trade Nation's Influencer program and receive a monthly fee for using their TradingView charts in our analysis.
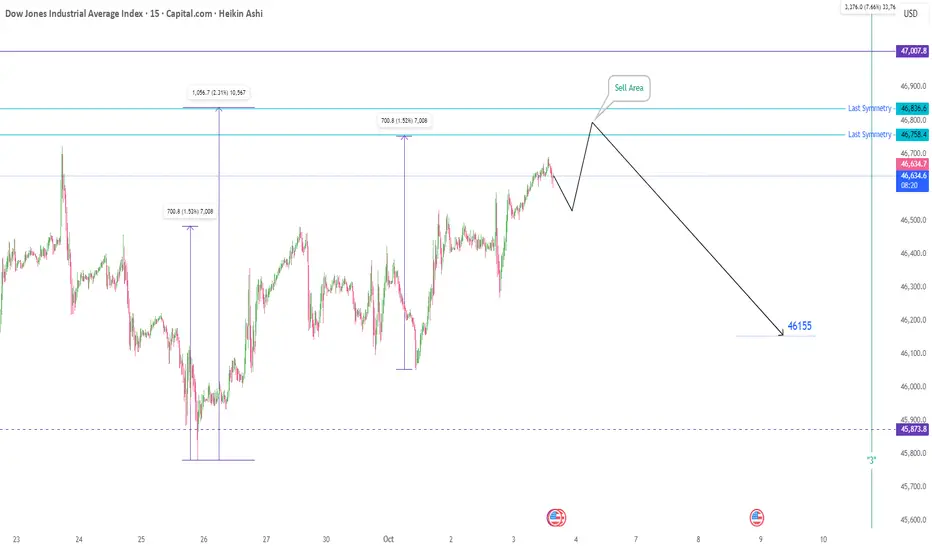
Us30 in FridayToday is Friday, the last trading day of the week. Despite the absence of major economic news releases, the following forecast for the Dow Jones Index is highly probable.
Upon market open and with an increase in trading volume, we anticipate an upward move. After registering a new price high, the index is expected to decline to approximately the 46,160 level.
Entering short positions within the specified target zone presents a favorable opportunity to capture profits. May it be profitable.
Please note: This is solely a trading idea. The responsibility for any trading decision rests entirely with the individual.
Believe or not, it's not TrumpThis is where all your dollars are about to be made or lost depending on your faith. Watch and learn.


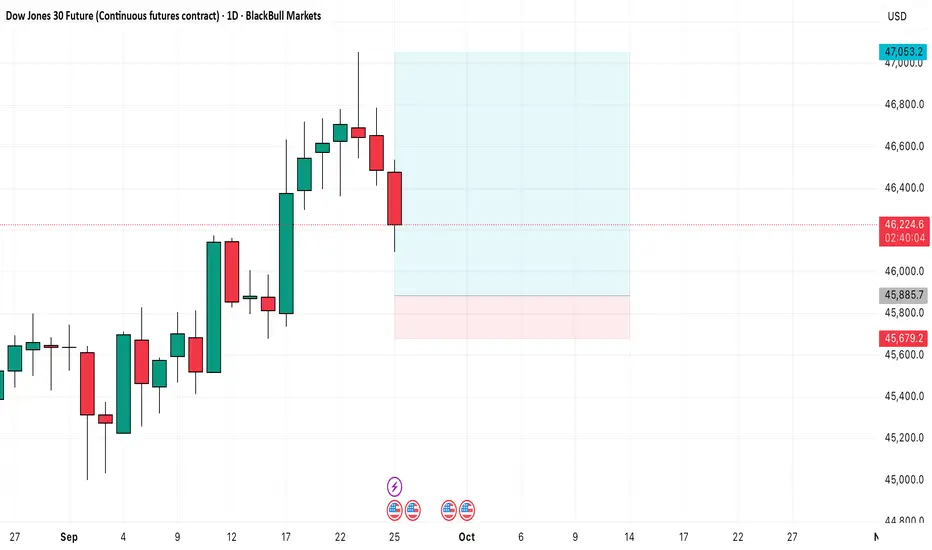
DOWFUT long setupDOWFUT long setup
Entry - 45885.7
Stop loss - 45679.2
Target - 47053.2
Risk Reward - 1:5.65

Dow Jones US30 Analysis: Bullish Trend, Trade Plan📊 The US30 (Dow Jones) remains in a strong bullish trend, showing a clear sequence of higher highs and higher lows on the 4-hour chart 📈. However, when viewed on the daily timeframe, price now appears somewhat overextended ⚠️.
🔎 Dropping down to the lower timeframes and applying the Anchored VWAP (AVWAP) indicator, it’s evident that price is trading well above VWAP, signaling a premium zone. The risk here is that traders may continue buying into strength without acknowledging that price could easily retrace back into VWAP.
💡 Remember — smart money buys at a discount, not at a premium. In bullish trends like this, patience is crucial.
📹 In the video, I outline my trade plan, which focuses on waiting for a healthy pullback and then looking for a bullish setup if the structure aligns in our favor. I’m not interested in chasing price when it’s this extended — instead, I prefer to wait for the retracement and enter at better value, reducing risk and improving trade quality 🎯.
⚠️ Disclaimer: This analysis is for educational purposes only and not financial advice. Always trade responsibly and manage risk carefully.

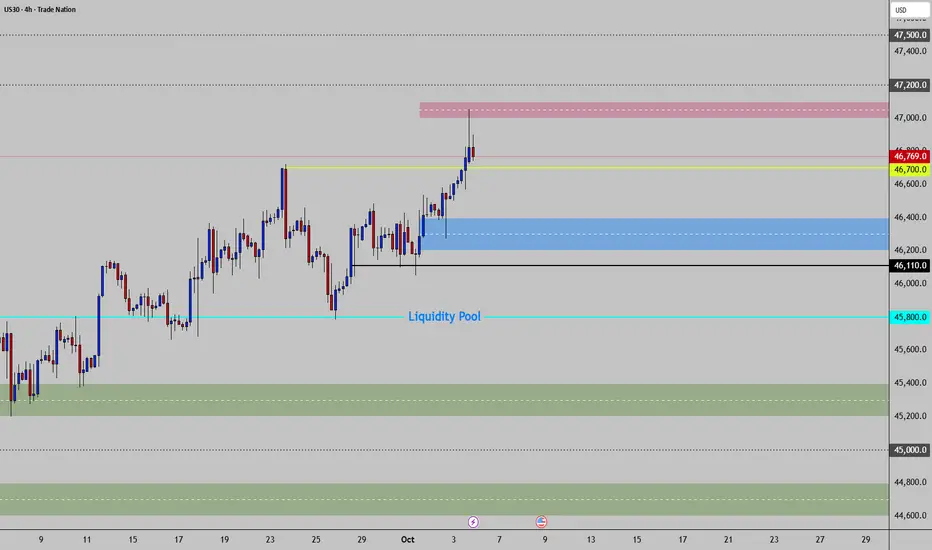
US30 - High Volume Control & Liquidity🚨My personal view:
➡️The Low Season/3rd Quarter is behind us.
➡️Liquidity is crucial for fresh acceleration in the High Season/Last quarter.
------------------------------------------------------------------------------------------------------------
🎯 KEY PIVOT
📍 Zone Type: DEMAND
📊 Price Range: 46,200-46,400
📏 Distance: 569 points below current price with strong support history
📊 MAIN BIAS
🔵 Bias: BULLISH
📌 Context: Strong uptrend near all-time highs
💎 DIAMOND EDGE - Primary Setup
🎲 Direction: Long from current levels targeting 47,000-47,100
🔍 Confirmations:
✅Bullish momentum continuation above 46,700
✅Bullish momentum continuation above KEY PIVOT @ 46,200-46,400
✅Break above 47,000 with strong volume
⚠️ NOTE:
✅Price 231 points from resistance. Watch for rejection at 47,000-47,100.
🎯 Bullish Extension Targets - Discovery
T1: 47,200
T2: 47,500
-------------------------------------------------------------------------------------------------------------
🔄 BIAS FLIP SETUP- BEARISH🔴
💡 46,100-46,400 critical support - break changes structure.
⚡ Triggers:
➡️Multiple Rejection @ 47,000-47,100 Confirming Resistance as Supply Zone.
➡️Then Clear and decisive break below 46,200
🎲 Direction: Short from 46,100
🔍 Confirmations:
🟧Bearish rejection wicks at 47,000-47,100
🟧Break and close below 46,200
🎯 Targets:
T1: 45,600 - 45,800 ➡️➡️LIQUIDITY
T2: 45,200-45,400
T3: 44,600-44,800
⚠️ SESSION RULES
❌Avoid chasing between levels.
✅Use your 50% markers as targets in-between key high-volume areas.
🕐 Trade only NYSE - US session (9:30am-4pm EST)
📰 Monitor Fed policy, economic data
Watch the Dow Industrial TrendlinesNext week 10/06/25 to 10/10/25 could see the convergence of two long- term Dow Jones Industrial Average (DJI) trendlines.
The trendline connecting the DJI January 2022 and December 2024 peaks is near the current DJI level.
Sometime prior support trendlines can become resistance.
The trendline connecting the bottoms made in October 2023, August 2024, and January 2025 converges with the peaks trendline next week!
The area of DJI 47,200 to 47,400 could be important resitance.
Watch the DJI trendlines!

US30 - Potential BuyHi traders,
We are looking to BUY CMCMARKETS:US30
Stay tuned :)
Price Action:
Short-term sell bias toward 41,700 zone based on lower high and projected weakness.
Watch reaction at 41,700—if buyers return strong with a new higher low, it resumes uptrend.
Invalidation: If price breaks above 42,800 with strength and closes above, sellers are overwhelmed—trend continues.
Good Luck :)
Study, Study, Study! Lorenzo Tarati

DowJones pre US Open key trading levelsKey Support and Resistance Levels
Resistance Level 1: 46908
Resistance Level 2: 47014
Resistance Level 3: 47210
Support Level 1: 46493
Support Level 2: 46409
Support Level 3: 46270
This communication is for informational purposes only and should not be viewed as any form of recommendation as to a particular course of action or as investment advice. It is not intended as an offer or solicitation for the purchase or sale of any financial instrument or as an official confirmation of any transaction. Opinions, estimates and assumptions expressed herein are made as of the date of this communication and are subject to change without notice. This communication has been prepared based upon information, including market prices, data and other information, believed to be reliable; however, Trade Nation does not warrant its completeness or accuracy. All market prices and market data contained in or attached to this communication are indicative and subject to change without notice.

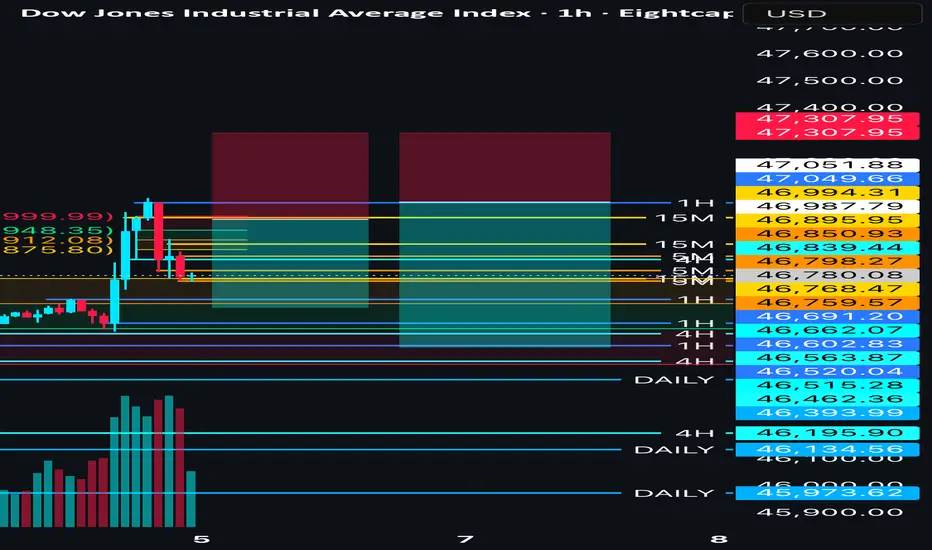
US30 1H🔹 Overall Outlook and Potential Price Movements
In the charts above, we have outlined the overall outlook and possible price movement paths.
As shown, each analysis highlights a key support or resistance zone near the current market price. The market’s reaction to these zones — whether a breakout or rejection — will likely determine the next direction of the price toward the specified levels.
⚠️ Important Note:
The purpose of these trading perspectives is to identify key upcoming price levels and assess potential market reactions. The provided analyses are not trading signals in any way.
✅ Recommendation for Use:
To make effective use of these analyses, it is advised to manually draw the marked zones on your chart. Then, on the 15-minute time frame, monitor the candlestick behavior and look for valid entry triggers before making any trading decisions.

US30Trading set up for Monday, us30 is that all-time high, potential short set ups, but then there could be possible longs if bounce off any of these levels?
Is the Dow Jones still bullish? Yes.
Hello everyone
I think Dow Jones has the potential to grow further and if the conditions set in the figure below are met, it can be said that it can easily reach the set target. What do you think, friend? Leave me a comment

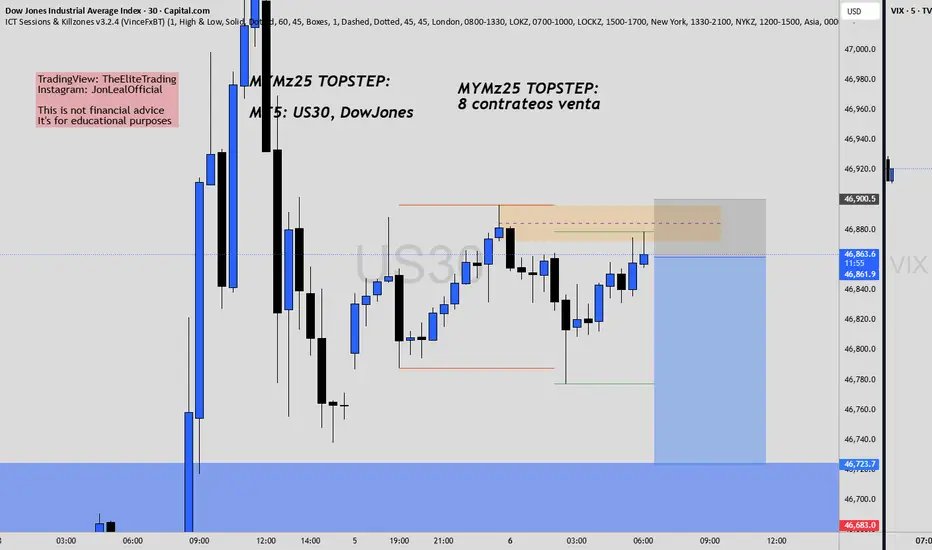
To you in comment…Us30…
FYI…. How far I’m willing to take it. 👀
Let’s get it!!!
Ny active!!!!
Bag or Dust 🏦

$us30Dirty 30….
She’s hunting $46,900+
Layered in as and willing to go $46,606 which holds key to pricing a long or short!!!
Let’s get it!!!!

DJI Holy sh!% Bubble, 2028Just an idea I was playing around with, Dow Jones on this long parabolic move and the resulting crash wIll be fantastically devastating for the american people, again.

Wyckoff Distribution schematicsThis count is based on my assumptions so anything can happen not a trading or financial advice just for educational purposes only kindly do your own ta thanks trade with care good luck.
