Trade ideas
Us30 Trade Set Up Oct 2 2025Price is overall bullish making HH/HL and has created a 4h FVG so i want to see price first sweep SSL/London lows, tap into 4h FVG to then look for 1m IFVG/CISD to target PDH
www.tradingview.com


Dow Key Trading LevelsKey Support and Resistance Levels
Resistance Level 1: 46580
Resistance Level 2: 46690
Resistance Level 3: 46850
Support Level 1: 46170
Support Level 2: 46040
Support Level 3: 45800
This communication is for informational purposes only and should not be viewed as any form of recommendation as to a particular course of action or as investment advice. It is not intended as an offer or solicitation for the purchase or sale of any financial instrument or as an official confirmation of any transaction. Opinions, estimates and assumptions expressed herein are made as of the date of this communication and are subject to change without notice. This communication has been prepared based upon information, including market prices, data and other information, believed to be reliable; however, Trade Nation does not warrant its completeness or accuracy. All market prices and market data contained in or attached to this communication are indicative and subject to change without notice.
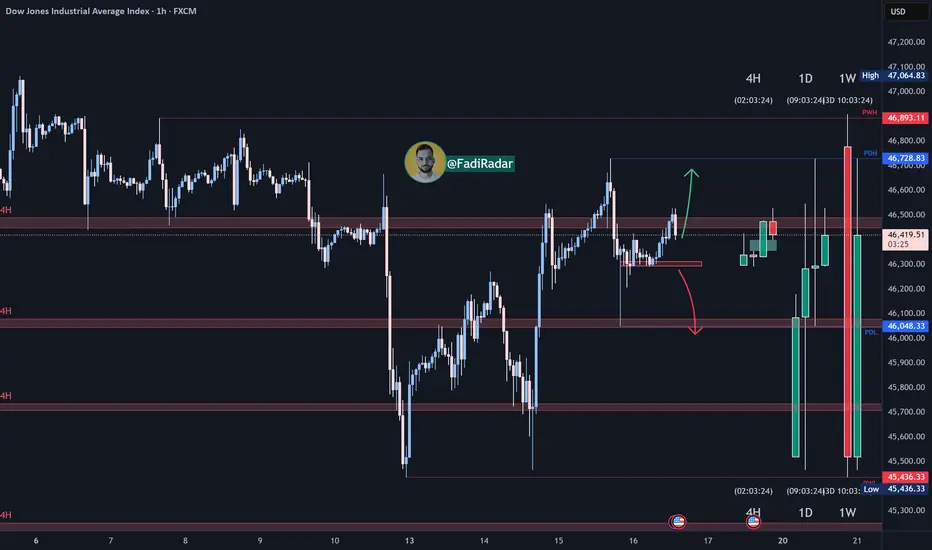
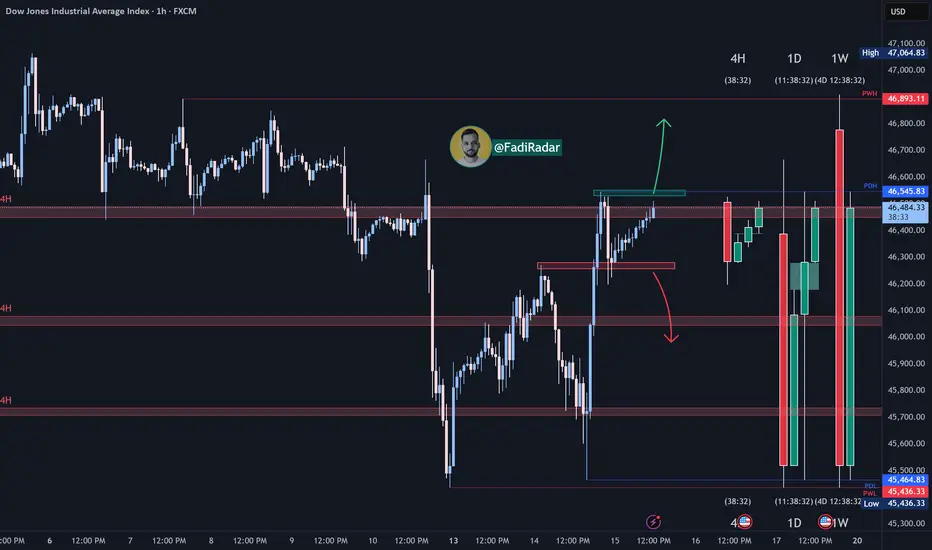
Us30 Trade Set Up Oct 16 2025Price is trading in between PDH/PDL and has filled a 4h and 1h bearish FVG so for sells id want to see London highs/BSL swept but closed under followed by internal 1m bearish structure to take sells to Asia lows/SSL or PDL but for buys id want to see Asia lows/SSl swept first to then look for bullish structure on the 1m to catch buys to PDH

Dow Jones (US30) Analysis:The Dow Jones index is moving in a short-term uptrend and is currently heading to test the 46,300 support zone, which is considered a good buying area if a bullish rebound occurs.
🔻 Bearish Scenario:
If the price breaks below 46,300 and holds, traders can look for short-term selling opportunities.
📈 Best Buy Zone: 46,300
📉 Best Sell Zone: below 46,300 after a confirmed break
Midnight SeekerI doubt there will be a downward manipulative move before an initial one, what do you see?


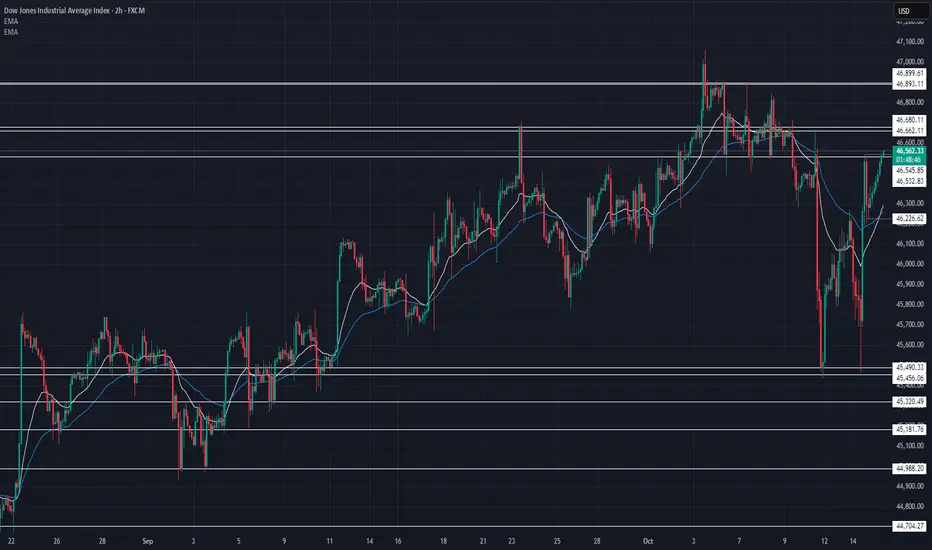
US30 Technical Breakdown – 10/15/2025📍 US30 Technical Breakdown – 10/15/2025
US30 bouncing strong from 45,600 support 🔥 — bulls pushing price back into a key resistance zone near 46,550–46,680. Momentum picking up but still under a heavy ceiling 💪📈
📊 Market Behavior:
🔹 Sharp recovery after double bottom around 45,600
🔹 EMAs turning bullish again after crossover
🔹 Price testing resistance — potential breakout or rejection zone
📌 Key Levels:
🔹 Resistance Zones:
46,545 → intraday resistance
46,662 → strong ceiling
46,680–46,900 → breakout area 🚀
🔹 Support Zones:
46,226 → short-term support
45,837 → mid-level demand
45,490 → deep pullback zone
🧠 Bias:
Bullish–Neutral 🟢
➡️ Above 46,680 → potential breakout toward 46,900
⬅️ Below 46,220 → possible retrace to 45,800
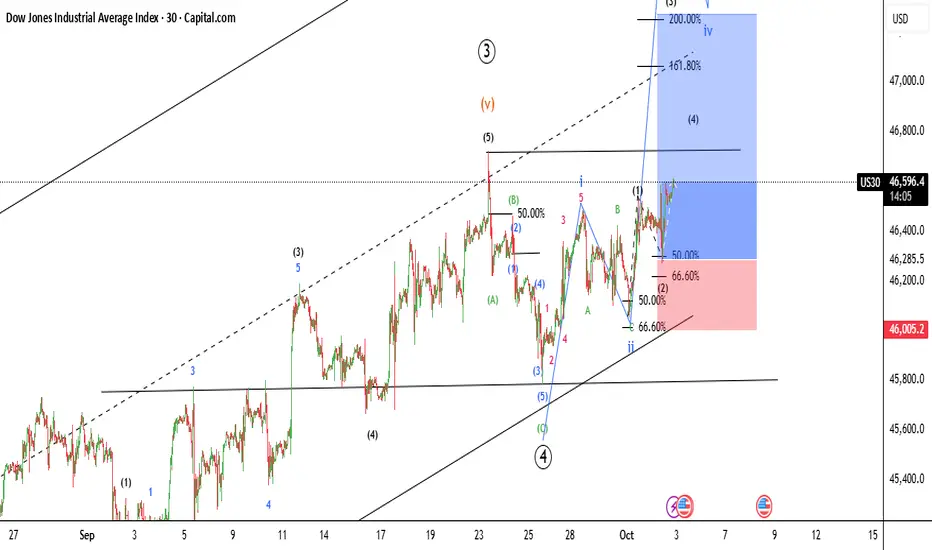
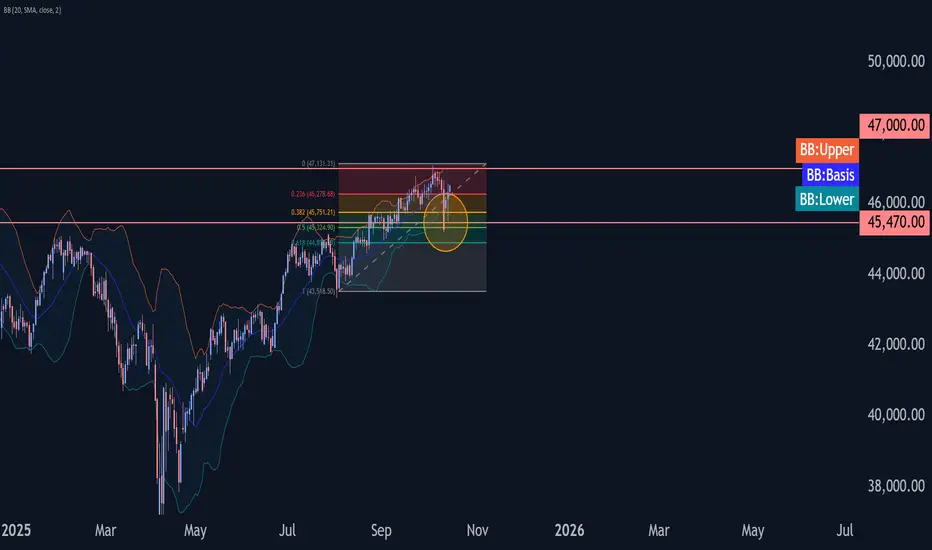
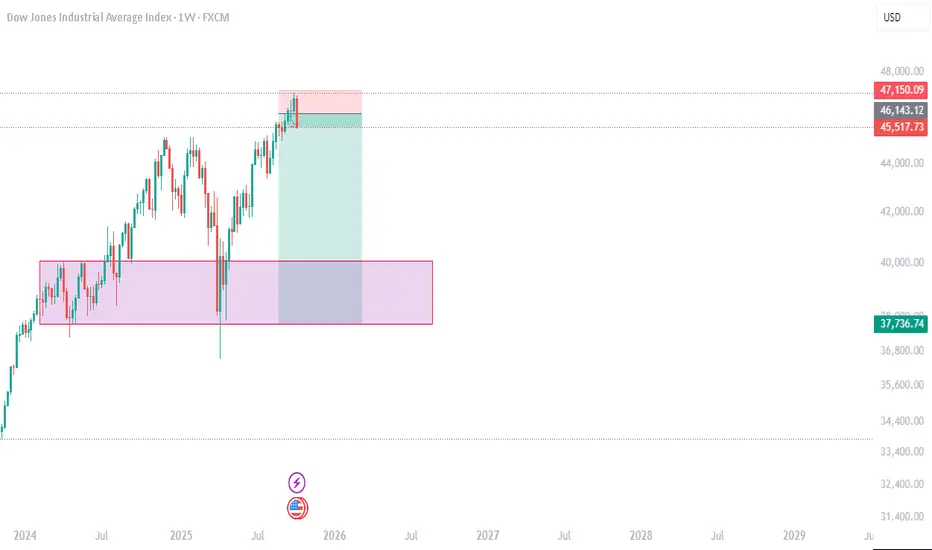
Dow Jones Wave Analysis – 15 October 2025
- Dow Jones reversed from support zone
- Likely to rise to resistance level 47000.00
Dow Jones index recently reversed up from the support zone between the key support level 45470.00 (former resistance from August), lower daily Bollinger Band and the 38.2% Fibonacci correction of the upward impulse from August.
The upward reversal from this support zone created the daily reversal pattern Hammer, which stopped earlier correction ii.
Given the strong daily uptrend, Dow Jones index can be expected to rise further to the next resistance level 47000.00 (which stopped earlier impulse wave i).
Dow Jones (US30) Analysis:The Dow Jones Index is heading toward a key resistance level at 46,550.
🔻 If the price rejects this level, it is likely to retrace back to test support at 46,250, and a break below this support could resume the bearish trend.
🔺 However, if the index breaks and holds above 46,550, this could push the price higher toward 46,700 as the first target.
📈 Best Buy Zone: After confirming a breakout above 46,550
📉 Best Sell Zone: On rejection from 46,550 or a confirmed break below 46,250
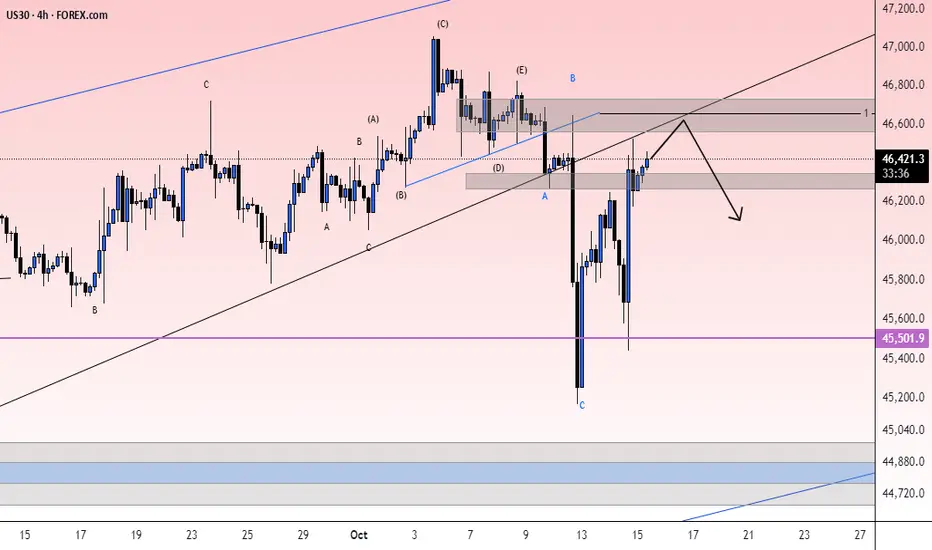
check the trendIt is expected that a trend change will form in the current resistance range and we will witness the beginning of a downward trend.
As long as the index does not stabilize above the resistance range, the continuation of the downward trend and correction will be likely.
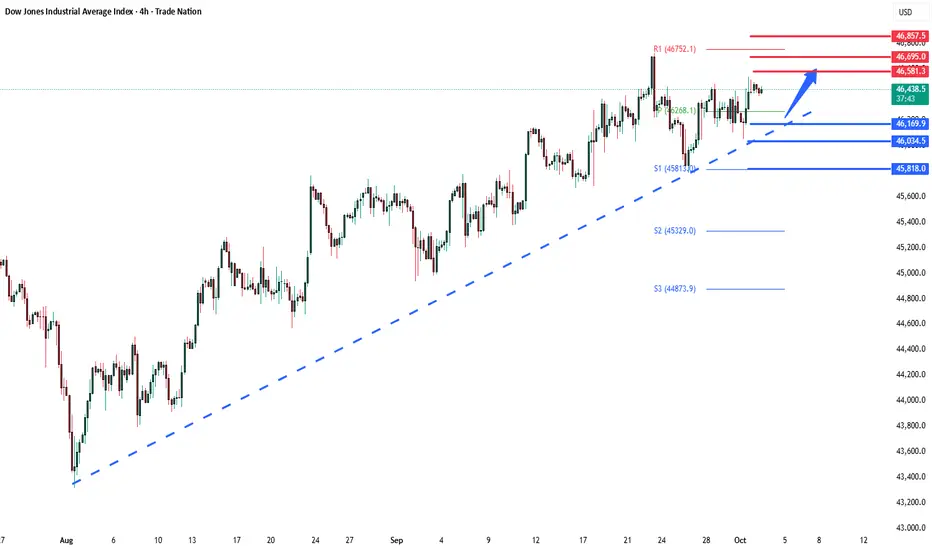
US30 (Dow Jones) Trade UpdateTimeframe: 4-hour
Current Price: 46,385.40
Key Levels:
Resistance: 46,493 (watch for a breakout and retest for potential buy setups)
Support: 45,705.02 (watch for a breakdown and retest for potential sell setups)
Strategy:
If 46,493 is broken and price retests, I will look to add buy positions for a potential move higher, targeting resistance around 47,000.
If price fails to break above this level and breaks support at 45,705.02, I will look for sell setups on the retest, targeting lower support levels around 45,210.

MARKET RECAP-FED CHAIR POWELL SPEAKS_DOW JONES_RF+NEWS10-14-25-News-Daily Recap-Market opened up on Sunday 12, 2025. Market gapped. initally expecting gap to fill later in the week. But the market filled gap Tuesday 10/14/25/ Traded to the buyside, into higher timeframe (Daily) small FVG. Expecting some sell off, then retracement higher. News Thursday Core PPI.

Breaks Above 46,400.00 as Bulls Extend RecoveryUS30 has pushed decisively above 46,400.00, confirming strong buyer momentum after last week’s deep correction. This breakout shifts short-term sentiment firmly bullish, with price now eyeing the next resistance at 46,809.40.
Support at: 46,400.00 🔽 46,150.00 🔽
Resistance at: 46,809.40 🔼 47,000.00 🔼
🔎 Bias:
🔼 Bullish: Momentum remains with buyers while price holds above 46,400.00. A sustained move could target 46,809.40, and a break above that opens the path to 47,000.00.
🔽 Bearish: Only a drop back below 46,400.00 would weaken the current momentum and expose 46,150.00 as the next test for buyers.
📛 Disclaimer: This is not financial advice. Trade at your own risk.


Dow Jones (US30) Analysis:The Dow Jones index is seeing a decline today, currently trading near the support zone at 45,800.
🔻 If 45,800 breaks and holds below, the price is likely to retest the previous low at 45,430.
🔺 However, if the index rebounds from the current support zone, it may rise toward 46,000 initially, and a breakout above this resistance could push it further to 46,300.
📉 Best Sell Zone: Below 45,800 (after confirmation)
📈 Best Buy Zone: Upon rebound from 45,430
Us30 Bearish forminglets see if Us30 resists our recent low.. After all its thr third day US Goverment shutdown.

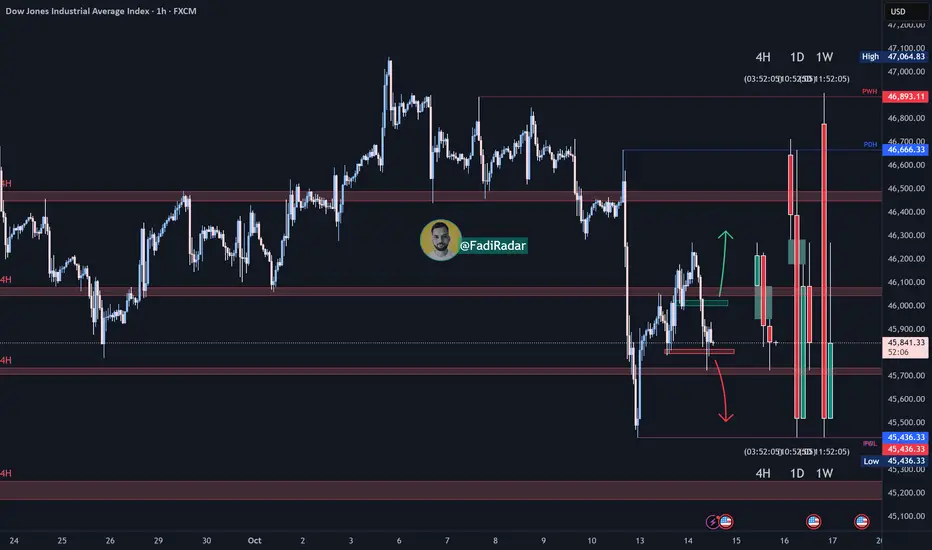
Us30 Trade Set Up Oct 13 2025Overall price is still bearish but today i can see price sweeping SSL, touching 50% of the 1h Gap and targeting the 4h FVG before continuing its bearish trend

There is initial projected support for Monday at 45362 and 45154This channel is not providing individualized trading or investment advice, nor is it a banking service, brokerage service, trading service, investment service or money management service

US30The Dow Jones (US30) has experienced a strong bearish move, breaking below recent consolidation levels. Currently, price is testing a key demand zone around 45,263 – 45,206, where a potential short-term reversal may occur if buyers step in.
Key Reversal Zones:
🔹 45,686.9 – Possible first reaction zone / intraday support.
🔹 46,178.6 – First bullish target if a rebound occurs.
🔹 46,769.8 – 46,996.3 – Major resistance / key reversal area to watch for rejection or continuation.
As long as the price holds above 45,200, we could see a relief rally toward the upper resistance zones. A breakdown below this level could open the way to deeper bearish continuation.
📈 Bias: Short-term bullish correction within a larger bearish structure.
🕓 Timeframe: 4H

US30 Analysis (Short Bias)Market structure continues to respect the bearish outlook. After multiple rejections near the upper resistance zone, momentum has clearly shifted in favor of sellers. I’ve been anticipating this short move for a while, and it’s finally playing out as expected.
Last week’s price action toyed with my analysis, showing temporary bullish strength, but this week is confirming the setup for a deeper correction. The short is finally coming true after a long wait and has almost reached the target. The prediction was right.
US30 4H🔹 Overall Outlook and Potential Price Movements
In the charts above, we have outlined the overall outlook and possible price movement paths.
As shown, each analysis highlights a key support or resistance zone near the current market price. The market’s reaction to these zones — whether a breakout or rejection — will likely determine the next direction of the price toward the specified levels.
⚠️ Important Note:
The purpose of these trading perspectives is to identify key upcoming price levels and assess potential market reactions. The provided analyses are not trading signals in any way.
✅ Recommendation for Use:
To make effective use of these analyses, it is advised to manually draw the marked zones on your chart. Then, on the 5-minute time frame, monitor the candlestick behavior and look for valid entry triggers before making any trading decisions.
