xau usd good for longWe have price action for purchases, we go with the trend and go for our objectives, the white lines
XAUUSD trade ideas

GOLD / XAUUSD UPDATE !!!!www.tradingview.com
The gold market is currently in a holding pattern, with traders reluctant to make premature decisions due to upcoming significant news. A consolidation below the level of 2315 is observed.
A false break of support has led the price to retest the 2310-2315 range, after which traders are pausing before the news release. All attention is focused on the forthcoming major events, namely the CPI and the Fed meeting. The key US CPI data will influence the Fed's stance on interest rates, which will, in turn, significantly affect the value of the US dollar and gold prices in the short term. The market anticipates neutral data (no change), which would likely maintain the same fundamental backdrop. However, the actual data is highly anticipated, especially after last Friday's unexpectedly high NFP.
Any initial reaction to the US CPI data might be short-lived as gold traders will soon turn their attention to the FOMC & Fed meeting.
Resistance levels are identified at 2315, 2325, and 2354, while support levels are found at 2305, 2291, and 2267.
From both a technical and fundamental perspective, gold appears weak at the moment. Amidst high volatility, the price may attempt to breach 2325 and test the liquidity zone of 2335-2345, then transition to a decline phase if the fundamental backdrop is conducive. The risk of further decline remains substantial, but the upcoming news could either exacerbate this decline or disrupt the market structure.

Gold possible forming an expanding triangle. 12/June/24XAUUSD possible trending up for wave e ( Blue circled) on an expanding triangle in wave B (red).

still seeking for buyi expect to see such move, i think with some patience we can enter in right position in right price
Good luck
Arya the trader

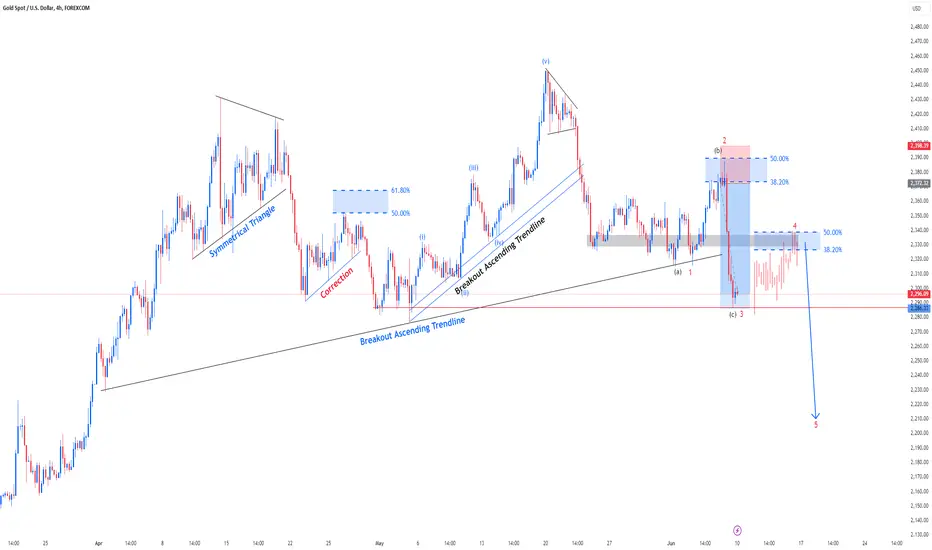
XAUUSDGold price is likely to move to the downside on the 4-hour timeframe due to a breakout below the ascending trendline and completion of the Elliott Wave 3. Currently, a minor upward retracement to the 50% level suggests Wave 4 is completing. Once this retracement concludes, the price is expected to resume its bearish trend.
XAUUSDHi guys,
In this chart i Found a Demand Zone in XAUUSD CHART for Positional entry,
Observed these Levels based on price action and Demand & Supply.
*Don't Take any trades based on this Picture.
... because this chart is for educational purpose only not for Buy or Sell Recommendation..
Thank you

long term down trend is over?It seems that the increase in demand for gold does not allow a lower low to be formed. We should wait for a while and patiently enter into long postion, if we will sure of the weakness in the formation of lower low.


XAUUSD - Correction (Long)Internal journal entry I am sharing with you all (Transparency)
Based on my rules this is a counter-trend trade however
we are at the bottom of a channel at a key level and failed to break the low. Instead price created a higher lower, which is a change of character
A break and close above 2312 means I will target 2332

Gold in pulback for breaked trend Gold in pulback for breaked trend
Highest price betwen 2322_2330 and can short it for 2250 and 2200

Gold/USDKey Characteristics of the Bearish Gartley Pattern:
Initial Move (XA): The price movement starts with a significant bullish move from point X to point A.
Retracement (AB): The price then retraces from point A to point B, typically retracing 61.8% of the XA move.
Extension (BC): Following the AB retracement, the price moves again in the direction of the initial XA move to point C, which is typically 38.2% to 88.6% of the AB move.
Correction (CD): Finally, the price makes another move from point C to point D, which is an extension of 127.2% to 161.8% of the BC move. Point D is usually at the 78.6% retracement of the XA leg.

GOLD (XAUUSD): Ahead of CPI, FOMC & FED Rate Decision,Your PlanTraders, please keep in mind that we have important economic events such as the US CPI & FOMC, as well as the FED Interest Rate decision later today. Here is my analysis for GOLD before the news.
The pair recently broke through a key daily support level, leading to a new lower low and a correctional move. On the 4H chart, a bearish flag pattern is evident. A break below the flag's support would indicate a strong bearish trend and trigger a sell-off.
It's important to note that the previously broken support level now acts as a strong resistance level.
On the other hand, a bullish breakout above the highlighted supply zone with a 4H candle closing above it would signal a strong bullish move.

XAUUSD - LONG - SHORT - LONGXAUUSD - LONG - SHORT - LONG
Coming week very High volitivity week.. I'm expecting Gold's reaction can be as I show in the chart. trade with care and risk small.
V.Ragu

XAUUSD|GOLDGold scenarios!
Based on harmonic pattern and also W in weekly time frame I think we may have some bearish trend in Gold!
Share your thoughts in the comments.

XAU/USD 12 June 2024 Intraday AnalysisH4 Analysis:
Analysis/Bias remains the same as yesterdays analysis dated 11 June 2024.
-> Swing: Bullish.
-> Internal: Bearish.
Price has continued to trade to the downside
Price has now pinted a bullish CHoCH which indicates initiation of bullish pullback phase.
Strong swing low is expected to hold, however, it would be worth noting the swing low must be taken as the weekly and daily TF's are both in pullback phase.
Yesterday's intraday expectation dated 10 June 2024 was for price to price to print bullish CHoCH, trade up to premium of internal 50% EQ before targeting weak internal low.
Price has printed a bullish CHoCH which is indicative of bullish pullback phase initiation.
Intraday expectation: Price to continue bullish, react at premium of 50% EQ or H4 POI before targeting weak internal low.
H4 Chart:
M15 Analysis:
Analysis/Bias remains the same as yesterdays analysis dated 11 June 2024.
-> Swing: Bullish.
-> Internal: Bearish.
Price has printed a bullish CHoCH which is indicative of bullish pullback initiation.
We are now trading within an internal high low.
Yesterday's intraday expectation was for price to print bullish CHoCH to indicate, bullish pullback initiation. Price to trade up to premium of 50% EQ, or, M15 supply zone before targeting weak internal low.
Bullish CHoCH has been printed.
Intraday expectation: Price to trade up to premium of 50% EQ or M15 supply zone before targeting weak internal low.
M15 Chart:


GOLD/XAUUSD MONTHLY Higher speculations this week ahead on FOMC/FED rate, Im expecting price could go higher again atleast 2500 level befor it rips below 2000 level.
This idea base on MOnthly opening on MAY and this June month. Im expecting price to go lower after the New high.
Im not saying this trade a buy this time. Im buying 2000 level again for longterm hold. If youre on
scalping this is not for you. THis idea are for longterm trades or monthly or Quarterly .
Im expecting the dollar might go back again. imagine those level 104$ not so much changing.
Now I will be updating this idea once the price goes above and Goes lower or 2000 level again..
This might be the boring trades you got.
This is not a financial advice.
Follow for more MOnthly trades on $GOLD.
ciao.
Im here to give you context on higher view.

Gold possible sellThe market can be funny sometimes, price reaching my target might not be successful, but Breakeven will be the next factor, almost gotten to my target then price reverse impulsively, not money lost and no money gained, I still stick to my trading plan

Heading into pullback resistance, could it reverse from here?The Gold (XAU/USD) is rising towards the pivot which acts as a pullback resistance and could reverse to the pullback support.
Pivot: 2,319.97
1st Support: 2,286.09
1st Resistance: 2,351.54
Risk Warning:
Trading Forex and CFDs carries a high level of risk to your capital and you should only trade with money you can afford to lose. Trading Forex and CFDs may not be suitable for all investors, so please ensure that you fully understand the risks involved and seek independent advice if necessary.
Disclaimer:
The above opinions given constitute general market commentary, and do not constitute the opinion or advice of IC Markets or any form of personal or investment advice.
Any opinions, news, research, analyses, prices, other information, or links to third-party sites contained on this website are provided on an "as-is" basis, are intended only to be informative, is not an advice nor a recommendation, nor research, or a record of our trading prices, or an offer of, or solicitation for a transaction in any financial instrument and thus should not be treated as such. The information provided does not involve any specific investment objectives, financial situation and needs of any specific person who may receive it. Please be aware, that past performance is not a reliable indicator of future performance and/or results. Past Performance or Forward-looking scenarios based upon the reasonable beliefs of the third-party provider are not a guarantee of future performance. Actual results may differ materially from those anticipated in forward-looking or past performance statements. IC Markets makes no representation or warranty and assumes no liability as to the accuracy or completeness of the information provided, nor any loss arising from any investment based on a recommendation, forecast or any information supplied by any third-party.

Gold buy (27pips)After the instant SL Hit we took on NFP Friday it’s time to collect some liquidity, expect a bull run on this trade as the market needs to balance the orders. This is only a trade idea. Use proper risk management and Happy trading OANDA:XAUUSD FOREXCOM:XAUUSD TVC:DXY

Don’t be bearish on gold and don’t chase shorts either.
The gold price needs to retreat to the $2,300 mark and then to $2,280. The gold price retreat is just an adjustment, not the end of the upward trend. The retreat is the time to go long. These are the two different voices in the market in recent days. Who is right and who is wrong, and what is the strength level, the final trend is the best proof.
A wave of retreat and adjustment, and multi-day consolidation, the gold price ushered in a strong rise yesterday, starting from the lowest $2,325, breaking through multiple resistances in succession during the session, reaching a high of $2,357, firmly locking the gains. As of this morning, the price rose to $2,374 again, and the strength continued.
The US ADP employment data for May was released yesterday, and the final value was recorded at 152,000, which was lower than the expected 175,000. After the data was released, not only the previous value was revised to 188,000, forming a favorable support for gold and silver
The subsequent Bank of Canada announced its interest rate decision, reducing the original interest rate from 5% to 4.75%, as expected by the market. Canada has become the first country in the G7 to enter a rate cut cycle. Officials also said that they are more confident that inflation will fall to the target of 2%. If it continues to develop, "it is reasonable to expect further rate cuts."
The amount of rate cuts is not important. What is important is that the move to cut interest rates means that the Fed's rate cut is coming. At this time, the market has reduced the probability of no rate cuts this year to 28%, and the probability of a rate cut to 25%. The expectation of a rate cut in September has been further strengthened. In my opinion, the Fed should cut interest rates in advance before September.
In addition to the above good news, the final value of the US ISM Manufacturing PMI index data for May released yesterday was 53.8, exceeding the expected value of 50.8 and the previous value of 49.4, setting a new high since August last year, but for now, the impact on the market seems limited, and the general direction of development will not change because of this data.
After the Bank of Canada cut interest rates yesterday, the European Central Bank will have its interest rate decision today. It seems that the market consensus is that the meeting will start cutting interest rates. In theory, it will be bad for gold, because the rate cut will lead to the depreciation of the euro, which will push up the dollar. But in reality and in the long run, it will definitely be good for gold, because the rate cut of the European Central Bank strengthens the rate cut of the Federal Reserve. Once the Federal Reserve starts to cut interest rates, no one can stop the rise of gold.
It needs to be emphasized again that the upward trend of gold is unquestionable. It is not because the price has risen now that we say this, but because we have been emphasizing in the decline that the retracement is the time to intervene and go long. At the same time, we have not chosen to be bearish and short in order to cater to the mainstream voice of the market. The current price increase further proves that our thinking is correct.
Strongly break upward, resistance turns into support, short-term support is around $2350, further support is around $2340, upper resistance is $2380, break through and stand firm, further look at the $2400 mark, this round of rise can be reconfirmed, $2400 mark is not the final goal, staged extension can see $2420-2430 area (not today), in short, we still maintain a bullish and long mindset, no bearish or short.
I hope you can give me suggestions on my analysis so that I can improve my progress, thank you

XAUUSD, WEEKLY CHART... here's how it looks.I've been trying some custom approach / experiment on detecting reversal play in advance stages -- and my current case study is XAUUSD. Here's how it looks. Based on weekly data, we got a thinning price line with a shifting inverted support lines (bottom lines). A good confirmation Identifier would be a complete horizontal inverted support line shift.
1950 (completed support line) would be the key price point for that level.
Touch it, and we got a BUY SIGNAL. Non-confirmatory (risky) would be 1940 level.
TAYOR.
Safeguard capital always.
