Bitcoin + Major altcoins requests! (write your altcoin)I am here to help the TradingView crypto community with decisions on altcoins. Write a comment with your altcoin + hit the like button, and I will make an analysis for you in response.
While Bitcoin is heading towards 69,000 USDT, please take a look at my newest technical analysis. The price of Bi
Key data points
No news here
Looks like there's nothing to report right now

BITCOIN Breaking Down – Is $78K Inevitable?COINBASE:BTCUSD is continuing its bearish trend after rejecting from the resistance level within the descending channel. The price formed a converging triangle at this level and broke out to the downside, confirming strong selling pressure.
If sellers maintain control at this level, we could see a

A Closer Look at Bitcoin's Elliot Wave PatternHello friends, today we'll attempt to analyze the Bitcoin chart using Elliot Waves. Our approach will involve using Elliot Wave theory and structures, which involve multiple possibilities. The analysis we present here focuses on one potential scenario that seems possible to us.
Please note that thi

BITCOIN This is why it will make new ATH this year.The simplest explanation is perhaps sometimes the best. In this context, this is a simple yet powerful Bitcoin (BTCUSD) chart, showing why the Bull Cycle hasn't peaked yet and why a new All Time High (ATH) is coming by the end of 2025.
So, this is the 12M time-frame, essentially each BTC candle rep

BITCOIN is exactly where it's supposed to be.Bitcoin (BTCUSD) is under heavy pressure lately due to the trade tariffs but as long-term investors, we shouldn't let this volatility affect us.
The MVRV has been one of the most consistent cyclical Top (sell high) and Bottom (buy low) indicators giving only a maximum of two optimal signals in each

BITCOIN Outlook: Watch for a Drop Toward $85100COINBASE:BTCUSD has reached a key resistance level, an area that has been a key point of interest where sellers have regained control, leading to notable reversals in the past. Given this, there is potential for a bearish reaction if price action confirms rejection, such as a bearish engulfing cand

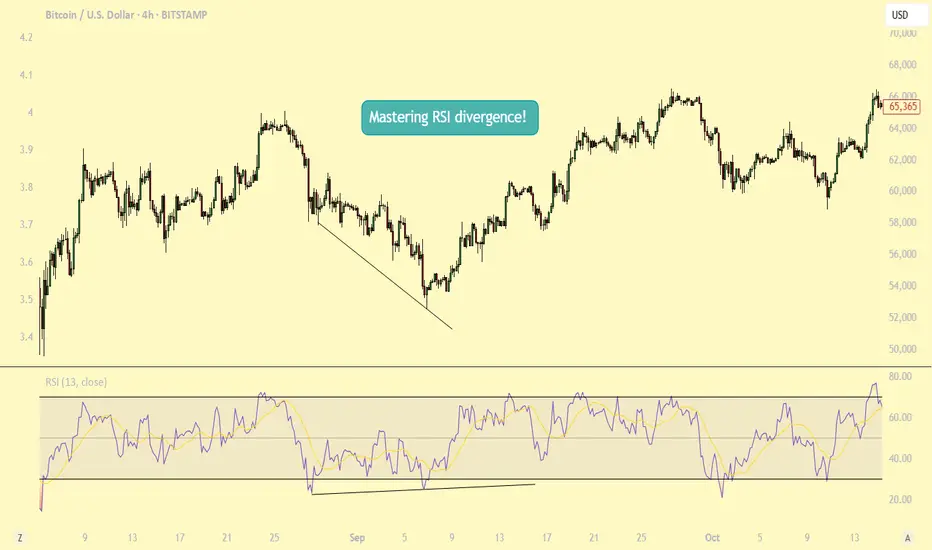
Mastering RSI Divergence: A Complete Guide to Trend ReversalsWhat Are Divergences?
In this guide, we will explore the concept of divergence and how it can be effectively utilized alongside the Relative Strength Index (RSI), one of the most popular momentum indicators in technical analysis. Divergence occurs when the price of an asset moves in the opposite di
Bitcoin - This Is Just Unbelievable!Bitcoin ( CRYPTO:BTCUSD ) is not dropping at all:
Click chart above to see the detailed analysis👆🏻
After we have been seeing one of the craziest weekly drops which I have experienced in my entire trading history, all major cryptos and especially Bitcoin are strongly holding their levels. Sinc

BITCOIN → The price is consolidating, but there is a BUT!BINANCE:BTCUSDT is forming a consolidation after a false breakout of trend resistance. Against the backdrop of the global market crash (stock market, futures, forex) bitcoin looks quite strong, but I wouldn't get excited ahead of time
Bitcoin is trading inside a downtrend and also inside a ran

Bitcoin: Watching For Reversal 78K AREA.Bitcoin bear flag has become in play over the previous week as I anticipated in my previous week's analysis. While there is a potential minor support in the 81 to 80K area, the lower high established at 88K implies a lower low is likely to follow which can unfold this week. This scenario could see p

See all ideas
Summarizing what the indicators are suggesting.
Oscillators
Neutral
SellBuy
Strong sellStrong buy
Strong sellSellNeutralBuyStrong buy
Oscillators
Neutral
SellBuy
Strong sellStrong buy
Strong sellSellNeutralBuyStrong buy
Summary
Neutral
SellBuy
Strong sellStrong buy
Strong sellSellNeutralBuyStrong buy
Summary
Neutral
SellBuy
Strong sellStrong buy
Strong sellSellNeutralBuyStrong buy
Summary
Neutral
SellBuy
Strong sellStrong buy
Strong sellSellNeutralBuyStrong buy
Moving Averages
Neutral
SellBuy
Strong sellStrong buy
Strong sellSellNeutralBuyStrong buy
Moving Averages
Neutral
SellBuy
Strong sellStrong buy
Strong sellSellNeutralBuyStrong buy
Displays a symbol's price movements over previous years to identify recurring trends.
Curated watchlists where BTCUSD.P is featured.

Gen 1 crypto: from little acorns grow
15 No. of Symbols

Proof of Work: Embracing the crunch
27 No. of Symbols
See all sparks