Apple - Long - Target 205Apple stock is expected to go higher from the current levels.
The stock has strength to go higher to the levels of 205.
It might test the levels of 166 or even 159 before the further long move.
APC trade ideas

Apple retracement back to $182 Buy putsWIth the SPY filling the GAP at $456, NASDAQ:AAPL has been straight up in the sky from $165, expect a 50% retracement back to the breakout on the daily which is $182. I bought heavy puts two months out in the $180 range.
I am looking for a $1 on the options trade.

APPLE Inc. - Bullish TrendA series of Higher Highs and Higher Lows are being displayed for APPLE Inc. - NASDAQ. All trade levels are displayed to get in long position.

AAPL Review:
Let’s review the key points of the previous update (November 5th):
Wave II of a of y of 2 on Monday.
Started the second 80D cycle of the current 20W cycle.
20D cycle trough: 10th of November.
40D cycle trough: 24 or 27th November.
20W trough: first week of January.
Update:
Same as my other updates this week, major change is needed.
Analysis of the Structure:
We have completed wave (I) of a of 3. Right now, I am expecting wave II which I believe would be a shallow retracement.
Analysis of the Cycles:
The trough of October 26th was the first 40W trough of the current 80W cycle.
40D cycle trough expected on November 27th.
80D cycle trough on the first week of January.
20W FLD suggests a peak that will happen on January 15th.
20W trough expected in the middle of March.
40W FLD target is 215.
40W FLD suggests the peak will happen in March.
40W trough expected in June-July 2024.

AAPL LONGAAPL below 168.30 is attractive again for long. Given a tilt to the upside post September, 168- if holds, provides a nice entry point for riding to the gap closure up higher. Patience is key

AAPL AnalysisPrice played out perfectly according to my last analysis, giving us a +6.83% move to the upside, filling the FVG and reacted nicely at that level to the downside. Right now, I'm expecting a bearish retracement back into the discount level before a continuation to the upside.

AAPL Apple Options Ahead of Earnings If you haven`t sold the Double Top on AAPL:
or reentered here:
Then analyzing the options chain and the chart patterns of AAPL Apple prior to the earnings report this week,
I would consider purchasing the 172.5usd strike price Calls with
an expiration date of 2023-11-17,
for a premium of approximately $5.35.
If these options prove to be profitable prior to the earnings release, I would sell at least half of them.
Looking forward to read your opinion about it.

AAPL W PATTERNNASDAQ:AAPL W PATTERN
I will start trading traditional markets from now on, at the end of the day I like crypto but what I actually like more then crypto is drawing lines and making money with my TA and helping all of my followers make money, all profits will go into crypto lowcaps.

AAPL UPDATENASDAQ:AAPL up 2.35% since my call, what I noticed with legacy markets compared to crypto markets is, ok the patterns and indicators are more powerful in traditional markets compared to crypto because in crypto the opposite ends to happen haha, but in saying that people in traditional markets 3% gains or 12% gain which is the target for the W pattern since my call, is a huge big deal for them.
In Crypto we are using 3% and 12% as our stop losses because its so easy to make 50% in a spot crypto trade and it is also very possible to make 100x on a low cap coin. The R:R is just on a different level, and we are blessed guys, appreciate that we are able to make such crazy gains in the crypto market, study the market, network, make friends, grow yourself first then grow your portfolio, and I guess its good to trade legacy markets here and there to appreciate the gains in crypto :)

Apple Inc (AAPL: NASDAQ)🍏 #StockAnalysis:
Apple's current price stability around $190 is crucial for maintaining a bullish trend. A retest towards $182.37 might precede further bullish momentum. However, a failure to rise and stabilize below $182.37 could signal a more bearish scenario. Traders, stay vigilant! 📉📈
#AAPL #Trading 📊🍎

AAPL forming bullish falling wedge, break will lead price higherAPPLE
price is forming a bullish falling wedge pattern, if price make a bullish break of the wedge and continues to hold above the structure, I expect the price to move higher towards the next resistance..
Trade Wisely
*The content on this analysis is subject to change at any time without notice, and is provided for the sole purpose of assisting traders to make independent investment decisions.

AppleHello friends
In Apple stock, we see a 5-wave pattern
Wave 1, 2, 3 and 4 have been completed
Wave 2 is formed in the form of a zigzag and wave 4 in the form of a triangle, which follows the sequence between waves 2 and 4 according to Elliott's rules.
Wave 3 is usually 1.618 times wave 1, which is also observed and forms an ideal Elliott pattern.
Currently, the share is in wave 5, and according to Elliott's rules, wave 5 is equal to 1.618 of wave 1, so we expect the share price to increase at least to $195, or to $220 for the second goal.
Good luck

Apple - time to start thinking about shortingWe have several confluences in this area that lead me to believe that a short opportunity is unfolding on Apple.
Couple of things...
We have a trendline we have broken through that is grabbing liquidity, we pushed through a high, which was also liquidity. We have broken above the yearly 1 STD dev on the VWAP, and we are at a volume profile node.
NOW....... It is important to understand that there IS a chance that the need for liquidity pushes price to ATH, and then we see the reversal. That is NOT out of the question.
HOWEVER, there IS a good reason to short here. The end of the year is coming. Major players will liquidate a lot of their portfolios and take profit for tax purposes. This is generally a time at end of Q4 where we see a dip of activity, so in theory, this is a good place to short.
If you're thinking about taking a solid position that will protect you in the case of this price point not being the high reversal point, I would suggest taking yearly leap puts. This will theoretically hedge Gamma somewhat. I like to do the 50% rule for strikes price to buy, to give you incentive for being in the money, but enough value to buy those puts relatively cheap since you are buying them far enough out of the money initially.
$178 strike PUTS for MINIMUM 6 months out. So you're looking at 178P 05/24 dated options minimum. To give you a little more comfort, you can go out 8-12 months as well. But it may nip into your profits a bit more.

AAPLAAPL weekly chart Now it is in the adjustment period. It may take quite a long time. It is expected that there is a chance that the price will move within the range of 198.3-155.6
>> GooD Luck 😊
💹 Follow your strategy regarding trading. And there is always risk management.

APPLE BUYBACKSThe previous moves on AAPL is there buybacks only. but We might see 182.34$ to break or test this buyside liquidity, Im expecting downside movement after this move atleast 165.67$ previous low to 157$ for demand grab, only if they still want to buy that zone.
This is not a financial advice, Follow for more.
you may Own it or Trade it.
Trade at your own risk, Invest at your own risk.

AAPL's Overbought Indicators Hint at Possible CorrectionCurrently, Apple Inc. (AAPL) shares are presenting intriguing signals for discerning investors. Two key technical indicators, Stochastic RSI and MACD, provide indications that AAPL may have reached a point of overbought conditions.
Stochastic RSI, serving as a measure of market saturation, highlights AAPL's overbought condition, suggesting that the price has likely reached a level prone to correction or decline. Furthermore, MACD shows negative divergence, indicating the potential weakening of the upward momentum in prices.
It is essential to direct attention to the Support and Resistance level (SNR) around 182.34. This level not only boasts a strong history as a previous resistance level but may also play a significant role as a support level.
However, it is crucial to bear in mind that trading always involves risk, and trading decisions should be based on comprehensive analysis and well-calculated risk assessments.

$AAPL Double Top Pierce Double Top Pierce: The term "Double Top" refers to a technical analysis chart pattern characterized by two consecutive peaks at approximately the same price level, indicating a potential bearish reversal. The term "Pierce" in this context could imply that the price has briefly moved above the second top but failed to sustain that level, reinforcing the bearish outlook of the Double Top pattern.
Taking Profits: Your decision to take some profits following this pattern suggests a strategic move to capitalize on the recent price increase. This is a common practice among traders and investors who aim to lock in gains when they suspect that the stock price might soon decline or enter a consolidation phase after a significant upswing.
The Double Top pattern, especially if it's a "Pierce," suggests that this upward trend might be reaching a potential turning point or at least entering a period of price consolidation.
This analysis points to a cautious approach, where recognizing the Double Top pattern serves as a signal to secure profits from the stock's recent gains. It’s crucial in such scenarios to closely monitor further price action and volume, as these can provide additional clues about the stock’s future direction. Additionally, staying informed about any fundamental changes in the company or broader market conditions is also important, as these can influence stock prices beyond what is indicated by technical patterns.
Apple Let's Have iT !Hi Traders, Sharing daily time frame chart of Apple and key levels marked on provided chart according to my observation.
So as we can see that after a parabolic move from 125 to 195 levels currently price is trading in a falling wedge near to 172 levels these levels coincidentally adjoined with a strong support prior was resistance and with 200 Ema too, if these levels will break and price close below flip zone we can see below marked targets or if price will bounce like earlier it bounced from same spot and break wedge resistance and close above we can see above marked target.
Let's see it will respect 200 EMA and support zone or not.
This is not and trade or investment advice. This idea is meant for learning only.
Best Regards happy trading- Amit


APPLE hitting resistencefrom my subjective opinion APPLE is into heavy resistance. Looks like a good short oportunity by the looks of the TA on my charts, lets see how it plays out. TP zones are on my chart

Apple Regain Bullish MomentumApple Inc (AAPL)
Strong Services Offset China Concerns
Apple's share price has rallied since the release of their recent financial results on 2nd November, despite certain concerns over growth in China.
One key driver behind the rally is the stellar performance of Apple's services segment. The robust growth in services, highlighted by impressive numbers from the App Store, iCloud, and AppleCare, has significantly boosted profits. This success in the services sector has instilled confidence among investors, showcasing Apple's ability to diversify its revenue streams beyond hardware sales.
Additionally, the market is optimistic about Apple's resilience in navigating challenges, particularly in China. Despite a 2.5% decline in revenue from Greater China, CEO Tim Cook's defence of the company's position in this market, emphasising gains in market share during a contracting overall market, has reassured investors.
Furthermore, anticipation surrounding the potential recovery in hardware sales, especially with the release of the iPhone 15, has also played a role in bolstering Apple's share price. While hardware sales faced challenges leading to a 1% revenue dip, investors are eyeing a turnaround with expectations of a rebound in sales, particularly with the launch of the new iPhone model.
Bullish Wedge Breakout Takes Apple Back Above Resistance
Let’s start our technical analysis by looking at the bigger picture on the weekly candle chart (below).
On this higher timeframe we can see that Apple’s recent price action has reignited its long-term uptrend…
During the last week, Apple’s share price has broken out from a descending wedge consolidation pattern which had been in place since the summer. This breakout has also taken prices back above the 2022 highs – indicating that Apple’s long-term uptrend has kicked back into gear.
AAPL Weekly Candle Chart
Past performance is not a reliable indicator of future results
Zooming into the daily candle chart shows that Apple’s recent rally has taken prices towards the top of the Keltner Channel – signalling that prices could be due for a period of mean reversion.
However, given the bullish higher timeframe context, swing traders could potentially use any pullback in Apple’s share price to enter long and rejoin the trend.
AAPL Daily Candle Chart
Past performance is not a reliable indicator of future results
Risk Management:
Apple has an Average True Range (ATR) of $3.17 – traders can use this as a baseline expectation for daily price movement and factor this into to stop placement and price targets.
On the economic calendar, today’s U.S inflation data could increase the volatility of U.S listed stocks like Apple.
Disclaimer: This is for information and learning purposes only. The information provided does not constitute investment advice nor take into account the individual financial circumstances or objectives of any investor. Any information that may be provided relating to past performance is not a reliable indicator of future results or performance.

AAPL Beginning the 5th Wave AAPL is coming out of a bearish falling wedge that was the 4th wave pullback. The breakout is strong, but usually there is a retest. So, look for a retest from the swing high VWAP, which also coincides with the falling wedge breakout area for a continuation to 212.

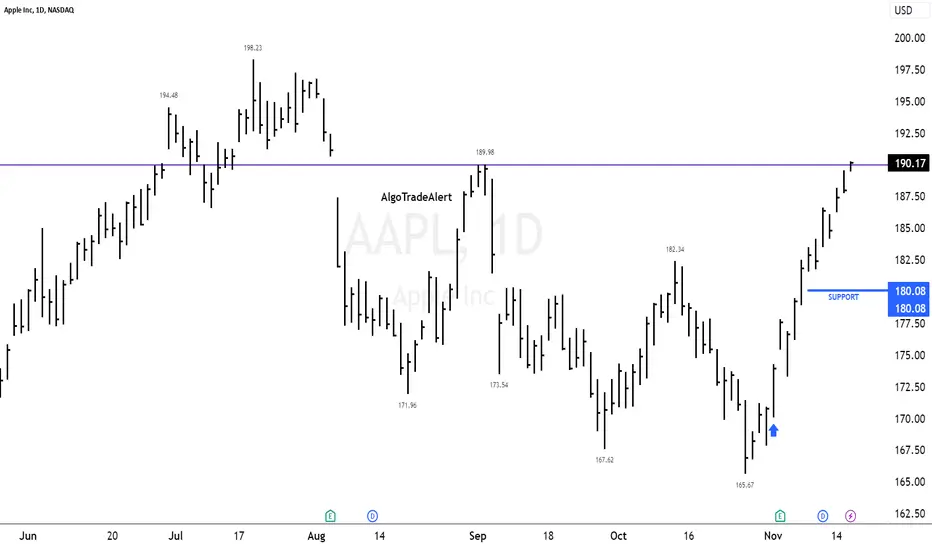
$AAPL Double Top Pierce The current technical analysis of Apple Inc. ( NASDAQ:AAPL ) suggests the stock has undergone a 'Double Top Pierce.' This pattern is significant in technical trading as it could indicate a potential bullish reversal if confirmed. Now, for this pattern to be validated, NASDAQ:AAPL needs to establish itself above the double top line, which in turn becomes a crucial support level.
### Understanding the Double Top Pierce in NASDAQ:AAPL
- **Double Top Formation**: Originally, a double top pattern signifies a bearish reversal, marked by two high points at a similar price level. However, a pierce through this level changes the narrative.
- **Piercing the Top**: NASDAQ:AAPL breaking above the double top line suggests a potential shift in market sentiment or strength in the stock, countering the bearish implications of the original double top.
### Confirmation Above the Double Top Line
- **Becoming Support**: The line which previously acted as resistance in the double top formation is now expected to serve as a support level. This is a common phenomenon in technical analysis, where breached resistance levels transform into support.
- **Confirmation Requirements**: For this transition to be confirmed, NASDAQ:AAPL needs to maintain its position above this line. Traders often look for a clear, sustained close above this level, preferably with accompanying high trading volume for added confirmation.
- **Watch for Retests**: It’s not uncommon for the stock to retest the new support level after breaking above it. A successful retest (where the price bounces back from the support line) would further confirm the strength of the new support.
### Implications for Investors and Traders
- **Bullish Indicator**: If confirmed, this shift could be a bullish indicator for NASDAQ:AAPL , suggesting that the stock may continue its upward trajectory.
- **Entry Points**: For those looking to enter or add to a position, a confirmed support level provides a potential entry point with a clear area for placing stop-loss orders.
- **Continued Monitoring**: As with any technical pattern, it’s crucial to continue monitoring NASDAQ:AAPL ’s price action, especially in relation to this key support level, to gauge the ongoing validity of the pattern.
In conclusion, the observation of a Double Top Pierce in NASDAQ:AAPL introduces a potential bullish scenario. However, the key lies in whether the stock can sustain its position above the double top line, thereby confirming it as a new support level. This development warrants close observation for those trading or investing in Apple Inc. stocks.
