Xlm - Support and resistance & take profitsXlm - Support and resistance & take profits. T1 was hit yesterday, but there is a strong possibility we go lower into T2 (my ideal buy zone- for a short term bounce to green T1).
May the trends be with you.
XLMUSD trade ideas

XLMUSDAccording to my previous analysis that had indicated a massive SELL, we continue to enjoy the movement downwards as we watch out for our ultimate tp to be hit.

XLM Breakout Watch | How Global Markets Are Setting the StageIn this update, I break down XLM’s mid-term outlook and why the $0.65 level is a key breakout zone to confirm further upside. Based on current patterns, I’m targeting a potential move into the $100–$138 range over the mid-term.
While Bitcoin still influences XLM, the backdrop of massive money printing since 2018 has created conditions for meaningful accumulation, setting the stage for higher prices. Add to that an environment of rising interest rates, Fed interventions, and volatility cycles, and it’s clear we’re only at the beginning of what could be a period of outsized returns.
Stellar’s role in a shifting economic system also can’t be ignored. As fiat currencies face structural limits, crypto offers a framework that breaks those shackles, with altcoins like XLM poised to outperform Bitcoin in the next cycle.
Markets will continue to follow their familiar pump-and-dump patterns, but each cycle brings diminishing returns for central bank interventions—leaving room for crypto markets to step in and restore balance.
Stay tuned for the charts and insights that put these patterns into perspective.

XLM - Stellar Lumens - Zero to Hero Chart... $138...After a long silence, I return—not with the same voice you once knew, but with a vision sharpened by time and transformation. Welcome back to AriasWave, where charts are more than technicals—they are echoes of cycles, whispers of the unseen rhythm guiding both markets and empires.
For those gripped by bearish doubt, prepare to enter paralysis… because what I now see is far greater than just XLM’s price action. My eyes have opened beyond M2 money supply, beyond the surface stories of economics, into a deeper current—an unfolding pattern etched into the very fabric of the global system. AriasWave has revealed to me the coming sequence of peaks and troughs, not only in crypto but across the arc of history itself, stretching 20… 30… even 40 years ahead (much more actually).
But first, we must face the shadows. The near term carries darkness, volatility, uncertainty—but hidden within is the seed of renewal. This chart, though only a fragment of a vast fractal structure, is where I begin to share these revelations. It is simple, yes, yet profoundly niche, and it carries the pulse of what is to come.
Step into this journey with me. What lies ahead is not merely analysis—it is prophecy written in waves.
I will explain this target in a video shortly... stay tuned...

XLMUSD about to rise parabolically?Stellar (XLMUSD) has turned sideways since the July 14 High (weekly) but remains supported by its 1W MA50 (blue trend-line). The 8-year pattern is an Ascending Triangle and this recent consolidation resembles a Bull Flag formation.
The very same pattern was seen in October - November 2017, which after holding the 1W MA50, initiated the final parabolic rally of that Cycle that peaked a little above the 1.618 Fibonacci extension.
Attention is needed though as the last 1W Golden Cross was during the last Cycle and led to its Top a few weeks after.
As a result, the confirmation to resume the bullish trend would be a break above the top (Lower Highs trend-line) of the Ascending Triangle and in that case, our Target will be $2.15 (Fib 1.618 ext).
-------------------------------------------------------------------------------
** Please LIKE 👍, FOLLOW ✅, SHARE 🙌 and COMMENT ✍ if you enjoy this idea! Also share your ideas and charts in the comments section below! This is best way to keep it relevant, support us, keep the content here free and allow the idea to reach as many people as possible. **
-------------------------------------------------------------------------------
💸💸💸💸💸💸
👇 👇 👇 👇 👇 👇

XLM/USDT Secondary trend. 14 04 2025Logarithm. Time frame 3 days. After a big pump "with a stick" (so that the "waiters" who want "a little cheaper" would not have time to buy) +8.5X from the accumulation zone of 2.4 years, now a descending wedge is forming on the rollback, similar to 2017. Breaking through its resistance (breaking the downward trend) - the second wave of price growth:
1) through consolidation and sideways movement (cutting the zone, dumping "in waves").
2) aggressive pump as in 2017 "with a stick" and entry into the main distribution zone (late autumn 2025)
The previous idea of the secondary trend was published on 14 01 2024 Exactly when the position was being collected in the horizontal channel in the 4 zones shown, as well as the reversal zone and the percentage of this first strong pump (under XRP).
XLM/USDT Secondary trend. 14 01 2024
XLM/USD Main trend. Timeframe 1 week. Channel. Publication in 2022.
Local wedge breakout zone.

Bullish XLM chart. Deep value buy entriesOverall it looks like a bull flag/ descending wedge, continuation pattern. Really it could keep going up from, especially after jackson hole speech. However, if I was looking for deep value entries, thre green boxes are the two I would buy at.
The first at .39 is the obvious (probably too obvious) entry. Break up from the descending wedge with target the top of the bullish channel.
The more likely and less obvious, due to ai and algorithms doing most of the trading now, they look for max pain and max liquidity, is the lower green box at about .29.
I think it breaks down from the channel to pick up liquidity, does an inverse head and shoulder then a V recovery. Probably happen at 3AM so set limit buys.
Really though, can't go wrong with DCA'ing the infrastructure for the next monetary system. If in doubt, just look at the board of directors and advisors for sdf.
stellar.org
XLM/USD Weekly Chart – Momentum Shift in ProgressStellar Lumens (XLM) is currently navigating a critical zone on the weekly chart. Leveraging a combination of Ultimate Algo Remastered, HuntVolatility_AI, and BSR Extreme Close, we’re seeing early signs of a potential trend development.
Key Highlights:
Momentum Shift detected via – indicating a possible inflection point.
Supertrend (10,3) has flipped, suggesting a shift in directional bias.
Lorentzian Classification and Volatility Hunt AI point to increased market activity and potential breakout conditions.
Multi-timeframe analysis with ATR-based stop loss and monthly resistance levels in play.
Trade Setup:
Target 1: 0.50
Target 2: 0.70
Stop Loss: 0.38 or 0.27
This setup is ideal for traders looking to capitalize on volatility-driven moves in the crypto space. The confluence of signals makes this a chart worth watching closely.
If you have any chart requests, feel free to reach out to me directly.
Follow me for more algorithm-backed setups, crypto insights, and weekly trade ideas.
#XLM #StellarLumens #CryptoTrading #MomentumShift #AlgoTrading #TechnicalAnalysis #TradingView #VolatilityBreakout

Sell OpportunityA clear structure of an M formation is present, an ascending channel with a small M formation before the move downwards. Furthermore, there is a retest with a clear SELL taking shape.
The take profit 1 or the safest take profit would be at 0.354084 and the ultimate or swing trader TP at 0.219893

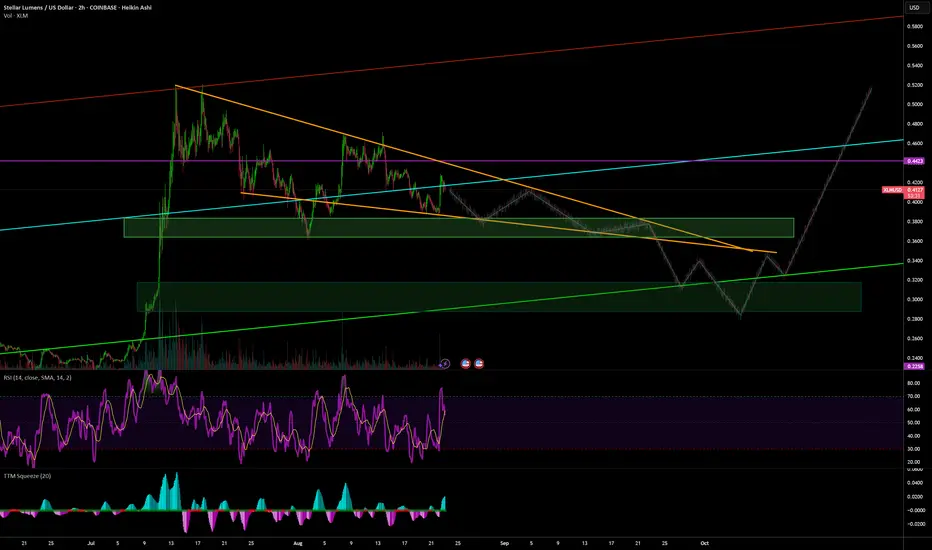
Xlm - More short term upside. Should we be medium term bearish?There is a high probability that Btc will go lower (see my Aug 16 Btc chart). Does that mean alts will too? I hope not, but I need to protect my gains. Being too bulish can get me in trouble, especially if I'm not taking profits.
Being aware of inflection points has proven to be extremely helpful in retaining my gains. If I'm wrong and the asset pumps, that's OK too. Because I have learned that losing out on "potential gains" (FOMO) is NOT the same as losing my capital.
May the trends be with you.

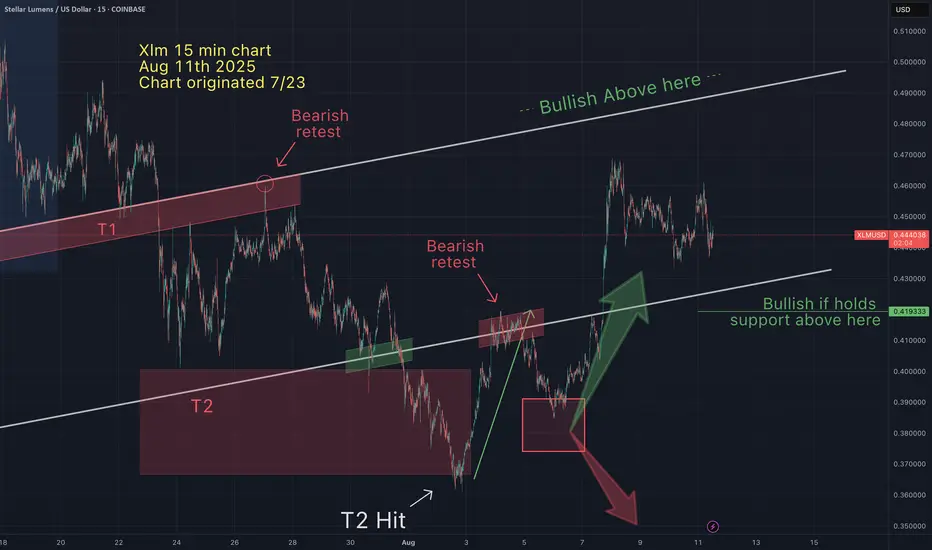
How did I know that Xlm would retrace...then bounce off $0.38?On Aug 5th I suggested that Xlm was apporaching an "inflection point", indicated by my green and red arrows converging at $0.38. See chart below from Aug 5th.
In mathematics an "inflection point" is a point in the curve at which a change in the direction of curvature occurs. These price charts are merely graphs, with coordinates and reoccuring patterns. Anticipating inflection points allow me to determine directionality. Knowing where direction may change allows me to either make quick profitable decisions and/or where to set appropriate stops (invalidation).
TA works!
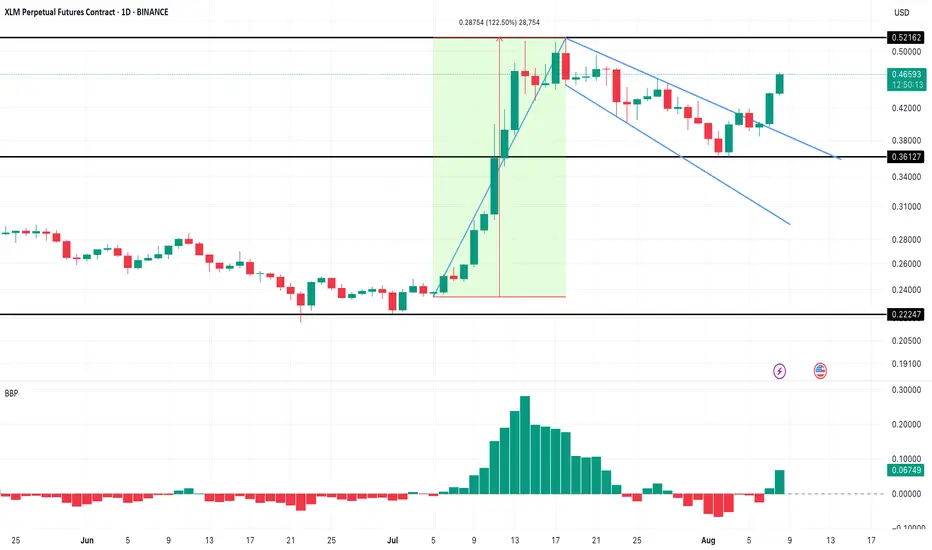
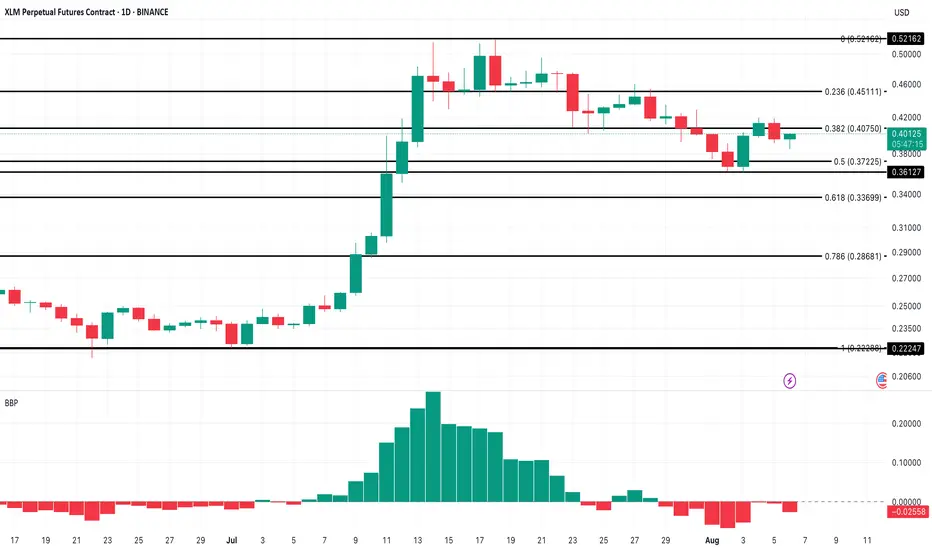
Stellar (XLM) Breaks Out of Bullish Flag: $0.97 in Sight?BINANCE:XLMUSD.P Stellar (XLM) has broken out of a classic pole-and-flag pattern on the daily chart, rallying over 16% in 24 hours. This continuation setup typically leads to further upside, and the measured move from the $0.23–$0.52 pole hints at a potential extension toward $0.97, provided bulls defend current levels.
While the 4-hour triple EMA crossover strengthens the uptrend case, a sharp 1,159% spike in exchange netflows could indicate early profit-taking pressure. This pattern of inflows has historically led to short-term dips. Still, the Bull-Bear Power (BBP) index flipping green adds conviction to the breakout.
Upside targets to watch: $0.52 (swing high) and $0.97 (extension). Invalidation if BINANCE:XLMUSD.P price closes below $0.36.
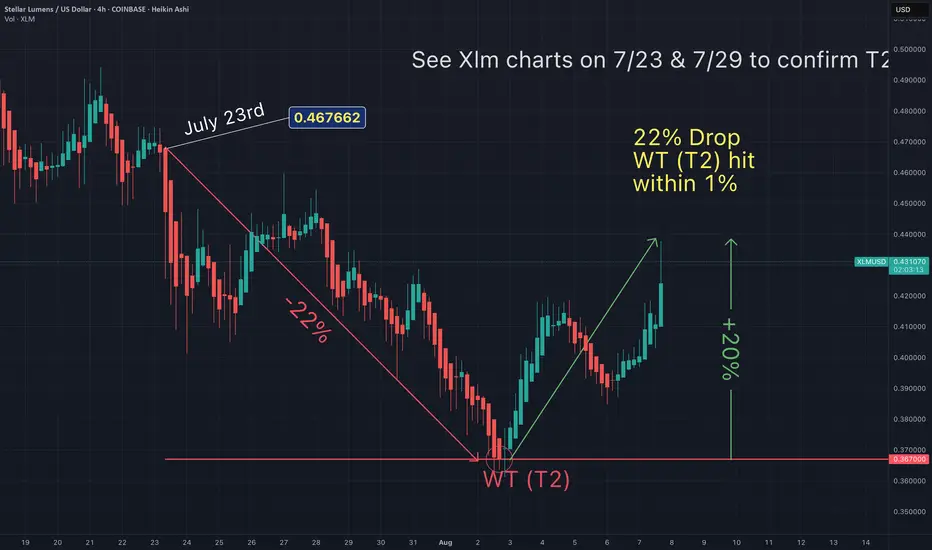
You will ask yourself "how did he know Xlm would do that"?Here's a simplified summary of my prediction made on 7/23 & 7/29 for my ideal entry.
Feel free to review my Xlm charts on those days to confirm.
I keep stats on my accuracy and so should you.
How else would you know what influencer to actually follow?
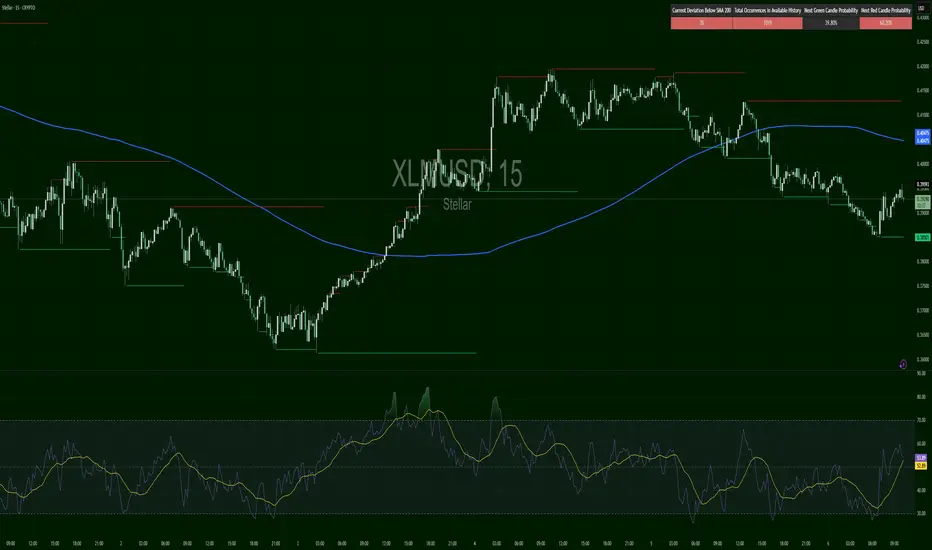
Stellar Price Faces Breakdown Risk as Short-Term Signals Flip BeBINANCE:XLMUSD.P Stellar (XLM) price is starting to flash warning signals as short-term technicals turn bearish. On the 2-hour chart, the 20-period EMA has crossed below the 50-period EMA; commonly referred to as a death crossover. This pattern often suggests a rise in short-term selling momentum, and BINANCE:XLMUSD.P is already trading just above a fragile support level near $0.38.
If $0.37 fails to hold, the next support sits at $0.33, followed by $0.28. The Bull-Bear Power (BBP) index has flipped negative, reflecting a loss of buying strength and increasing control by bears. Price action aligns with this momentum shift, signaling that buyers are struggling to defend key levels.
Sentiment data adds to the cautious outlook. According to Coinglass, 60.67% of traders are holding short positions on $BINANCE:XLMUSD.P. While this high short interest occasionally triggers short squeezes, in the current setup, it reinforces the bearish structure rather than contradicting it.
On the on-chain side, Stellar’s net exchange flows recently turned positive for the first time in two weeks. This suggests that some holders are moving tokens back to exchanges, typically a prelude to selling. For any recovery to be sustained, XLM must reclaim $0.40 and ideally break above $0.52 to shift the broader trend.
XLM/USD – Glow Faded FastStellar had a beautiful rally—until it didn’t. Price lost the $0.4080 key level and sits well below the 200 SMA, confirming a bear-biased market. Current bounce toward $0.3950–$0.4000 is technical and weak, lacking follow-through or strong RSI signals (still under 52). This remains a fade-the-rip setup unless buyers force a structural reclaim above previous supply.
🔴 SHORT bias continues below $0.4080.
🟢 Long only valid if bullish flip + volume returns above 200 SMA.
📊 Keywords: #XLMUSD #FadingMomentum #SMARejection #CryptoBearish #ChartPatterns #BreakdownAlert
Xlm bounce off my T2 confirmed. Is Xlm now going lower to my T3I was hoping for a larger rally after this anticipated bounce off my T2. But if Xlm doesn't hold support above $0.42, I believe Sui is going lower towards my T3.
I will post my T3 target if/when Xlm holds resistance below my recently hit T2.
May the trends be with you.

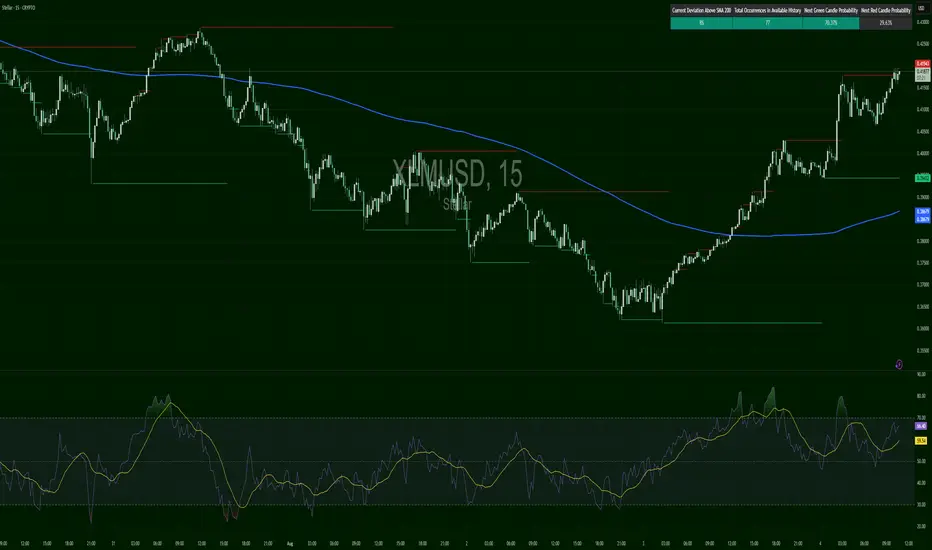
XLMUSD – Ripping Through OrbitBreakout confirmed, with price up to $0.41824, now resting against resistance at $0.41843. RSI is hot at 65+, and the probability model gives a 70% chance of green continuation — the highest among your current tickers.
This is the same fractal for XLM from April 2017.The Fractal from April 2017 is repeating with the November Pump and the recent pump as well.
Next comes a dip and then another pump up to $1

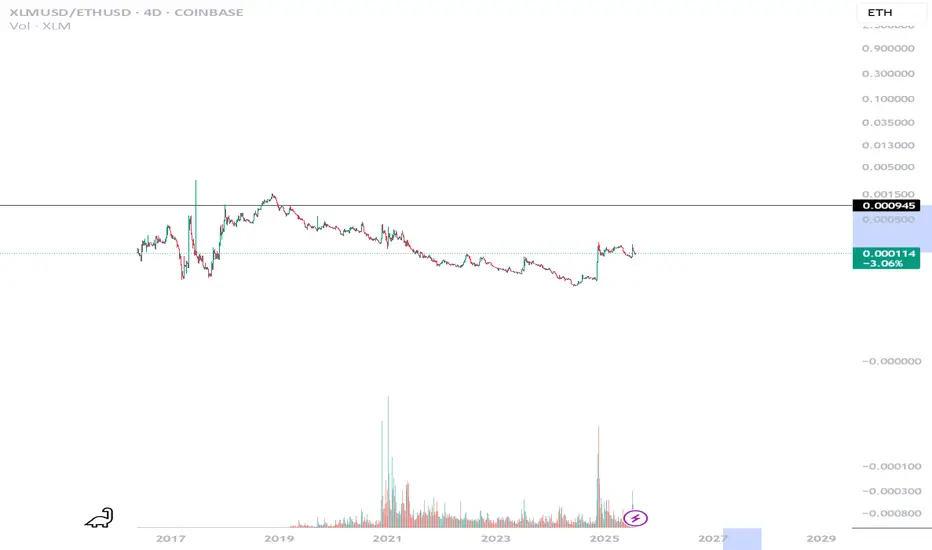
Expect a 730% rally XLM VS ETHThis is a XLM VS ETH Chart, I'm selling for XLM for ETH after XLM runs first expecting 726%
Stellar lumens the most bullish chart in all of crypto $4 soonnuff said, if yall don't see whats happening , you hate money.

Xlm- The wait for Target 2 is over.After a 30% dump. We have arrived.
I hope my T3 doesn't get hit, but if it does, I'll be ready to sweep up the blood in the streets.
May the trends be with you.
XLM To $0.74I'm looking for XLM to continue to the downside followed by a move up. I will place a buy at the 50% fib level or in between the 50% and 61.8.

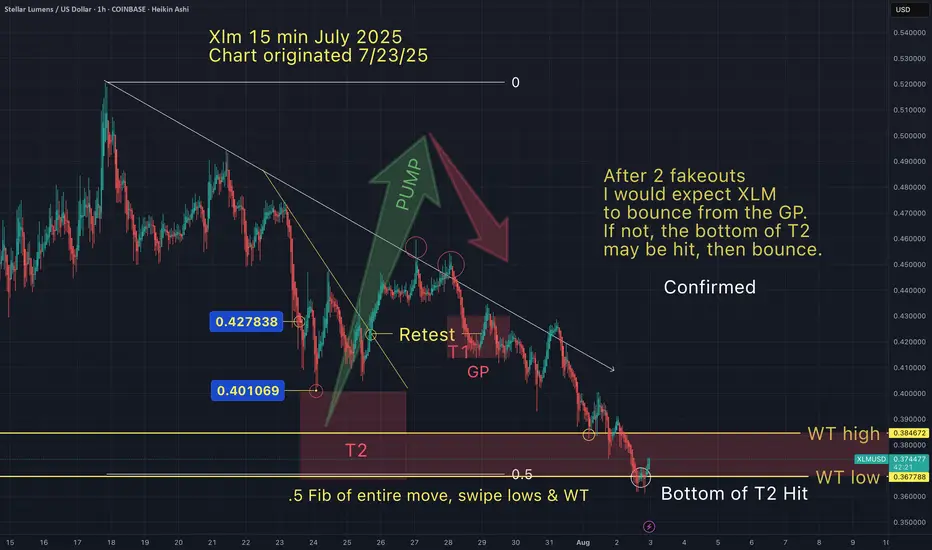
Xlm -Just hit my T2 target7/23- My first post
-Xlm was $.42
7/24- T2 (top of range) hit $.4
7/27-Pumped 15%
as anticipated
8/1 -T2 bottom Hit (WT)
Could go lower and hit WT Low...
But I love it when a plan comes together.
I hope my T3 doesn't get hit (after this bounce).
May the trends be with you.
