XLM: Hidden Accumulation Before a Violent Breakout?Yello, Paradisers do you see what’s happening on Stellar right now? While most eyes are turned away, XLM has been quietly carving a base inside a major demand zone, and the setup looks like it could fuel a massive move soon.
💎After weeks of pressure inside a descending channel, #XLMUSDT finally bro

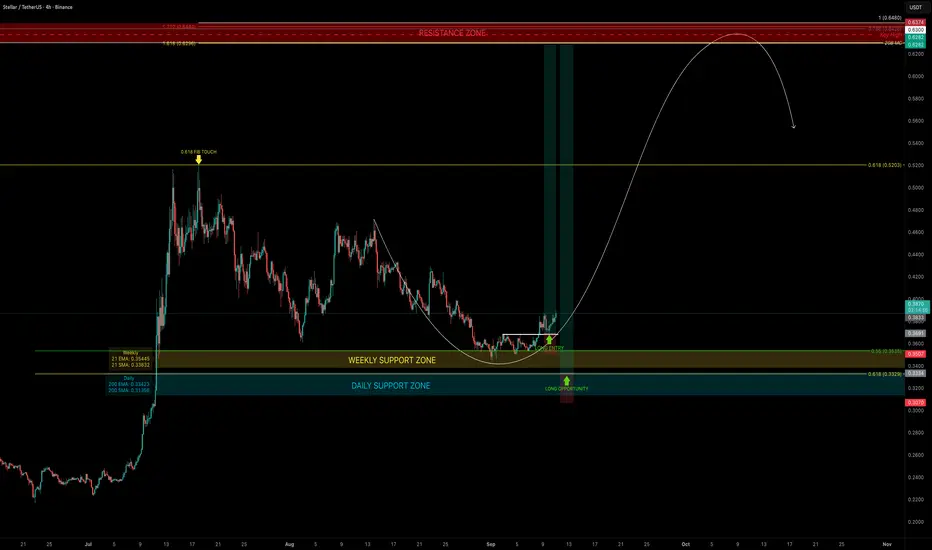
XLM — Correction Ending, Rally Loading?XLM recently found support at the 0.55 Fib retracement, in confluence with the 21 EMA/SMA on the weekly timeframe, triggering a bounce. The ideal 0.618 long entry unfortunately did not come into play.
Support Confluence
21 EMA (weekly): $0.3536
21 SMA (weekly): $0.3384
200 EMA (daily): $0.33
XLM/USD Technical Outlook | Key Levels & Market InsightsDescription:
Stellar (XLM) is a leading blockchain platform designed for fast and low-cost cross-border transactions. Its strong partnerships and active ecosystem support long-term adoption and liquidity.
This analysis provides key technical levels and potential market scenarios based on price act

Stellar Bullish FlagXLM/USDT formed a bullish falling wedge and is now approaching resistance. Breakout confirmation above 0.4161 opens the path to 0.5155, with potential extension to 0.6087. Wait for the breakout and the retest. Stop loss below 0.3425.
Stellar (XLM) Market Outlook — September 02, 2025Sergio Richi Premium ✅
#Stellar CRYPTOCAP:XLM — Market Outlook — September 02, 2025.
Current price : $0.3620
Charts:
Let’s be real: Stellar isn’t just another alt. It’s got actual utility — fast cross-border payments, cheap fees, and big-name partners (Visa, PayPal, MoneyGram, even Teleg

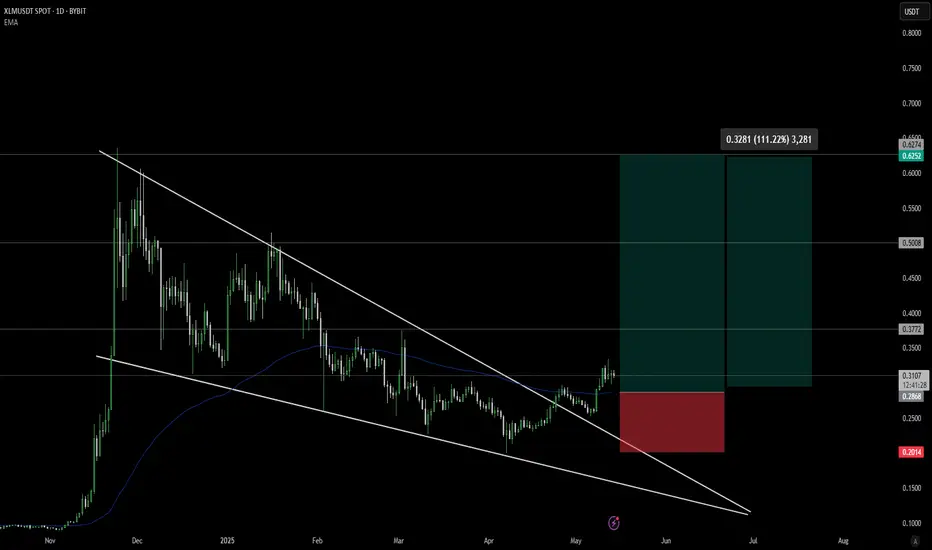
From Compression to Expansion: XLM Eyes 100% Move After BreakoutStellar Lumens BINANCE:XLMUSDT has emerged from a prolonged consolidation within a descending wedge pattern, delivering a potentially bullish breakout on the daily chart. This technical development could mark a significant turning point.
Technical Structure: The Descending Wedge
The descending
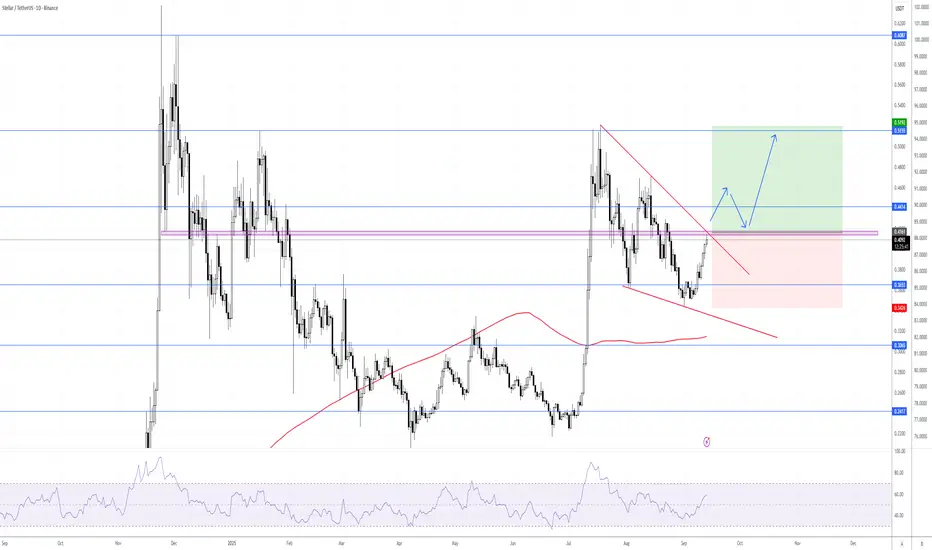
Stellar (XLM): Looking For Market Structure Break | Bullish PlayXLM has successfully filled the CME gap and is now holding above the key zone. From here, our focus shifts to a potential market structure break (MSB).
If buyers keep defending this level, the bounce setup stays valid, and we’ll be looking for continuation higher toward the upper resistance zone. T

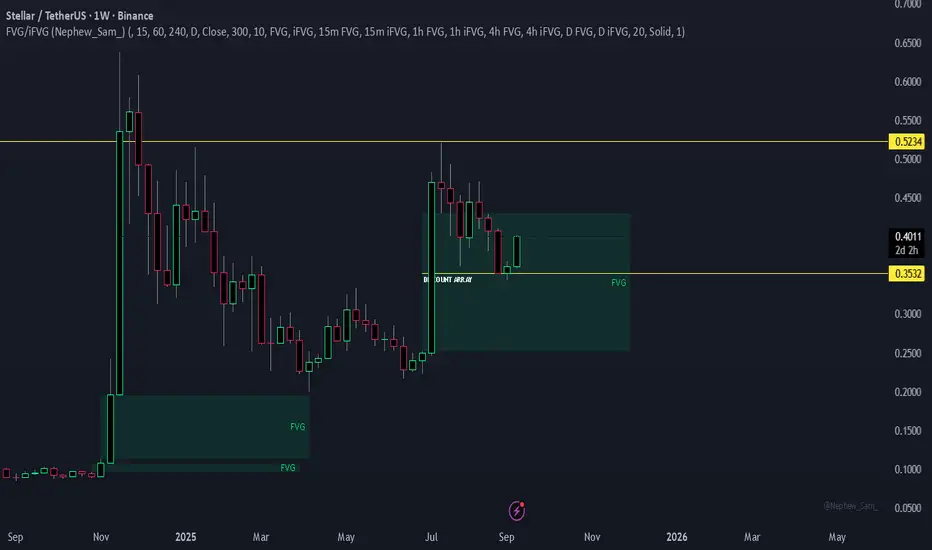
XLM/USDT Weekly Long ViewDISCOUNT ARRAY
Price bounced and respected an internal low after an impressive Breakaway candle that painted a nice WEEKLY FVG. Price seems to have found support and may possibly go higher. A gentle Sweep of the low that failed to create new WEEKLY FVG and instead became the new DISCOUNT ARRAY may i
Expected $XLM Price Drop After $0.407 Peak!This is not a buy or sell recommendation. I expect the price of CRYPTOCAP:XLM to start a downward move with a target of $0.305 after reaching $0.407.
I invite you to check out the outstanding results of my previous analyses.
Thanks.


See all ideas
Summarizing what the indicators are suggesting.
Oscillators
Neutral
SellBuy
Strong sellStrong buy
Strong sellSellNeutralBuyStrong buy
Oscillators
Neutral
SellBuy
Strong sellStrong buy
Strong sellSellNeutralBuyStrong buy
Summary
Neutral
SellBuy
Strong sellStrong buy
Strong sellSellNeutralBuyStrong buy
Summary
Neutral
SellBuy
Strong sellStrong buy
Strong sellSellNeutralBuyStrong buy
Summary
Neutral
SellBuy
Strong sellStrong buy
Strong sellSellNeutralBuyStrong buy
Moving Averages
Neutral
SellBuy
Strong sellStrong buy
Strong sellSellNeutralBuyStrong buy
Moving Averages
Neutral
SellBuy
Strong sellStrong buy
Strong sellSellNeutralBuyStrong buy
Displays a symbol's price movements over previous years to identify recurring trends.