From Compression to Expansion: XLM Eyes 100% Move After BreakoutStellar Lumens BINANCE:XLMUSDT has emerged from a prolonged consolidation within a descending wedge pattern, delivering a potentially bullish breakout on the daily chart. This technical development could mark a significant turning point.
Technical Structure: The Descending Wedge
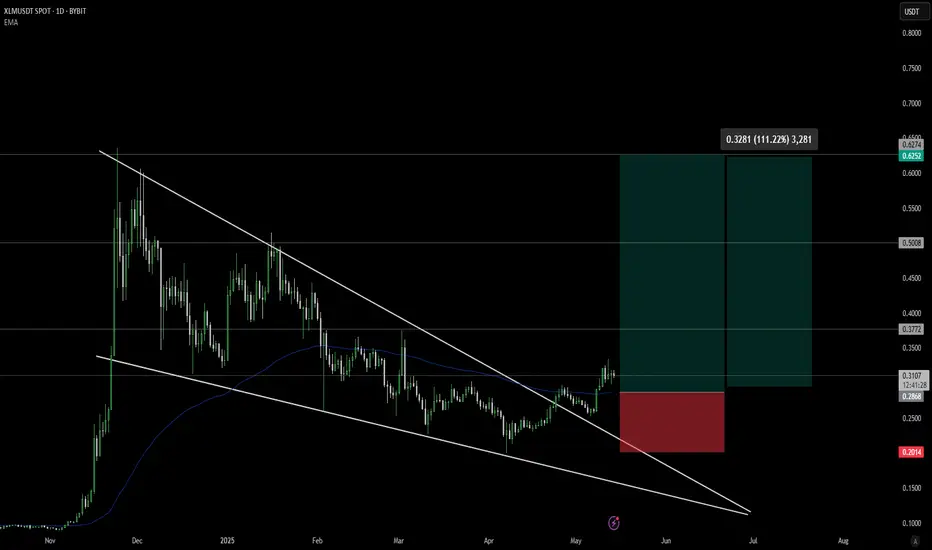
The descending wedge is a bullish reversal pattern that forms when the price action creates lower highs and lower lows within two converging trendlines. Since late 2024, XLM has traded within such a structure, slowly compressing in volatility as the apex of the wedge approached. This formation reflects a decline in bearish momentum and hints at an eventual upward resolution, precisely what occurred in early May 2025.
The breakout above the upper trendline of the wedge is a significant technical signal, suggesting a shift from distribution to accumulation. Breakouts from descending wedges often lead to sharp, directional moves as sidelined buyers regain confidence.
EMA Confluence and Confirmation:
Adding strength to this setup is the reclaim of the 100-day EMA, currently sitting around $0.2872. The EMA had acted as dynamic resistance during the wedge formation, with multiple failed breakout attempts earlier this year. The successful break and hold above this level now signal a potential trend reversal, reinforcing the bullish breakout.
The price is currently consolidating above the 100 EMA, creating a new base of support. If this level holds, it could serve as a launchpad for further upside movement in the days and weeks ahead.
Key Levels and Trade Context:
Immediate resistance lies at $0.3772, which aligns with previous structure highs and horizontal supply zones. Beyond this, higher resistance targets are marked at $0.5008 and $0.6252—each corresponding to major levels from prior cycles.
On the downside, the invalidation point sits clearly below the wedge and the EMA at $0.2014. This makes risk management straightforward for traders, with stops logically placed beneath this key level. The defined support zone gives the trade setup a favorable risk-to-reward profile, offering more than 2:1 reward relative to risk if targeting the first resistance alone.
Pattern Implications and Measured Move:
The measured move from a descending wedge is typically equal to the maximum height of the pattern, added to the breakout point. Based on this metric, a breakout from the $0.31 zone could yield a target close to or even above the $0.60 level, aligning with historical resistance.
This makes the potential upside around 100% or more from current levels, highlighting the value of participating in such early trend reversals when confirmed by multiple technical factors.
Educational Takeaway:
This setup provides an excellent educational case study for traders seeking to improve their pattern recognition skills. The descending wedge is one of the more reliable reversal patterns, especially when paired with additional confirmation such as EMA reclaim, strong volume surges, or bullish candlestick structure at the breakout point.
Understanding the importance of confirmation—rather than anticipation—can greatly improve trade outcomes. This chart also illustrates how structure, trend, and timing come together to create asymmetric opportunities in the crypto market.
Conclusion:
The breakout in XLM/USDT marks a decisive shift in market structure and momentum. The combination of descending wedge resolution, 100 EMA reclaim, and a clearly defined trade setup makes this chart technically attractive. Traders should monitor continuation patterns and volume closely to gauge the strength of the trend, while investors may consider this a signal that the longer-term bottom could be forming.
As market sentiment across altcoins improves, CRYPTOCAP:XLM 's current technical posture positions it as a prime candidate for outsized gains. Whether you're actively trading or looking for longer-term entries, XLM deserves a spot on your watchlist in the weeks ahead.
XLMUST.P trade ideas
Stellar (XLM): Looking For Market Structure Break | Bullish PlayXLM has successfully filled the CME gap and is now holding above the key zone. From here, our focus shifts to a potential market structure break (MSB).
If buyers keep defending this level, the bounce setup stays valid, and we’ll be looking for continuation higher toward the upper resistance zone. This area will give us the next strong reaction and confirm whether buyers can sustain momentum.
Swallow Academy

Long XLMBTC is bouncing from a strong support.
XLM would have another leg up from the local support trendline.
Trade setup is as in chart.

XLM/USDT — Descending Triangle at a Key Fibonacci Zone!🔎 Market Overview
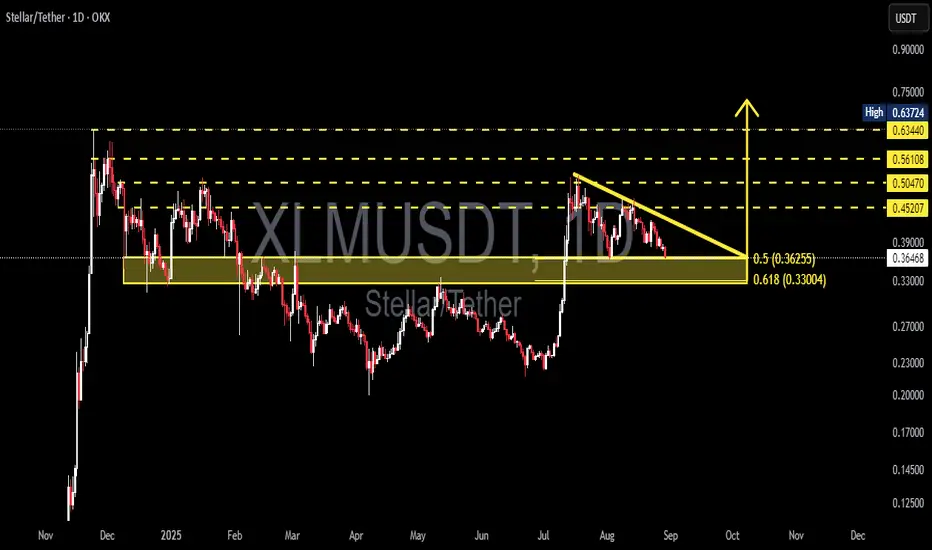
Currently, XLM/USDT (Daily, OKX) is trading around 0.3645, testing the golden support zone between 0.3625 (0.5 Fib) and 0.3300 (0.618 Fib).
This area is highly significant because:
It has acted as a historical demand zone, repeatedly holding the price.
It aligns with the Fibonacci golden pocket (0.5 & 0.618 levels), often watched by institutional traders.
Price action forms a descending triangle, where sellers create consistent lower highs while buyers defend a horizontal floor.
In short, we are at a make-or-break decision point: will XLM break down further, or will buyers trigger a strong breakout against the classic bearish setup?
---
📐 Structure & Technical Context
Pattern: Descending Triangle → statistically bearish continuation, but strong support zones often trigger bullish fakeouts.
Lower Highs: indicate steady selling pressure.
Horizontal Support: strong cluster around 0.33 – 0.3625, coinciding with golden pocket Fib levels.
Key Resistances Above:
0.4520
0.5047
0.5610
0.6340 – 0.6370 (major supply zone).
A breakout above could flip the triangle into a bear trap and spark a mid-term rally.
---
🚀 Bullish Scenario
Main condition: price must break above the descending trendline with a convincing daily close + high volume.
Conservative entry: wait for breakout + retest (price breaks the trendline, then retests as support).
Upside Targets:
TP1 = 0.4520
TP2 = 0.5047
TP3 = 0.5610
TP4 = 0.6340 – 0.6370 (major resistance zone).
Invalidation: daily close below 0.33 (breakdown confirmed).
📊 Example Risk/Reward:
Entry = 0.3645
Stop = 0.33
TP1 = 0.4520
→ Risk = 0.0345 | Reward = 0.0875 → R:R ≈ 2.5 : 1
---
🩸 Bearish Scenario
If support breaks:
Trigger: daily close < 0.33 (0.618 Fib).
Downside Targets:
First = 0.27
Next = 0.23
Extended = 0.17 (historical swing low).
Strategy: short on breakdown + retest (support turned resistance).
Invalidation: price reclaims trendline & closes above 0.4520.
---
📊 Trading Plan Summary
The 0.33–0.3625 zone is the golden decision point:
Holding → potential bullish rally.
Breaking → deeper bearish continuation.
The descending triangle clearly shows where pressure is building.
Always manage risk tightly, as this pattern often creates false breakouts before the real move.
---
XLM is sitting at a critical crossroads. A descending triangle has formed exactly on the golden pocket Fibonacci (0.33–0.3625). A breakout could trigger upside targets at 0.45 / 0.50 / 0.56, while a breakdown could lead to 0.27 / 0.23. Wait for daily close + volume confirmation. This golden zone will decide XLM’s next big move.
#XLM #Stellar #XLMUSDT #CryptoAnalysis #Altcoin #DescendingTriangle #SupportResistance #Fibonacci #Breakout #BearishOrBullish #SwingTrade
Stellar (XLM): We Will Fall a Little Bit More | Overall BullishXLM seems weak, and the price is looking for any zone of support from which to bounce. We are expecting to see a further downside movement here until the $0.36-0.37 mark, where we will be looking for any kind of reversal or form of MSB.
Once we see signs of a market structure break and trend reversal there, this would be our buy entry for Stellar!
Swallow Academy

XLM/USD – Technical OutlookDaily Chart
• Price leaning on 50-day EMA (critical support).
• Holding → could evolve into symmetrical triangle → bullish breakout potential.
• Breakdown → targets $0.35 (confluence of liquidity zone + 200-day EMA).
• Indicators: RSI < 50 (weak momentum), MACD negative.
• Bias: Neutral, dependent on BTC trend.
4H Chart
• Price broke below 50 EMA & 200 EMA → now resistance.
• Rejection at retest = confirms bearish structure.
• Relief signs: RSI oversold, MACD negative momentum fading → possible short-term bounce.
• Bullish condition: reclaim 50 & 200 EMA as support.
• Bearish condition: failure = continued downside toward $0.35.
Key Levels
• Resistance: $0.39 / $0.42
• Support: $0.35 / $0.32


XLM/USDT - Bullish Momentum Gaining Strength🚀 Trade Setup Details:
🕯 #XLM/USDT 🔼 Buy | Long 🔼
⌛️ TimeFrame: 1D
--------------------
🛡 Risk Management (Example):
🛡 Based on $10,000 Balance
🛡 Loss-Limit: 1% (Conservative)
🛡 The Signal Margin: $375.52
--------------------
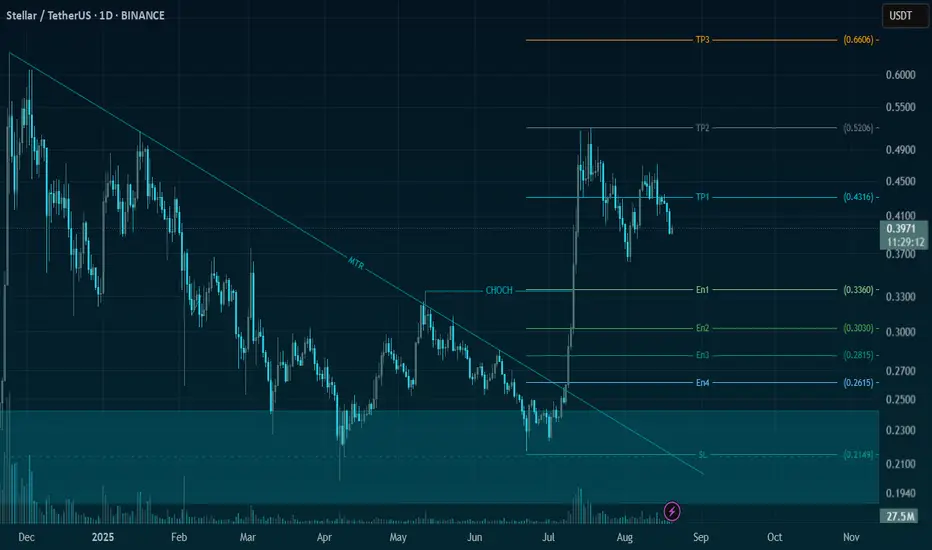
☄️ En1: 0.336 (Amount: $37.55)
☄️ En2: 0.303 (Amount: $131.43)
☄️ En3: 0.2815 (Amount: $168.98)
☄️ En4: 0.2615 (Amount: $37.55)
--------------------
☄️ If All Entries Are Activated, Then:
☄️ Average.En: 0.2929 ($375.52)
--------------------
☑️ TP1: 0.4316 (+47.35%) (RR:1.78)
☑️ TP2: 0.5206 (+77.74%) (RR:2.92)
☑️ TP3: 0.6607 (+125.57%) (RR:4.72)
☑️ TP4: 0.8946 (+205.43%) (RR:7.71)
☑️ TP5: 1.2501 (+326.8%) (RR:12.27)
☑️ TP6: Open 🔝
--------------------
❌ SL: 0.2149 (-26.63%) (-$100)
--------------------
💯 Maximum.Lev: 2X
⌛️ Trading Type: Swing Trading
‼️ Signal Risk: 🙂 Low-Risk! 🙂
🔎 Technical Analysis Breakdown:
This technical analysis is based on Price Action, Elliott waves, SMC (Smart Money Concepts), and ICT (Inner Circle Trader) concepts. All entry points, Target Points, and Stop Losses are calculated using professional mathematical formulas. As a result, you can have an optimal trade setup based on great risk management.
📊 Sentiment & Market Context:
Stellar (XLM) is showing strong bullish momentum amid a growing demand for scalable, fast cross-border payment solutions. With the expanding adoption of Stellar’s blockchain technology in financial institutions and partnerships driving real-world use cases, market sentiment is turning increasingly optimistic. This fundamental strength combined with solid technical setups makes XLM/USDT a compelling long opportunity.
⚠️ Disclaimer:
Trading involves significant risk, and past performance does not guarantee future results. This analysis is for informational purposes only and should not be considered financial advice. Always conduct your research and trade responsibly.
💡 Stay Updated:
Like this technical analysis? Follow me for more in-depth insights, technical setups, and market updates. Let's trade smarter together!
TradeCityPro | XLM: Key Support Holding Amid Seller Pressure👋 Welcome to TradeCity Pro!
In this analysis, I want to review the XLM coin for you. It is one of the RWA projects with a market cap of $12.76 billion, currently ranked 13th on CoinMarketCap.
📅 Daily Timeframe
In the daily timeframe, this coin has reached a Maker Seller zone. So far, it has tested this zone twice and has been rejected both times.
🔍 In the second rejection, a lower high was formed, which shows weakness in the bearish trend. There is an important support level at 0.3629, and as long as the price remains above this level, the trend of this coin will stay bullish.
⚡️ If 0.3629 is broken, a deeper correction could extend to 0.3142. If the price continues to drop further, the main support of XLM will be around the 0.2244 zone.
✔️ However, if the price does not break below the 0.3629 level, I will try to open a long position with a breakout above the zone, because this level is very important, and its breakout could start a new bullish trend.
💥 The breakout trigger for this zone is currently at 0.4896, but in lower timeframes, we can find better triggers when the price reaches this level.
🔽 For a short position, we can open one if 0.3629 is broken, but for now, I will not open a short position, and if I take long positions, I prefer to do so on other coins instead of XLM.
📝 Final Thoughts
Stay calm, trade wisely, and let's capture the market's best opportunities!
This analysis reflects our opinions and is not financial advice.
Share your thoughts in the comments, and don’t forget to share this analysis with your friends! ❤️

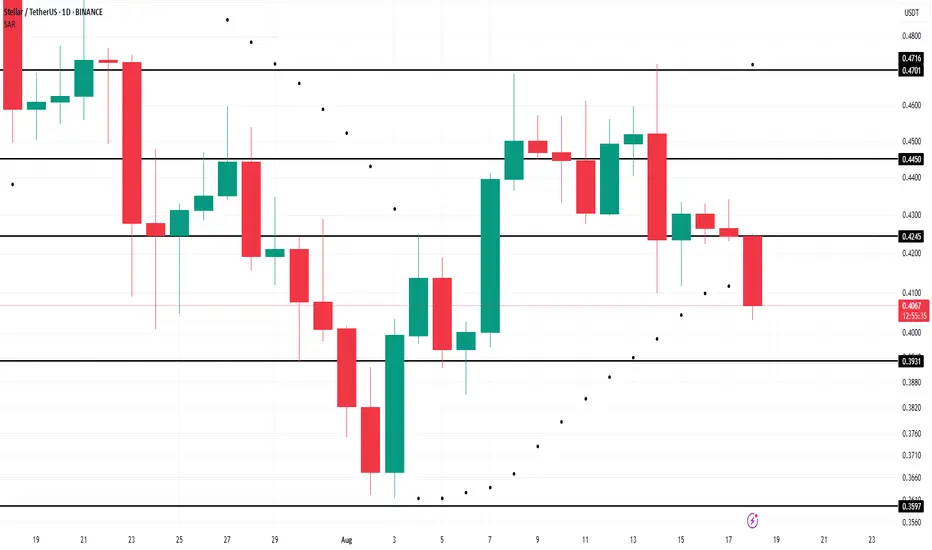
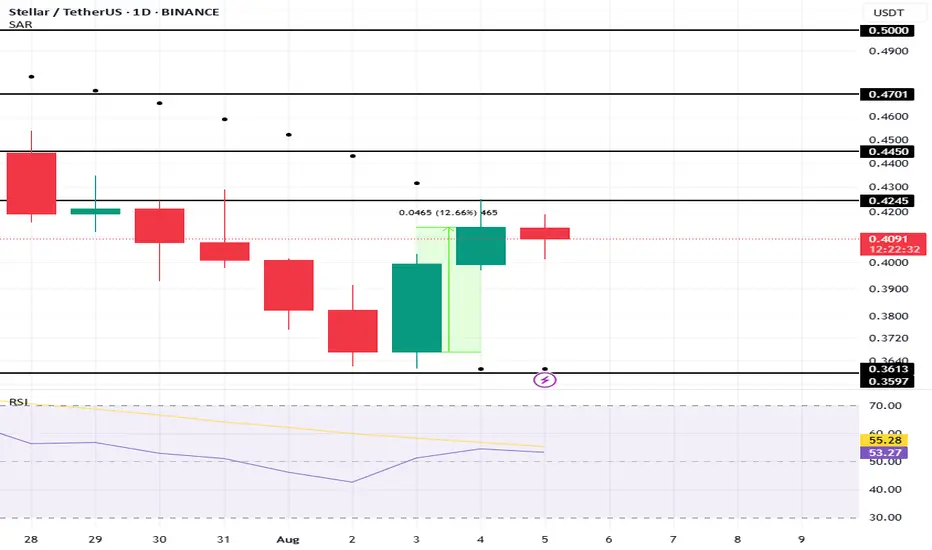
Stellar Falls To $0.40; But Parabolic SAR Flags Deeper DeclineAt the time of writing , BINANCE:XLMUSDT trades at $0.409 and faces a risk of slipping lower. Technical factors point to a potential drop toward $0.393 support, a level that may determine whether bearish control continues to strengthen in the coming sessions.
From a technical perspective, BINANCE:XLMUSDT momentum is leaning bearish . The Moving Average Convergence Divergence (MACD) indicator has confirmed a bearish crossover, signaling growing downside pressure. The crossover reflects weakening strength among buyers and indicates a market environment increasingly favorable for sellers.
Adding to the concern, the Parabolic SAR indicator is positioned above candlesticks, acting as resistance. This placement confirms a downtrend, suggesting BINANCE:XLMUSDT could face additional declines. If bearish sentiment dominates, the cryptocurrency might even test deeper support near $0.359, worsening investor confidence further.
However, if traders shift toward a bullish stance, Stellar has recovery potential. Reclaiming $0.424 as support could allow BINANCE:XLMUSDT to climb toward $0.445. Achieving this move would negate the bearish outlook, signaling renewed strength and stabilizing the asset after recent declines.
XLMUSDT → Consolidation before rally to 0.4700BINANCE:XLMUSDT is recovering after a fairly aggressive decline, the purpose of which was to consolidate potential and retest trend support. The chart shows signs of a bullish movement...
The growth of BTC and ETH and the decline in Bitcoin's dominance index give altcoins a chance. The market is generally bullish, and in the second half of this week, we encountered a correction that has most likely come to an end. XLM has a fairly strong support line, above which the bulls are aggressively holding the price.
XLM is rebounding from the upward support line. The price returned to the trading range of 0.4274 - 0.4685, but encountered strong resistance at 0.4331, a break of which will confirm the bullish market structure. An ascending triangle is forming with a trigger at 0.4331.
Support levels: 0.4273, 0.4194, 0.4114
Resistance levels: 0.4331, 0.4596, 0.4685
Within the local “ascending triangle” structure, the price may continue to consolidate. A retest of local support zones is possible. However, a smooth compression of the price towards resistance may lead to a breakout, which in turn, due to consolidation, may provoke a strong upward momentum.
Best regards, R. Linda!

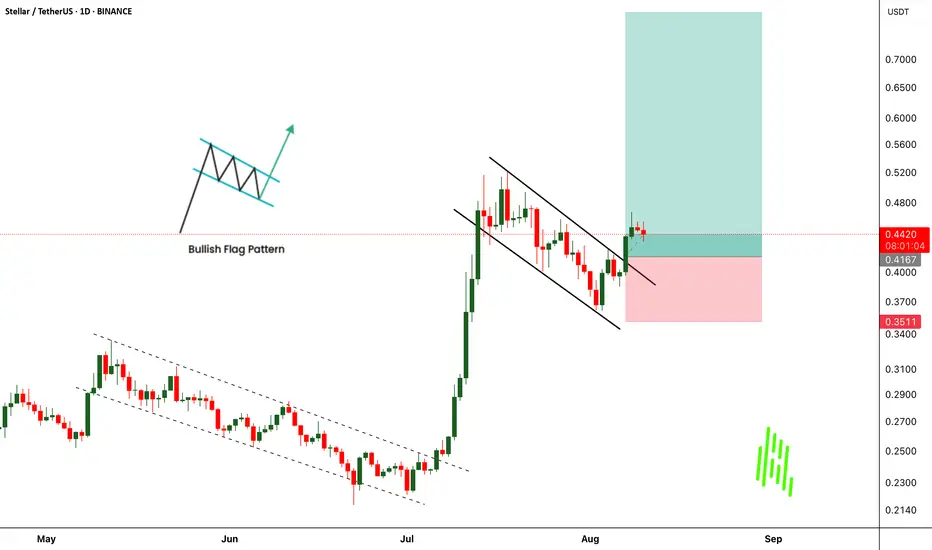
XLMUSDTBullish flag pattern showing up.
This bullish setup make your targets your stoploss is your responsibility.

XLM - Trading PlanBINANCE:XLMUSDT Price is trading above the monthly pivot and pushing higher. I expect a local pullback to the moving averages ; after confirmation, I’ll look for long entries.
Plan: 🔄
• Entry: after a clean retest/hold of MAs
• TP1 : R2 at 0.5655 🎯
• TP2 : R3 at 0.6792

XLMUADT Ready for Another Moonshot After Bullish Flag Breakout!$XLMUADT has just broken out of a well-formed bullish flag pattern, signaling the potential start of a strong upward move. This comes after its earlier breakout from a rising channel, which delivered impressive gains to traders who caught the move. The current breakout setup mirrors that previous rally, and if history repeats, we could be looking at another powerful uptrend in the making.
With momentum building and technicals aligning, buyers seem to be taking control again. However, as always, risk management is key, keep a strict stop loss in place to protect capital and lock in profits as the move unfolds. The market has already shown us what CRYPTOCAP:XLM can do, and this breakout might just be the next big opportunity.
$XLMUADT Currently trading at $0.44
Buy level : Above $0.415
Stop loss : Below $0.35
Target 1: $0.522
Target 2: $0.6
Target 3: $0.8
Max leverage 5x
Always keep stop loss
Follow Our Tradingview Account for More Technical Analysis Updates, | Like, Share and Comment Your thoughts
XLM Price holding multi-TF Bull FVGCRYPTOCAP:XLM is trading inside a multi-timeframe Bullish FVG cluster (0.40 – 0.4368) with confluence from 1W, 1D, and 4H charts. Price is holding above POI that previously triggered bullish continuation.
Bullish scenario (#long):
Accumulate within 0.42 – 0.41 zone.
Breakout above 4H Sell FVG (0.44 – 0.46) confirms upside momentum.
Progressive take-profits: 0.5206 → 0.5606 → 0.6081 → final at 0.6374.
Bearish scenario / Invalidation:
Breakdown and close below 0.41 shifts bias to bearish, opening path to deeper retrace toward 0.36 and potentially re-testing lower 1W Bull FVG levels.
Trading plan:
Entry: 50% at 0.42, 50% at 0.41.
Stop Loss: Below 0.41.
Take Profits: As per targets above.
Bias: Bullish while price remains above 0.41.

XLMUSDT LONGSee that we having a great pump with the alt coins and ETH leading the heard I think we have a great opportunity for a long trade on Stellar if we break the small bull flag to the upside see that it has not yet been performing as much as other coins. Please feel free to give any input or leave a comment.

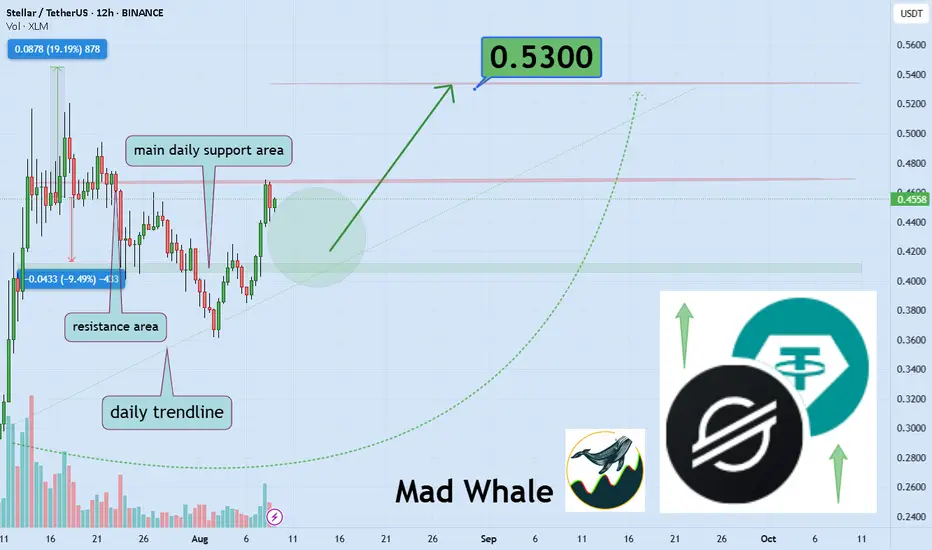
Stellar’s Daily Support Could Trigger 19% Move To $0.53Hello✌️
Let’s analyze Stellar’s price action both technically and fundamentally 📈.
🔍Fundamental analysis:
Stellar’s Protocol 23 upgrade adds Soroban smart contracts and faster transactions, aiming for 5,000 TPS to compete with Ethereum in DeFi. 🚀
📊Technical analysis:
BINANCE:XLMUSDT is holding key Fibonacci levels near strong daily support and a solid trendline. If this area remains intact, a 19% rally toward $0.53 is likely.📈✨
✨We put love into every post!
Your support inspires us 💛 Drop a comment we’d love to hear from you! Thanks, Mad Whale
Stellar (XLM): Proper Break of Structure (BoS) | Bullish We had a clean breakout on the XLM coin where the price did form the Break of Structure, and now we are aiming for that resistance zone near $0.50.
Even that zone is not the final stop for us; we look for that major target zone (which is major resistance on a bigger timeframe) to be reached!
Swallow Academy

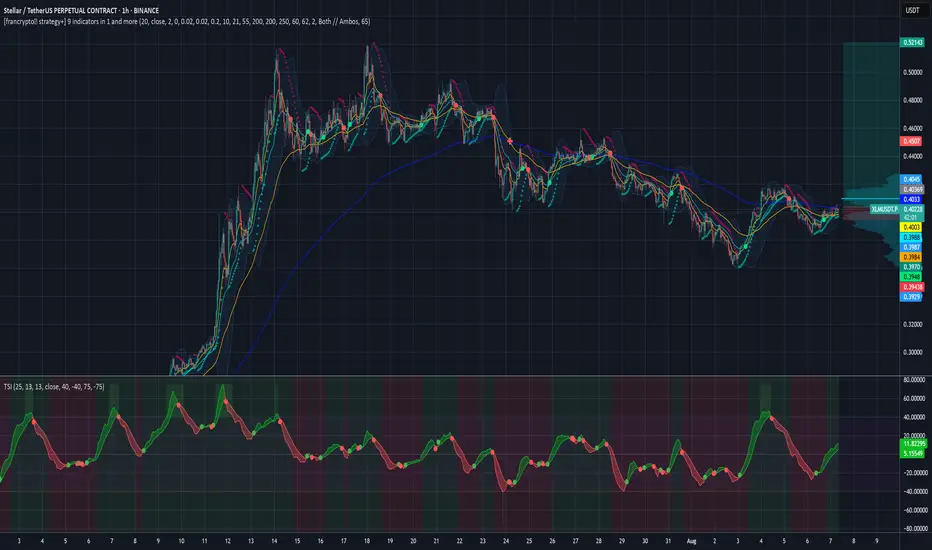
Bullish on XLMUSDTStellar / XLM turns bullish again, retracement is over. We have an EMA cross, we have passed an high volume node and now we try to move above EMA200. As soon as we manage to stay above we will head for the targets around 0.46$ and 0.52$.
For more trade ideas check and insights check our profile.
Disclamer: only entertaining purpose, no financial advice - trading is risky.
Stellar (XML) Price Ends 2-Week Downtrend As Inflows SpikeBINANCE:XLMUSDT price is currently trading at $0.41 1, just under the resistance level of $0.424. Breaking this resistance will be key for XLM to recover the recent losses and continue its upward trajectory. The Parabolic SAR moving below the candlesticks after two weeks signals that the downtrend is coming to an end.
Ethereum’s technical indicators also suggest a return to bullish momentum. The Relative Strength Index (RSI) has moved back into the positive zone, above the neutral 50.0 mark, after briefly dipping into bearish territory. This reversal from the prior downtrend shows that BINANCE:XLMUSDT is regaining strength.
The RSI indicates that investor sentiment is improving . The brief period of bearishness was likely caused by broader market uncertainty and skepticism. However, with the RSI back in the positive range, the likelihood of further price increases has increased.
If Stellar can flip $0.424 into support , it could pave the way for a rise past $0.445 and possibly reach $0.470 . This would allow BINANCE:XLMUSDT to recover a significant portion of the losses it sustained over the past two weeks and continue its uptrend.
However, if broader market conditions fail to remain bullish and investor sentiment turns negative, BINANCE:XLMUSDT could face a decline. A failure to maintain support at $0.424 could lead XLM to drop to $0.393 , with further bearish momentum pushing the price to $0.359, invalidating the bullish outlook.
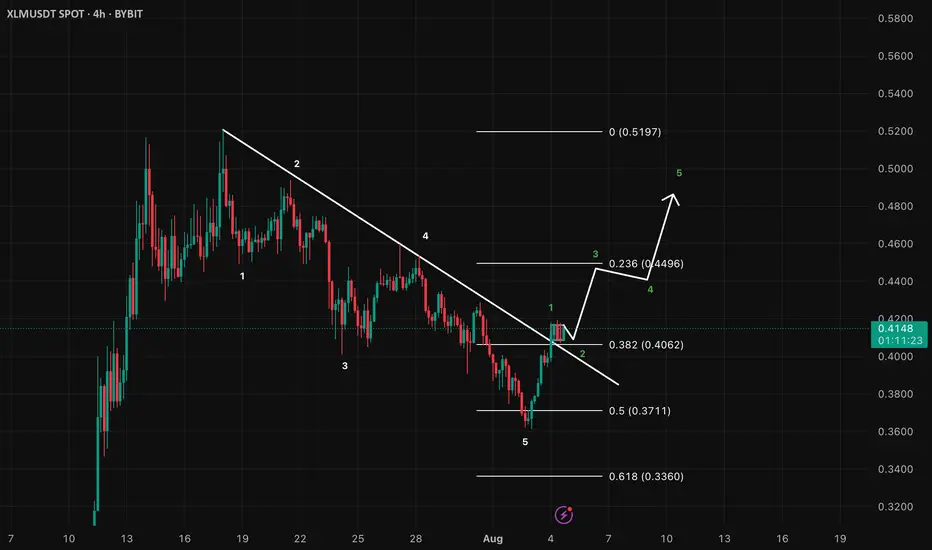
XLMUSD LongWe´ve completed a 5wave corrective structure and just started another bullish 5wave structure.
I expect a correction on lower timeframe to confirm the end of the 1st wave and will enter Long trade at the breakout
Stellar (XLM) Shoot Up 11%, Aims To Cross This Barrier
BINANCE:XLMUSDT price has increased by 11% over the last 24 hours , positioning it among the top-performing altcoins. Trading at $0.4077 , the altcoin remains under the resistance of $0.4245. This indicates potential for a breakout if broader market conditions stay favorable and support the bullish trend.
The 50-day exponential moving average (EMA) provides strong support, signaling that the broader market momentum is bullish. This support could propel BINANCE:XLMUSDT towards $0.4450 , with further gains potentially pushing it to $0.4701, confirming the continuation of its positive trajectory in the market if conditions remain favorable.
However, if market conditions worsen , especially with the upcoming August 7 announcements, XLM might fail to breach $0.4245 . In this case, the price could fall to $0.3597 , and losing this support would invalidate the bullish outlook for BINANCE:XLMUSDT , signaling potential downside risks in the coming days.

