Stellar Eyes 22% Rally From Support Toward 0.44$Hello✌️
Let’s analyze Stellar’s price action both technically and fundamentally 📈.
🔍Fundamental analysis:
XLM just got its first U.S.-regulated ETF exposure with a small 0.3% share. It adds legitimacy, but big upside likely needs larger future ETFs.
📊Technical analysis:
BINANCE:XLMUSDT is approaching a key daily support and a trusted trendline, holding which could set up a 22% rally toward 0.44$. Traders should watch this level closely for a potential bounce. 📈🔍
📈Using My Analysis to Open Your Position:
You can use my fundamental and technical insights along with the chart. The red and green arrows on the left help you set entry, take-profit, and stop-loss levels, serving as clear signals for your trades.⚡️ Also, please review the TradingView disclaimer carefully.🛡
✨We put love into every post!
Your support inspires us 💛 Drop a comment we’d love to hear from you! Thanks, Mad Whale
Trade ideas

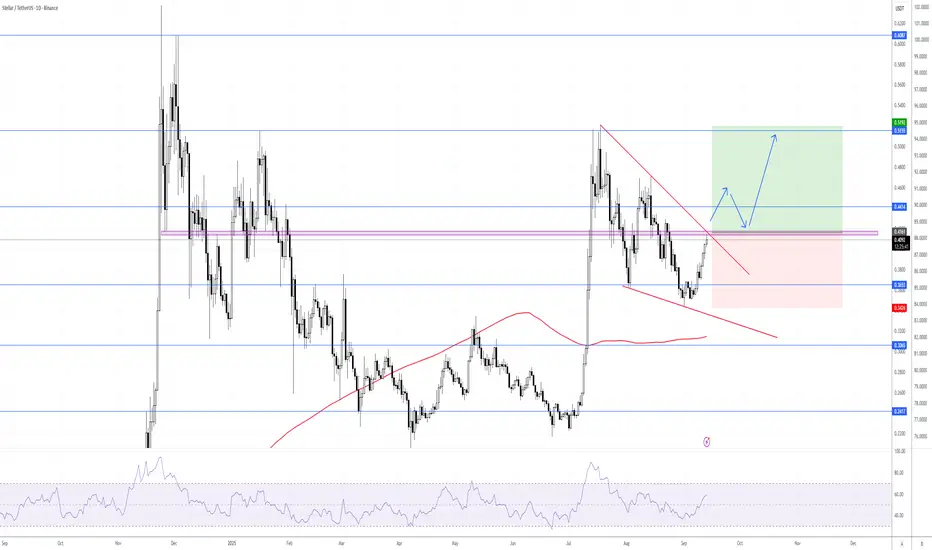
XLMUSDT → End of correction. One step away from a rally BINANCE:XLMUSDT follows the flagship currency in forming a rally and breaking out of the correction. The trend is bullish, but news is ahead. Will the bulls be able to keep the price above the risk zone?
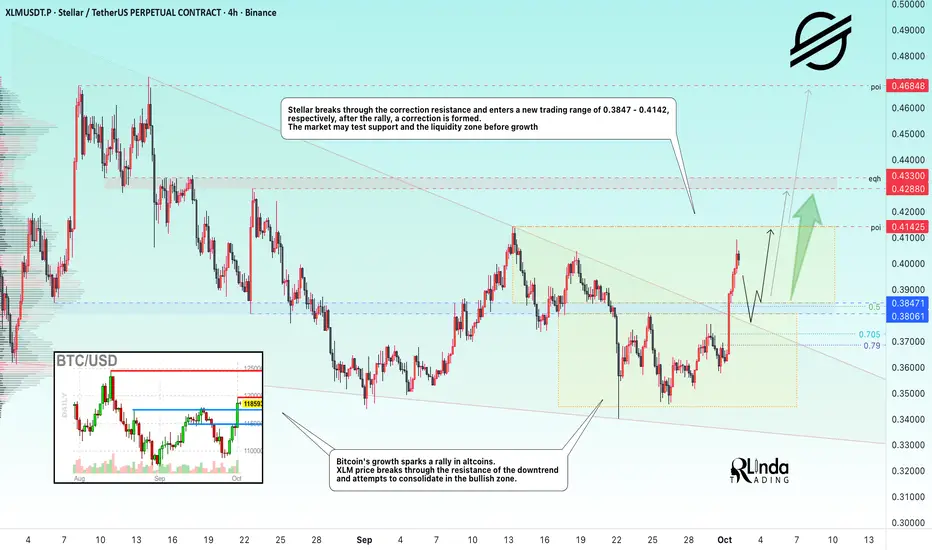
Bitcoin's growth is provoking a rally in altcoins. The price of XLM is breaking through the resistance of the downtrend and trying to consolidate in the bullish zone.
Stellar is breaking through the resistance of the correction and entering a new trading range of 0.3847 - 0.4142, respectively, after the rally, a correction is forming. The market may test support and the liquidity zone before rising.
Resistance levels: 0.4142, 0.4288, 0.433
Support levels: 0.3847, 0.3806
As part of the correction, I expect a retest of the 1/2 zone of the formed impulse or the support zone of 0.385 (previously broken consolidation and descending wedge border).
If the bulls keep the price from falling even after the news, the coin may continue its medium-term bullish run to 0.4685.
Best regards, R. Linda!
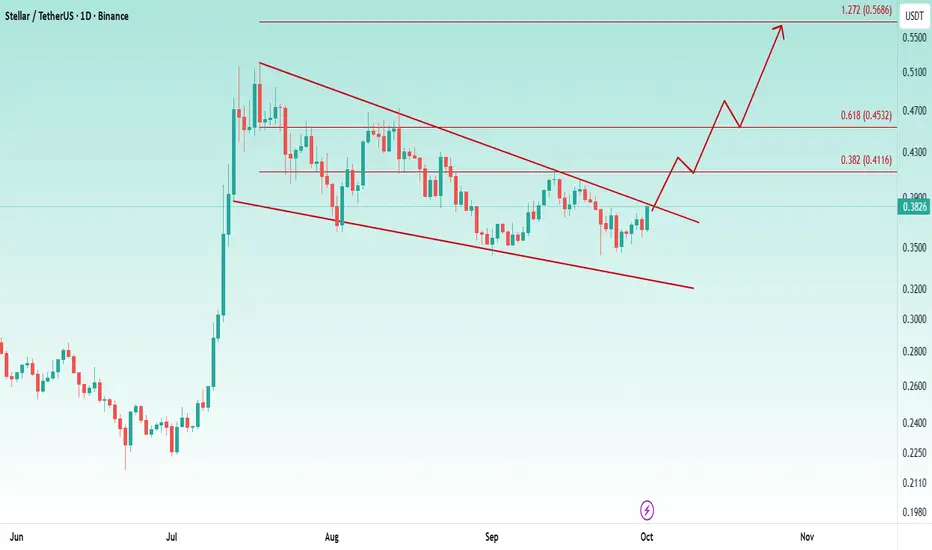
XLM about to breakout 👉 The price bounced perfectly from the $0.35 level and is currently consolidating below the bull flag trendline. A breakout is expected soon, which could trigger the start of a new bullish rally toward a 0.41$, 0.45$, 0.57$
XLM/USDT | Falling WedgeBINANCE:XLMUSDT is forming a falling wedge pattern, and I’ve marked the breakout point.
Once it breaks out, I’d expect it to sequentially test the horizontal resistance levels.

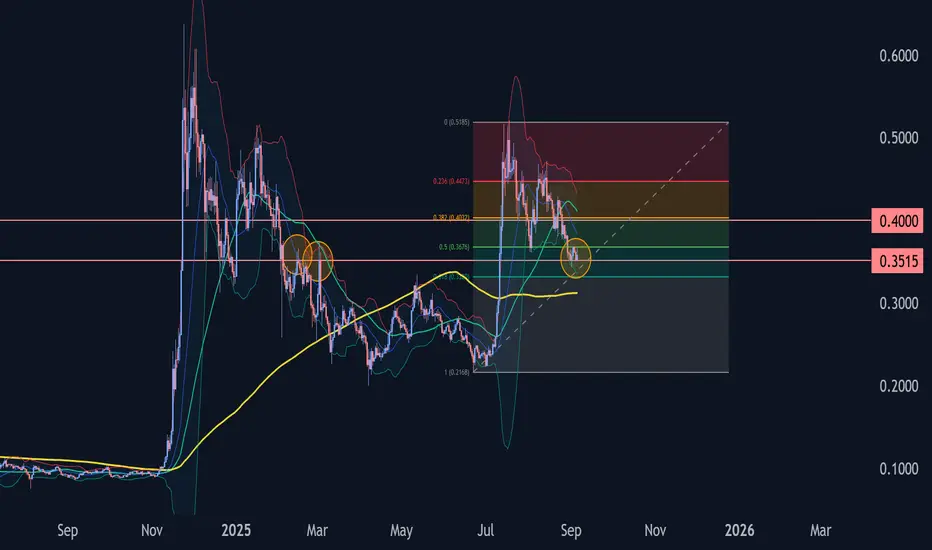
XLM/USDT — Critical Decision Zone at the Golden Confluence!XLM is currently trading at a make-or-break level. The daily chart shows the formation of a descending triangle, with sellers consistently pushing down the highs (lower highs) while buyers are defending a horizontal support zone between 0.3618 – 0.3295 USDT.
This zone acts as a “battle ground” due to several strong confluences:
Fibonacci 0.5 (0.3618) and 0.618 (0.3295) — the golden retracement area.
A historical demand zone (yellow box) that previously triggered strong rallies.
Multiple rejection wicks indicating buyers are still active around this level.
On the other hand, persistent lower highs reflect continuous seller pressure, shaping the descending triangle pattern which typically signals bearish continuation — unless a breakout occurs.
---
🔼 Bullish Scenario
If XLM manages to break above the descending trendline and daily close above 0.4052 USDT with strong volume, it will be a major bullish signal. Potential upside targets:
0.4520 USDT (first resistance / TP1)
0.5047 USDT (TP2)
0.5610 USDT (TP3)
0.634 – 0.637 USDT (psychological resistance, extended target)
Such a breakout could confirm the end of the accumulation phase and open the door for a stronger bullish trend.
---
🔽 Bearish Scenario
Conversely, if price fails to hold and we get a daily close below 0.3295 USDT, the descending triangle would be validated as a bearish continuation pattern. Downside targets include:
0.3295 USDT (first support at Fib 0.618)
0.2190 USDT (measured move projection of the triangle)
0.1997 USDT (historical low, last key support)
A breakdown below this golden pocket would suggest buyers are losing control and XLM may enter a deeper distribution phase.
---
📌 Pattern Summary
Descending Triangle → highlights dominant selling pressure, with buyers holding the base.
Golden Fibonacci Confluence + Demand Zone → makes 0.3618–0.3295 a critical decision zone.
Volume confirmation is key — without strong participation, both breakout and breakdown moves could be false.
---
🎯 Conclusion
XLM is at a crucial crossroads:
Breakout above 0.4052 → potential rally toward 0.452 – 0.505.
Breakdown below 0.3295 → triangle confirmation, targeting 0.22.
Traders should wait for daily close + volume confirmation before entering, and always apply strict risk management with stop-loss placement.
---
#XLM #XLMUSDT #Stellar #CryptoAnalysis #TechnicalAnalysis #Altcoins #CryptoTrading #DescendingTriangle #Fibonacci

XML\USDT 15 minutePrice broke structure to the downside (BOS), leaving multiple fair value gaps (FVGs) above. I’m anticipating a corrective retracement into the imbalance zone to fill premium pricing. My sell order is placed inside the FVG confluence, targeting liquidity resting beneath equal lows. Expecting continuation lower once the retracement is complete. keep in mind if volume dries up here, it could get chopped.

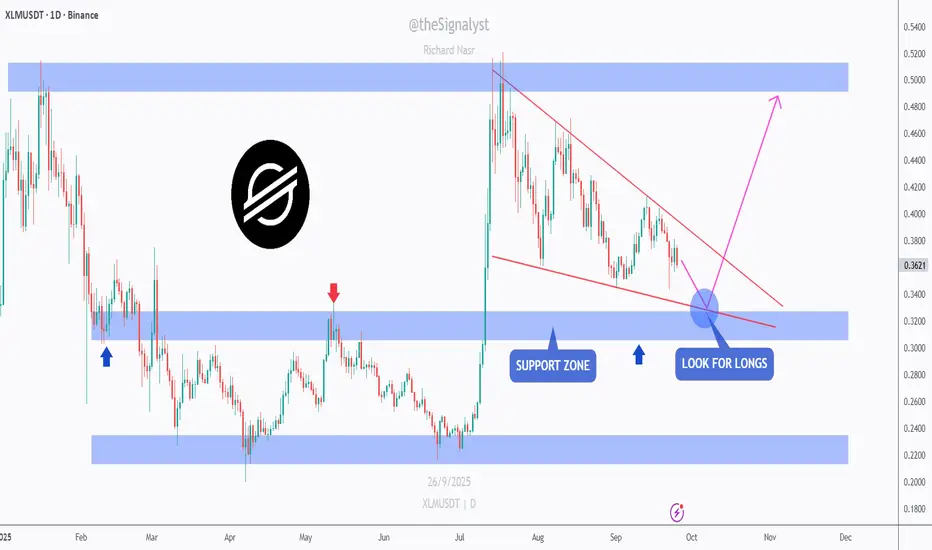
XLM - Waiting for the Wedge × Support RetestXLM is drifting inside a falling wedge and approaching the 0.34–0.32 blue support. I’m waiting for a retest of the intersection between the wedge’s lower trendline and this support to look for longs.
If buyers defend that confluence, I’ll look for a move toward 0.39–0.41, then 0.46–0.52 into the upper supply. A daily close below 0.32 invalidates and puts 0.24–0.23 back in play.
What’s your plan => bid the retest at the intersection, or wait for a clean wedge break first? 🤔
⚠️ Disclaimer: This is not financial advice. Always do your own research and manage risk properly.
📚 Stick to your trading plan regarding entries, risk, and management.
Good luck! 🍀
All Strategies Are Good; If Managed Properly!
~Richard Nasr
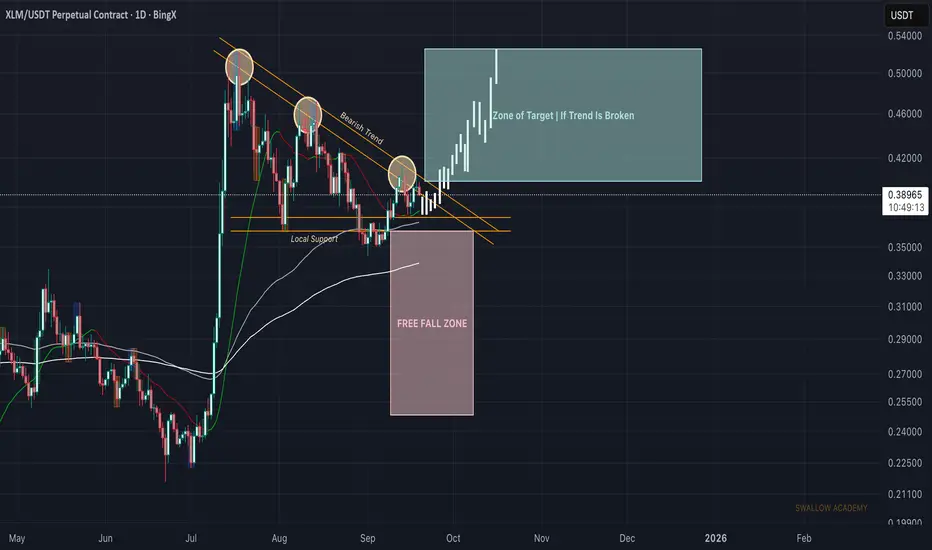
Stellar (XLM): Formed Triangle Pattern | Explosive Move IncomingXLM is inside a triangle pattern and has now reached the end phase — the pressure zone. From here, price has two possible paths, but we favor the bullish breakout. As long as buyers secure this zone, continuation toward $0.54 is in play. A failed breakout would bring us back into the free fall area, so this is the decisive moment to watch.
Swallow Academy
XLMUSDT 1D#XLM is moving inside a falling wedge pattern on the daily chart. Consider buying here at the current price and near the support level of:
🛡 $0.3681 (which is aligned with the daily SMA100)
In case of a breakout above the wedge resistance and the daily SMA50, the potential targets are:
🎯 $0.4304
🎯 $0.4507
🎯 $0.4797
🎯 $0.5166
⚠️ Always remember to use a tight stop-loss and follow proper risk management.

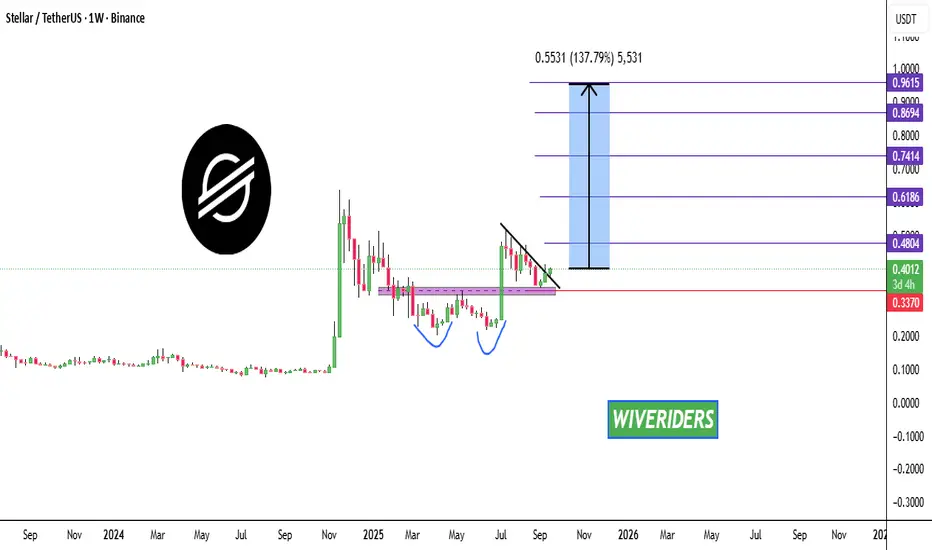
XLM Weekly Market Update – Long Setup📊 CRYPTOCAP:XLM Weekly Market Update – Long Setup
As we can see on the weekly chart, CRYPTOCAP:XLM has formed a bullish double bottom pattern ✅
👉 After the pullback, it broke out of the black resistance zone, confirming a bullish structure.
🔼 Trade Idea:
📈 Entry Price (Current): 0.4002
🎯 Targets:
Target 1 → 0.4804
Target 2 → 0.6186
Target 3 → 0.7414
Target 4 → 0.8694
Target 5 → 0.9615
🛑 Stop Loss: 0.3370
⚠️ Risk: ~15.80%
💰 Potential Reward: ~140.19%
📊 Risk/Reward Ratio: ~8.87
📌 Trade Type: Long
👉 If you’re holding CRYPTOCAP:XLM , these are the weekly targets & stop-loss to watch.
XLM/USDT: Bullish Move to 0.47?BINANCE:XLMUSDT is setting up for a bullish move on the 1-hour chart , with an entry zone around 0.38 near a key support level as observed in the provided chart.
The target range of 0.46-0.47 aligns with the next resistance, offering strong upside potential. Set a stop loss on a close below 0.35 to manage risk effectively. 🌟
A break above 0.39 with solid volume could trigger this rise, driven by market momentum and XLM network activity. Watch BTC trends! 💡
📝 Trade Plan:
✅ Entry Zone: Around 0.38 (support area)
❌ Stop Loss: Daily close below 0.35 to manage risk
🎯 Target Zone: 0.46 – 0.47 (next resistance)
Ready for this push? Drop your take below! 👇

Stellar Bullish FlagXLM/USDT formed a bullish falling wedge and is now approaching resistance. Breakout confirmation above 0.4161 opens the path to 0.5155, with potential extension to 0.6087. Wait for the breakout and the retest. Stop loss below 0.3425.
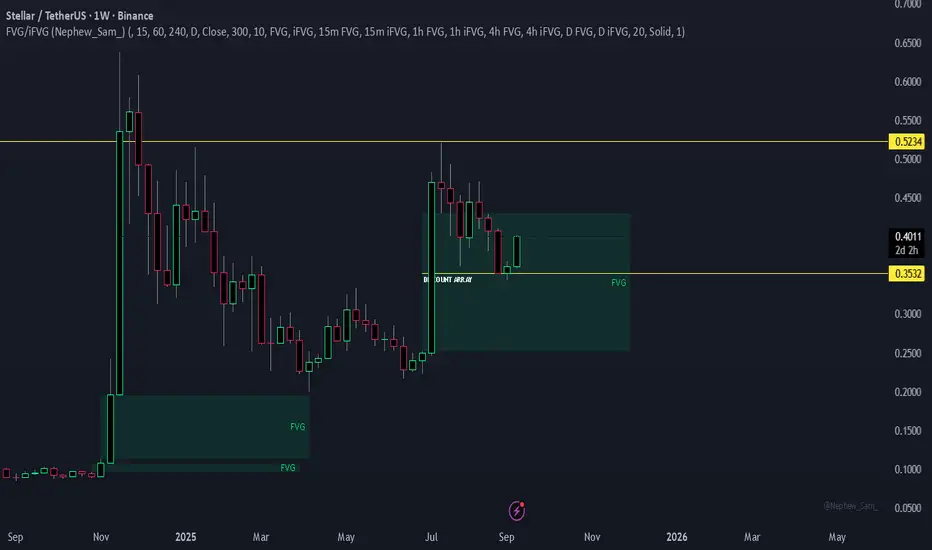
XLM/USDT Weekly Long ViewDISCOUNT ARRAY
Price bounced and respected an internal low after an impressive Breakaway candle that painted a nice WEEKLY FVG. Price seems to have found support and may possibly go higher. A gentle Sweep of the low that failed to create new WEEKLY FVG and instead became the new DISCOUNT ARRAY may indicate a possible liquidity grab to push the price higher.
Target: Premium.
🚩 Invalidation: You will need to manage your weekly trades on lower time-frames. No guarantees.
XLM/USD Technical Outlook | Key Levels & Market InsightsDescription:
Stellar (XLM) is a leading blockchain platform designed for fast and low-cost cross-border transactions. Its strong partnerships and active ecosystem support long-term adoption and liquidity.
This analysis provides key technical levels and potential market scenarios based on price action and chart patterns. Always perform your own research and consider your risk tolerance before trading.
Disclaimer:
This content is for educational purposes only and does not constitute financial advice. Trading cryptocurrencies involves significant risk and may result in the loss of your capital.
#XLM #Stellar #CryptoAnalysis #TechnicalAnalysis #TradingView #CryptoTrading #Blockchain #Altcoins #CryptoMarket #ChartPatterns #PriceAction #Investing #CryptoSignals #XLMUSD

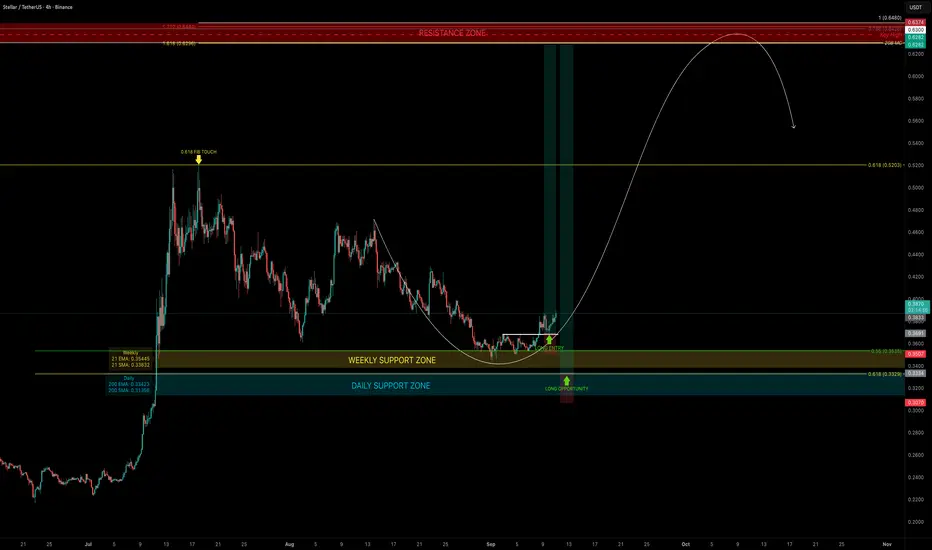
XLM — Correction Ending, Rally Loading?XLM recently found support at the 0.55 Fib retracement, in confluence with the 21 EMA/SMA on the weekly timeframe, triggering a bounce. The ideal 0.618 long entry unfortunately did not come into play.
Support Confluence
21 EMA (weekly): $0.3536
21 SMA (weekly): $0.3384
200 EMA (daily): $0.33425
200 SMA (daily): $0.3136
This cluster around $0.35–$0.31 forms a strong dynamic support zone and a great range for DCA laddering.
Resistance Confluence (Take Profit Zone $0.63–$0.65)
20B Market Cap Resistance: ~$0.63
Key High (Buy-Side Liquidity): $0.6374
0.786 Fib retracement: $0.6426
1.0 Trend-Based Fib Extension: $0.648
1.618 Fib Extension: $0.6296
Together, these create a stacked resistance cluster between $0.63–$0.65 → ideal take-profit zone and potential short setup.
🟢 Trade Plan
Best Entry: Laddering (DCA) from current levels down toward $0.31
Stop-Loss: Flexible depending on DCA strategy, clear invalidation below $0.31
Target (TP Zone): $0.63–$0.65
Technical Insight
The bounce from the 0.55 Fib retracement + weekly 21 EMA/SMA shows bulls defending this zone.
With strong dynamic support below and a stacked resistance confluence cluster at $0.63–$0.65, XLM may be setting up for a 70%+ rally.
DCA remains the best approach, as laddering down toward $0.31 allows flexible positioning.
Key Levels to Watch
Support: $0.35–$0.31 (EMA/SMA cluster, DCA zone)
Resistance / TP: $0.63–$0.65 (Fib, extensions, market cap confluence)
🔍 Indicators used
Multi Timeframe 8x MA Support Resistance Zones → to identify support and resistance zones such as the weekly 21 EMA/SMA.
➡️ Available for free. You can find it on my profile under “Scripts” and apply it directly to your charts for extra confluence when planning your trades.
_________________________________
💬 If you found this helpful, drop a like and comment!
Expected $XLM Price Drop After $0.407 Peak!This is not a buy or sell recommendation. I expect the price of CRYPTOCAP:XLM to start a downward move with a target of $0.305 after reaching $0.407.
I invite you to check out the outstanding results of my previous analyses.
Thanks.

Stellar (XLM) Market Outlook — September 02, 2025Sergio Richi Premium ✅
#Stellar CRYPTOCAP:XLM — Market Outlook — September 02, 2025.
Current price : $0.3620
Charts:
Let’s be real: Stellar isn’t just another alt. It’s got actual utility — fast cross-border payments, cheap fees, and big-name partners (Visa, PayPal, MoneyGram, even Telegram wallets). That’s not meme-coin hype, that’s infrastructure.
Why It Matters
➖ Protocol 23 Upgrade (September 3, 2025): A major network enhancement focusing on scalability for tokenization and RWA use cases, including improved smart contract performance and data handling. This is expected to boost institutional adoption and could drive XLM toward $1.27-$2.39 if bullish momentum holds.
➖ Archax Partnership (August 18, 2025): Collaboration with institutional-grade exchange Archax to accelerate RWA tokenization, including fractional real estate and yield-bearing assets.
➖ PayPal PYUSD Integration (July–August 2025 Impact): PayPal's stablecoin on Stellar triggered a 5% price surge earlier, with ongoing effects into August. PayPal's Digital Currencies SVP joining SDF further strengthens ties.
➖ Telegram Wallet Integration: Enables seamless XLM transfers within chats, boosting mass adoption.
➖ ZARC Stablecoin Launch (Ongoing 2025): TD Markets' South African Rand-pegged asset on Stellar, ideal for remittances.
➖ Visa Stablecoin Settlement Support: Visa added Stellar for settlements with PYUSD, USDG, and EURC, enhancing global payment rails.
➖ UNDP Partnership and SDG Accelerator: Stellar joins for pilots in climate finance and social protection.
➖ RWA and DeFi Milestones: Q2 2025 saw $4 billion in RWA payments, with tokenized assets rising from $15.2B to $24B. DeFi TVL growth across protocols signals real-world utility.
The Trade
XLM is sitting at $0.36 after a choppy summer. In my book, it’s coiling for the next leg of the global bull run.
🎯 Targets:
➡️ Take Profit 1: $1.27 (+250%)
➡️ Take Profit 2: $2.39 (+560%)
Final Take
Stellar’s building the rails while half the market’s still arguing about ETFs. At these levels, risk/reward screams long.

XLM: Hidden Accumulation Before a Violent Breakout?Yello, Paradisers do you see what’s happening on Stellar right now? While most eyes are turned away, XLM has been quietly carving a base inside a major demand zone, and the setup looks like it could fuel a massive move soon.
💎After weeks of pressure inside a descending channel, #XLMUSDT finally broke out, confirming that sellers are losing strength. For the last several days, XLM has been consolidating right above demand at $0.34–$0.35, holding firm despite repeated retests. This zone remains the line in the sand: as long as it’s defended, buyers keep the upper hand.
💎The breakout area around $0.37 is crucial now. A sustained close above it can trigger momentum toward the $0.42 minor resistance, and eventually even $0.48 where strong supply waits. On the flip side, failure to hold the demand zone could open the door for a deeper flush down into the invalidation area near $0.28, a level that would completely shift the outlook back to bearish.
💎Momentum indicators are already hinting at early accumulation, with signs of buyers stepping in at each retest of support. If this continues, #XLM could deliver a sharp vertical move that catches most of the market unprepared.
🎖Strive for consistency, not quick profits. Treat the market as a businessman, not as a gambler.
MyCryptoParadise
iFeel the success🌴


Stellar Wave Analysis –5 September 2025
- Stellar reversed from the key support level 0.3515
- Likely to rise to resistance level 0.4000
Stellar cryptocurrency recently reversed from the support area between the key support level 0.3515 (former resistance from February and March), lower daily Bollinger Band and the 61.8% Fibonacci correction of the upward impulse from August.
The upward reversal from this support area stopped earlier short-term impulse wave C of the ABC correction 4 from July.
Stellar cryptocurrency can be expected to rise in the active impulse wave 5 toward the next round resistance level 0.4000.
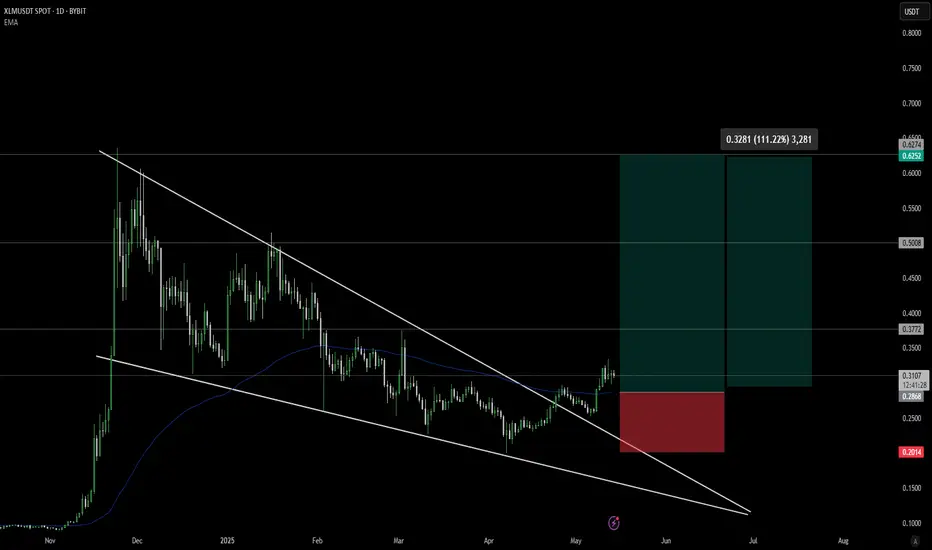
From Compression to Expansion: XLM Eyes 100% Move After BreakoutStellar Lumens BINANCE:XLMUSDT has emerged from a prolonged consolidation within a descending wedge pattern, delivering a potentially bullish breakout on the daily chart. This technical development could mark a significant turning point.
Technical Structure: The Descending Wedge
The descending wedge is a bullish reversal pattern that forms when the price action creates lower highs and lower lows within two converging trendlines. Since late 2024, XLM has traded within such a structure, slowly compressing in volatility as the apex of the wedge approached. This formation reflects a decline in bearish momentum and hints at an eventual upward resolution, precisely what occurred in early May 2025.
The breakout above the upper trendline of the wedge is a significant technical signal, suggesting a shift from distribution to accumulation. Breakouts from descending wedges often lead to sharp, directional moves as sidelined buyers regain confidence.
EMA Confluence and Confirmation:
Adding strength to this setup is the reclaim of the 100-day EMA, currently sitting around $0.2872. The EMA had acted as dynamic resistance during the wedge formation, with multiple failed breakout attempts earlier this year. The successful break and hold above this level now signal a potential trend reversal, reinforcing the bullish breakout.
The price is currently consolidating above the 100 EMA, creating a new base of support. If this level holds, it could serve as a launchpad for further upside movement in the days and weeks ahead.
Key Levels and Trade Context:
Immediate resistance lies at $0.3772, which aligns with previous structure highs and horizontal supply zones. Beyond this, higher resistance targets are marked at $0.5008 and $0.6252—each corresponding to major levels from prior cycles.
On the downside, the invalidation point sits clearly below the wedge and the EMA at $0.2014. This makes risk management straightforward for traders, with stops logically placed beneath this key level. The defined support zone gives the trade setup a favorable risk-to-reward profile, offering more than 2:1 reward relative to risk if targeting the first resistance alone.
Pattern Implications and Measured Move:
The measured move from a descending wedge is typically equal to the maximum height of the pattern, added to the breakout point. Based on this metric, a breakout from the $0.31 zone could yield a target close to or even above the $0.60 level, aligning with historical resistance.
This makes the potential upside around 100% or more from current levels, highlighting the value of participating in such early trend reversals when confirmed by multiple technical factors.
Educational Takeaway:
This setup provides an excellent educational case study for traders seeking to improve their pattern recognition skills. The descending wedge is one of the more reliable reversal patterns, especially when paired with additional confirmation such as EMA reclaim, strong volume surges, or bullish candlestick structure at the breakout point.
Understanding the importance of confirmation—rather than anticipation—can greatly improve trade outcomes. This chart also illustrates how structure, trend, and timing come together to create asymmetric opportunities in the crypto market.
Conclusion:
The breakout in XLM/USDT marks a decisive shift in market structure and momentum. The combination of descending wedge resolution, 100 EMA reclaim, and a clearly defined trade setup makes this chart technically attractive. Traders should monitor continuation patterns and volume closely to gauge the strength of the trend, while investors may consider this a signal that the longer-term bottom could be forming.
As market sentiment across altcoins improves, CRYPTOCAP:XLM 's current technical posture positions it as a prime candidate for outsized gains. Whether you're actively trading or looking for longer-term entries, XLM deserves a spot on your watchlist in the weeks ahead.
Stellar (XLM): Looking For Market Structure Break | Bullish PlayXLM has successfully filled the CME gap and is now holding above the key zone. From here, our focus shifts to a potential market structure break (MSB).
If buyers keep defending this level, the bounce setup stays valid, and we’ll be looking for continuation higher toward the upper resistance zone. This area will give us the next strong reaction and confirm whether buyers can sustain momentum.
Swallow Academy

Long XLMBTC is bouncing from a strong support.
XLM would have another leg up from the local support trendline.
Trade setup is as in chart.
