crude oilCrude oil is currently on main wave B of an A,B & C correction, pair has completed sub-wave A & now its currently on towards sub-wave B is about to be confirmed as pair is expected to breakout towards minor-wave 5 of sub-wave C on main wave B
XTIUSD_LMAX trade ideas

USOil short term Bullish and long term Bearish**Monthly Chart**
USOil last monthly candle created a swing high with a Ring high formation which indicates a continuation of the bearish trend as it bounced from a key level at around 87.60. This month the price opened from the low of the previous candle and continues to move lower. The next level is around 70.00 and then 66.60.
**Weekly Chart**
The last weekly candle closed bearish which has created a different opinion on whether USOil price might continue moving lower after breaking the soft support level or bounce from it at around 75.90.
**Daily Chart**
I am seeing short-term bullish to break the equal highs above 80.00 level before continuing the move lower. Therefore, my long-term bias is still bearish for USOil.
The plan for this week. I will only react near the low and high of the levels that I marked. Plus I will look for a confirmation candle (some calls it insurance candle).

OIL will going up around 83Oil will going up aroung 83, Buy now.
we can see Oil has Descending Braodening Wedge Pattern.

Market Analysis: Crude Oil Price Signal Bearish AccelerationMarket Analysis: Crude Oil Price Signal Bearish Acceleration
Crude oil prices declined steadily below the $80.00 support and moved into a bearish zone.
Important Takeaways for Oil Prices Analysis Today
Crude oil prices extended downsides below the $78.00 support zone.
A major bearish trend line is forming with resistance near $78.00 on the hourly chart of XTI/USD at FXOpen.
Oil Price Technical Analysis
On the hourly chart of WTI Crude Oil at FXOpen, the price struggled to continue higher above $80.00 against the US Dollar. The price formed a short-term top and started a fresh decline below $78.00.
There was a steady decline below the $77.40 pivot level. The bears even pushed the price below $76.50 and the 50-hour simple moving average. Finally, the price tested the $76.30 zone. The recent swing low was formed near $76.31, and the price is now consolidating losses.
Immediate support is near the $76.30 level. The next major support on the WTI crude oil chart is near $75.00. If there is a downside break, the price might decline toward $73.50. Any more losses may perhaps open the doors for a move toward the $72.00 support zone.
On the upside, immediate resistance is near the 23.6% Fib retracement level of the downward move from the $78.52 swing high to the $76.31 low at $76.80.
The next resistance is near the 50-hour simple moving average and the 50% Fib retracement level of the downward move from the $78.52 swing high to the $76.31 low at $77.40. The main resistance is near a trend line at $78.00.
A clear move above the trend line resistance could send the price toward $79.05. The next key resistance is near $79.90. If the price climbs further higher, it could face resistance near $81.20. Any more gains might send the price toward the $82.00 level.
Start trading commodity CFDs with tight spreads. Open your trading account now or learn more about trading commodity CFDs with FXOpen.
This article represents the opinion of the Companies operating under the FXOpen brand only. It is not to be construed as an offer, solicitation, or recommendation with respect to products and services provided by the Companies operating under the FXOpen brand, nor is it to be considered financial advice.


WTI in daily chart Hello
I don't think it is necessary to repeat same expressions because it is really boring. What is happening in OIL market is to decrease the price and increase the sell power to balance it.
WTI was able to penetrate into our resistance level and it is making a first wave. We traders should change our decisions whenever it is necessary and never insist in our ideas. For now I am following the bearish market for Oil. I am not sure how long it can correct (may till Trump becomes US president) and we have to decide fir short-term because Oil (as I mentioned in my last ideas) is in a consolidation (range) are with many R/S level.
Thanks

USOIL - where is current support? holding or not??#USDOIL.. market placed 80 plus day high and dropped again . now market have a supporting area here,
keep close it because if market hold it then again bounce expected from here,
don't be lazy here.
good luck
trade wisely
Short Crude OilOn Daily Chart and 4H chart we created the megaphone(broadening formation) so I would check the top boarder of the formation and look for breaking market structure.

WTIin the pic u see that our downtrend was broken with good impulsive move out
after that i stay like snake to hunt it
the price come to my zone
now if i see good confirmation i will long wti

Oil Prices Rally from a Six-Week NadirOil prices increased early on Thursday, recovering from a six-week low after a significant 3.6% fall the previous day, which was the lowest point since mid-March. This drop was attributed to an unexpected surge in U.S. stockpiles, indicating softer demand than anticipated.
At the same time, market observers have pointed out that the Federal Reserve has kept interest rates steady, diminishing earlier expectations for a rate cut. PVM Oil Associates commented, "The reduction in borrowing costs may not occur as soon or as quickly as previously thought. It is similar to peak oil demand—consistently anticipated yet never realized."
Technically:
The price has stabilized within the bearish zone, having already breached the pivotal range between 80.73 and 82.24. This suggests a continuation of the bearish trend, with potential targets at 77.14 and 75.35. A further break below 75.35 could lead the price down to 69.78.
Conversely, if the price stabilizes above 82.24, it may indicate a bullish trend, potentially reaching up to 86.86.
Pivot line: 80.73
Support lines: 77.14, 75.35, 69.78
Resistance lines: 82.24, 86.86, 89.08

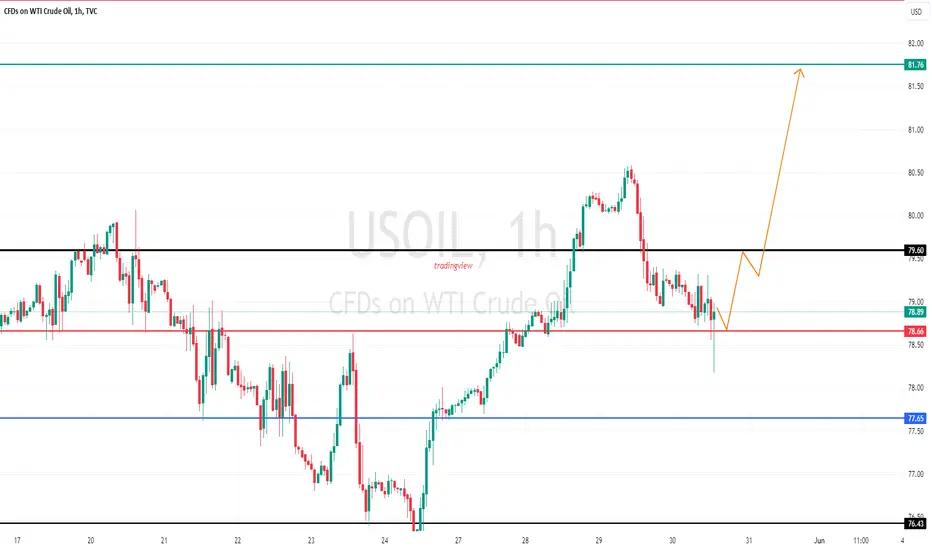
USoil will further push Down-side After Testing TrendlineHello Traders
In This Chart XTIUSD HOURLY Forex Forecast By FOREX PLANET
today XTIUSD analysis 👆
🟢This Chart includes_ (XTIUSD market update)
🟢What is The Next Opportunity on XTIUSD Market
🟢how to Enter to the Valid Entry With Assurance Profit
This CHART is For Trader's that Want to Improve Their Technical Analysis Skills and Their Trading By Understanding How To Analyze The Market Using Multiple Timeframes and Understanding The Bigger Picture on the Charts

USOILWe can attempt to buy USOIL from specified level as it break LH , also bullish divergence occur indicate that it move upward .
SL , TP mention in chart.

UsOil longUsoil looks for more buy momentum use Stop-loss we have entered after confirmation only in this pair so it may slow process but sure process

USOIL - Heading Lower Looks like that little bounce was a short covering shakeout and now the dominant trend has resumed to the downside 🧐.
Not advice.

US OILWe are starting to see the early signs of seasonal tendencies across all markets. Price took out the 76.84 low (Turtle soup) on which it is acting as a support currently. The consolidation we are currently in will most likely be broken in the next week and we will look for an entry long on the lower TF as well. Target 1 coming in at 82.05, Target 2 at 84.42 and Target 3 at 87.59 More updates to follow

USOIl ANAYLSISUSOIL Forecast --------------------------------------------------------
Dear Traders, USOIL is moving in downtrend channel, and rejected from the last support zone, we need breakout for the previous weekly low then the next oil target will be lower to 72/71 zone, or to go long we need to breakout the downtrend channel with more confirmations to be determined later.

USOIL Technical Analysis! SELL!
My dear friends,
USOIL looks like it will make a good move, and here are the details:
The market is trading on 77.75 pivot level.
Bias - Bearish
Technical Indicators: Supper Trend generates a clear short signal while Pivot Point HL is currently determining the overall Bearish trend of the market.
Goal - 77.07
About Used Indicators:
Pivot points are a great way to identify areas of support and resistance, but they work best when combined with other kinds of technical analysis
———————————
WISH YOU ALL LUCK

WTI Crude Oil: LONGToday's session marks the beginning of the bullish move higher to test the April 2024 WTI highs. The ultimate target seems to be around the 85.00 - 87.00 region. This move begins now and may possibly extend to the end of June or early July.
The stop loss should be around the at least be 77.90.
Stay tuned for updates.

USOIL: Short-term oil prices are on the way to recovering to $80USOIL: Short-time period oil fees are at the manner to convalescing to BSE:EIGHTY because the marketplace is presently watching for the subsequent OPEC+ meeting. However, the chance of a lower is fantastically excessive due to the fact OPEC+ nations have nearly all showed the growth in production. This will probably reason oil fees to drop even lower. Consider ready to promote with USOIL around BSE:EIGHTY with the anticipated goal to go back to $75-76

WTI or USOhello everyone...
the price reach the main resistance area as well reached the resistance downtrend line...price will likely pull back to support area... with today news of crude oil show high number of oil inventories. based on fundamental and technical, we should see some pull back for now...
good luck

US/UK OILClear descending wedge on a weekly/daily structure, looking for a retest of previous resistance for entry. Break on trend line or 8 daily ema may mean a change of trend

Crude bouncesCrude oil has put in quite a turnaround over the last couple of trading sessions. At the end of last week, Brent and WTI had sliced through support and looked as if they were set to head lower. Both had broken down through the lower ends of their respective trading ranges that had been building since the beginning of this month. But prices suddenly turned higher and Brent and WTI are now comfortably back within their ranges once again. This has seen front-month WTI head back towards $80 per barrel, a level which has held as resistance this month. The daily MACDs on both contracts have been in oversold territory since early this month. But these had flattened out recently and turned higher, suggesting a rally could be on the cards. Well it has now happened, but not before support there was a break of significant support. There are meetings between OPEC and OPEC+ members this coming weekend. The expectation is that the group will extend its current production cuts from June through to the end of September. Before then, there’s an update on the Fed’s preferred inflation measure, Core PCE. This has the potential to upset investors if it were to come in above expectations, and thereby reduce the possibility of Fed rate cuts this year.

WTI OIL Strong rejection on 1D MA200 but be aware of a break-outWTI Oil (USOIL) made yesterday a strong rejection on the 1D MA200 (orange trend-line), which has been essentially the Resistance since the price broke below it on May 01. Having this level as a Resistance for 3 weeks makes it the strongest sell entry candidate, considering also the fact that this is the top of the 1-month Channel Down, thus a new Lower High.
As long as we don't close a 1D candle below the 1D MA200, we will be bearish, targeting 74.00 (-7.75% decline, similar to both previous Bearish Legs of the Channel Down). If we do close a 1D candle above the 1D MA200, we will take the small loss and target 83.00 (the 2.0 Fibonacci extension). The reason for being prepared for a long position as well, is because the 1D MACD formed a Bullish Cross.
-------------------------------------------------------------------------------
** Please LIKE 👍, FOLLOW ✅, SHARE 🙌 and COMMENT ✍ if you enjoy this idea! Also share your ideas and charts in the comments section below! This is best way to keep it relevant, support us, keep the content here free and allow the idea to reach as many people as possible. **
-------------------------------------------------------------------------------
💸💸💸💸💸💸
👇 👇 👇 👇 👇 👇
