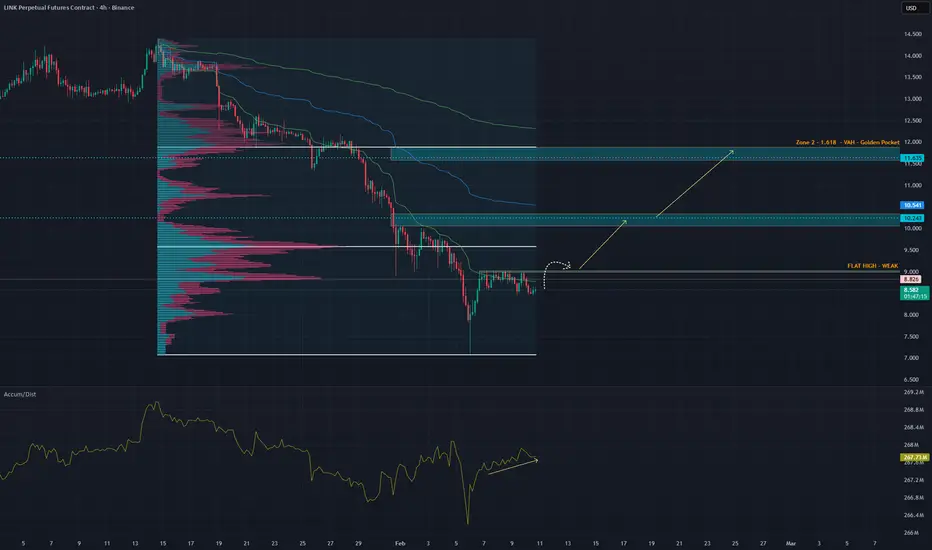
LINK - LONG - The Market Is Setting a Trap$CHAINLINK
Sometimes the market does not whisper.
It speaks clearly.
Both stablecoin-margined and coin-margined futures CVD are bleeding. Sellers are active across derivatives, yet price is barely moving. That tells you everything you need to know. Supply is being absorbed.
Today we saw a sharp
Key stats
About Chainlink
Chainlink is the industry-standard oracle platform bringing the capital markets onchain and powering the majority of decentralized finance (DeFi). The Chainlink stack provides the essential data, interoperability, compliance, and privacy standards needed to power advanced blockchain use cases for institutional tokenized assets, lending, payments, stablecoins, and more. Since inventing decentralized oracle networks, Chainlink has enabled tens of trillions in transaction value and now secures the vast majority of DeFi.
Related coins
Chainlink Head and shoulders almost completeLook at the chart. Speaks for itself. Full reset almost complete, back to baseline. Bigger picture looks like a big adam and eve pattern, would not expose myself to this.

ChainlinkI assume Link could be in this phase of the cycle.
I expect rejection after retest of broken trendline.
Invalidation on return back above trendline.

LINK: No Risk No Gain. Link is setting up a range for a bounce over the weekend ladies and gentlemen.
Many ALTs have the same pattern, is it to continue lower? nah, at least not from the 1hr and 4hrs pov.
Play it right........Play it safe...........Know the rules of the game.
Boost.........Follow........Comment.

LINK to 3 dollars -- Last exit before the elevator down.Chainlink is flashing a head and shoulders.
It is looking to break the previous bear market lows.
And there are fib retracement confluence projections that align with single digit prices.

LINK Spinning Top is Showing Signs of DemandSpinning Top off the 2.272 retracement of wave C. There is potential here for a correction to the upside. Price has made a slightly lower low on the higher time frame 1:1 window combined with the 2.272. Further down below lies an area of higher liquidity, so it's possible that price will be drawn to

LINK - Probable Short Squeeze Lots of equal lows lower for smashing through with potential down -20%.
There are 2 options to find trade opportunities.
1. Retracement to 12.9 and LTF confirm lower
2. A False breakout from 14.4 and LTF confirm lower.

ChainLink Breaks Down: Hold Here or Drop to $6?Chainlink has broken below its previous 3 month support and is now trading within a new 3 month range, which can also be seen in the prior linked charts.
There are two main scenarios to be aware of. At current levels, LINK needs to hold this new 3 month support range to set up the next volatility e

$LINK Potential Bull – Cycle Main PointsTokenization is the new meta.
Chainlink is front and center.
This is definitely a bit hopeful, timeline could stretch.
Purple Box:
The current trading range where price gravitates.
Red Lines:
Multi-year downtrend lines (coming from the 2021 high of $52 and connecting major tops since then). P

Chainlink Wave Analysis – 26 January 2026- Chainlink reversed from support zone
- Likely to rise to resistance level 14.00
Chainlink cryptocurrency recently reversed up from the support zone between the long-term support level 11.60 (which has been reversing the price from June) and the lower daily Bollinger Band.
The upward reversal fro

See all ideas
Summarizing what the indicators are suggesting.
Oscillators
Neutral
SellBuy
Strong sellStrong buy
Strong sellSellNeutralBuyStrong buy
Oscillators
Neutral
SellBuy
Strong sellStrong buy
Strong sellSellNeutralBuyStrong buy
Summary
Neutral
SellBuy
Strong sellStrong buy
Strong sellSellNeutralBuyStrong buy
Summary
Neutral
SellBuy
Strong sellStrong buy
Strong sellSellNeutralBuyStrong buy
Summary
Neutral
SellBuy
Strong sellStrong buy
Strong sellSellNeutralBuyStrong buy
Moving Averages
Neutral
SellBuy
Strong sellStrong buy
Strong sellSellNeutralBuyStrong buy
Moving Averages
Neutral
SellBuy
Strong sellStrong buy
Strong sellSellNeutralBuyStrong buy
Displays a symbol's price movements over previous years to identify recurring trends.
Frequently Asked Questions
The current price of Chainlink (LINK) is 8.430 USD — it has fallen −0.31% in the past 24 hours. Try placing this info into the context by checking out what coins are also gaining and losing at the moment and seeing LINK price chart.
The current market capitalization of Chainlink (LINK) is 5.97 B USD. To see this number in a context check out our list of crypto coins ranked by their market caps or see crypto market cap charts.
Chainlink (LINK) trading volume in 24 hours is 684.67 M USD. See how often other coins are traded in this list.
Chainlink price has risen by 6.04% over the last week, its month performance shows a −40.46% decrease, and as for the last year, Chainlink has decreased by −56.11%. See more dynamics on LINK price chart.
Keep track of coins' changes with our Crypto Coins Heatmap.
Keep track of coins' changes with our Crypto Coins Heatmap.
Chainlink (LINK) reached its highest price on May 10, 2021 — it amounted to 52.990 USD. Find more insights on the LINK price chart.
See the list of crypto gainers and choose what best fits your strategy.
See the list of crypto gainers and choose what best fits your strategy.
Chainlink (LINK) reached the lowest price of 0.126 USD on Sep 23, 2017. View more Chainlink dynamics on the price chart.
See the list of crypto losers to find unexpected opportunities.
See the list of crypto losers to find unexpected opportunities.
The current circulating supply of Chainlink (LINK) is 1.00 B USD. To get a wider picture you can check out our list of coins with the highest circulating supply, as well as the ones with the lowest number of tokens in circulation.
Chainlink has the limit of 1.00 B coins. No matter how the currency evolves, no new coins will be released after this number is reached.
The safest choice when buying LINK is to go to a well-known crypto exchange. Some of the popular names are Binance, Coinbase, Kraken. But you'll have to find a reliable broker and create an account first. You can trade LINK right from TradingView charts — just choose a broker and connect to your account.
Crypto markets are famous for their volatility, so one should study all the available stats before adding crypto assets to their portfolio. Very often it's technical analysis that comes in handy. We prepared technical ratings for Chainlink (LINK): today its technical analysis shows the sell signal, and according to the 1 week rating LINK shows the strong sell signal. And you'd better dig deeper and study 1 month rating too — it's strong sell. Find inspiration in Chainlink trading ideas and keep track of what's moving crypto markets with our crypto news feed.
Chainlink (LINK) is just as reliable as any other crypto asset — this corner of the world market is highly volatile. Today, for instance, Chainlink is estimated as 2.10% volatile. The only thing it means is that you must prepare and examine all available information before making a decision. And if you're not sure about Chainlink, you can find more inspiration in our curated watchlists.
You can discuss Chainlink (LINK) with other users in our public chats, Minds or in the comments to Ideas.