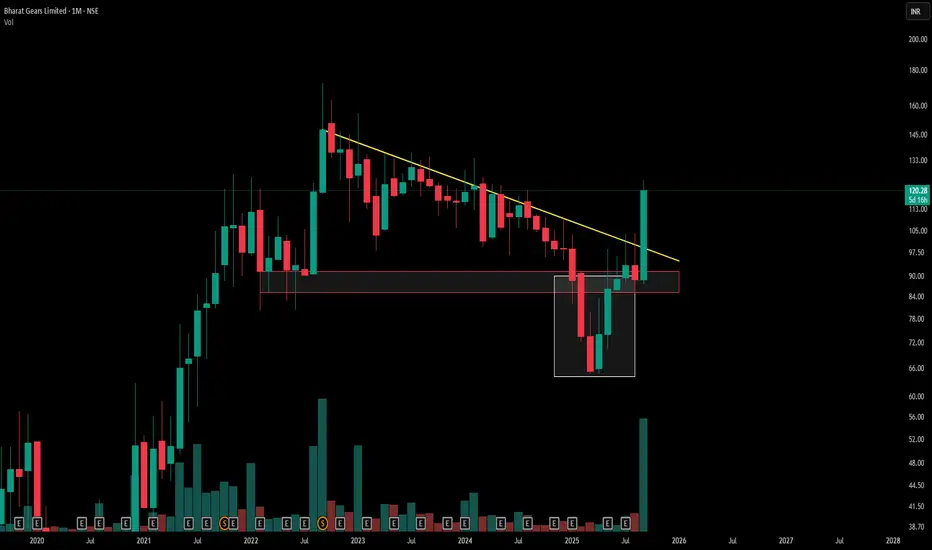
A descending triangle on the monthly chart shows lower highs converging toward a flat support, reflecting mounting seller pressure and key institutional interest at the horizontal base
The red counter trendline highlights corrective rallies within the broader down-sloping resistance.
The red demand zone marks where significant buying absorbed prior declines, offering a structural support area.
The white box illustrates a false breakdown below support—a liquidity-grab that shook out weak hands before a swift recovery—demonstrating how professional traders engineer stop-hunts to secure favorable entry levels.
This interplay of pattern, trendlines, demand zone, and false breakdown underscores how market structure and institutional tactics shape price action—key for informed, risk-defined decisions.
Disclaimer: For educational purposes only. Not investment advice. Risk management and independent research are vital.
🎯 Master My Self-Made Trading Strategy
✅ WhatsApp (Learn Today): wa.me/919455664601
📈 Telegram (Learn Today): t.me/hashtaghammer
✅ WhatsApp (Learn Today): wa.me/919455664601
📈 Telegram (Learn Today): t.me/hashtaghammer
Related publications
Disclaimer
The information and publications are not meant to be, and do not constitute, financial, investment, trading, or other types of advice or recommendations supplied or endorsed by TradingView. Read more in the Terms of Use.