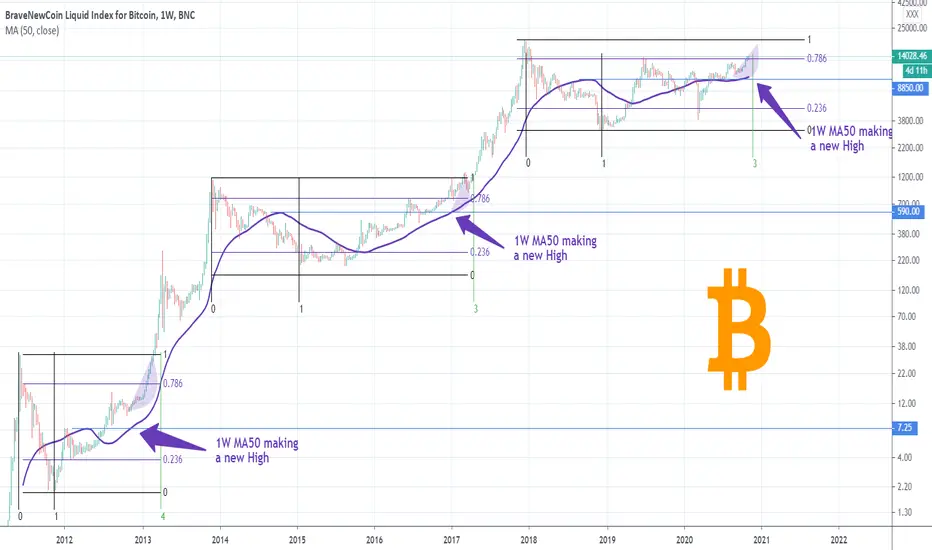
I will keep this simple and short. Every two simple parameters are filled, Bitcoin starts a parabolic bull run.
Those are the MA50 making a new High on the 1W time-frame and trading above the 0.786 Fibonacci retracement level. That happened at least back in late 2012 and 2016.
On present day, two weeks ago the 1W MA50 made a new High, while last week the price broke above the 0.786 Fib.
Can BTC hold onto these levels and kickstart the parabolic bull run? Are those alone enough? Feel free to share your work and let me know in the comments section!
Please like, subscribe and share your ideas and charts with the community!
--------------------------------------------------------------------------------------------------------
!! Donations via TradingView coins also help me a great deal at posting more free trading content and signals here !!
🎉 👍 Shout-out to TradingShot's 💰 top TradingView Coin donor 💰 this week ==> didogetsov
--------------------------------------------------------------------------------------------------------
👑Best Signals (Forex/Crypto+70% accuracy) & Account Management (+20% profit/month on 10k accounts)
💰Free Channel t.me/tradingshotglobal
🤵Contact info@tradingshot.com t.me/tradingshot
🔥New service: next X100 crypto GEMS!
💰Free Channel t.me/tradingshotglobal
🤵Contact info@tradingshot.com t.me/tradingshot
🔥New service: next X100 crypto GEMS!
Disclaimer
The information and publications are not meant to be, and do not constitute, financial, investment, trading, or other types of advice or recommendations supplied or endorsed by TradingView. Read more in the Terms of Use.