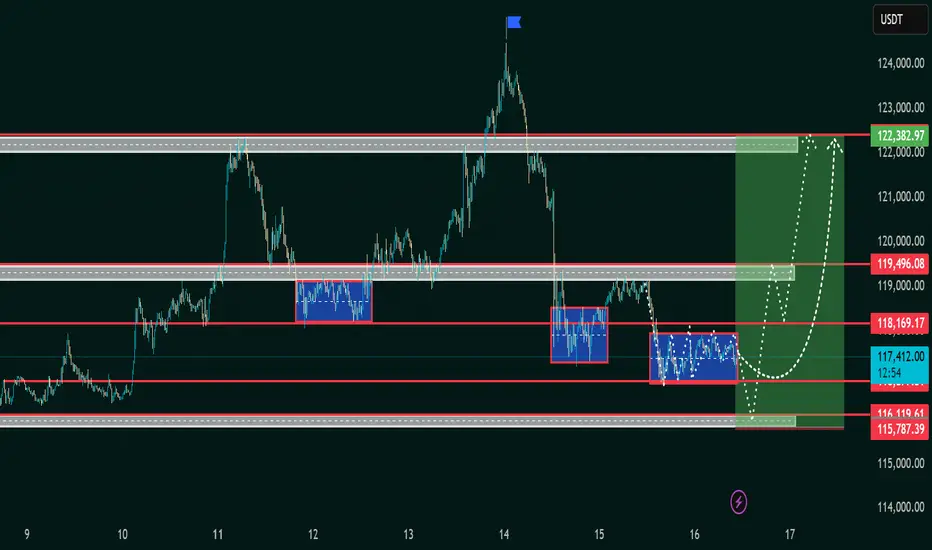
The chart highlights a corrective phase after a strong decline, where price is currently consolidating in the 117,000–116,000 USDT support zone. This range has acted as a demand area, showing repeated accumulation (blue boxes).
Key observations:
Support Zones: Strong demand seen between 115,800 – 116,200 USDT, which has held multiple times.
Resistance Levels:
Immediate resistance at 118,169 USDT
Secondary resistance at 119,496 USDT
Major resistance/target at 122,382 USDT
Pattern Formation: Price action suggests a potential inverse accumulation range that could trigger a bullish reversal.
Projected Move: If price sustains above 118,169 USDT, it may test 119,500 USDT before targeting the 122,000–122,400 USDT supply zone.
Risk Zone: A break below 115,800 USDT could invalidate the bullish outlook and push price lower.
📌 Summary: BTC/USDT is consolidating at a key support area. A breakout above 118,169 USDT may trigger a bullish continuation towards 122,000 USDT, while failure to hold 115,800 USDT risks further downside
Trade active
Market Analyst | Forex Mentor | XAUUSD Specialist
Services Offered:
• VIP Signals
• 1-on-1 Mentorship
• Professional Forex Course
• Affiliate Program
• Strategic Partnerships
Link to Join
t.me/Booming_bulls_10
Services Offered:
• VIP Signals
• 1-on-1 Mentorship
• Professional Forex Course
• Affiliate Program
• Strategic Partnerships
Link to Join
t.me/Booming_bulls_10
Disclaimer
The information and publications are not meant to be, and do not constitute, financial, investment, trading, or other types of advice or recommendations supplied or endorsed by TradingView. Read more in the Terms of Use.