Hi!
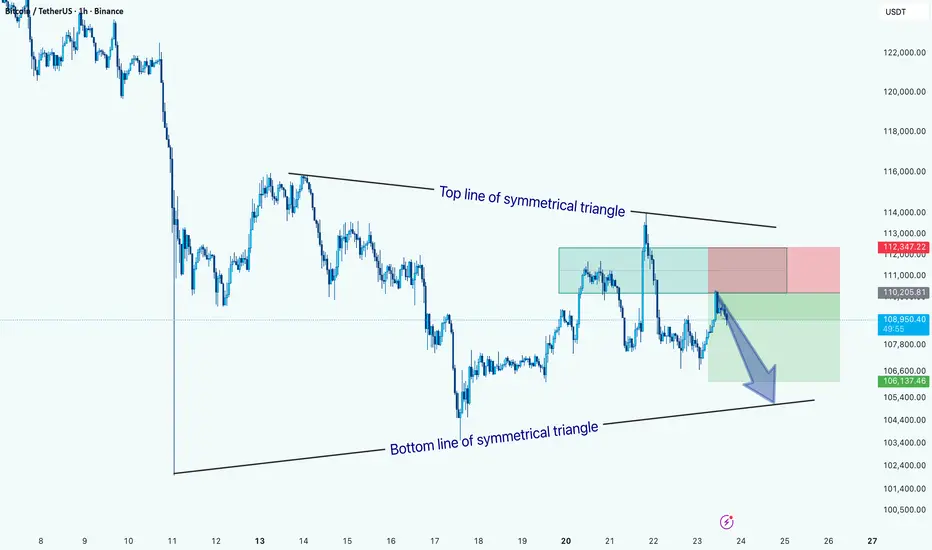
The price action is currently forming a symmetrical triangle pattern, marked by converging trendlines, the top line showing lower highs and the bottom line showing higher lows.
At present, BTC is trading near the upper half of the pattern but has recently faced rejection from the top trendline, indicating potential bearish pressure. The highlighted setup suggests a short position targeting a move toward the bottom boundary of the triangle around $106,000–$105,500, with a stop loss near $112,300.
A confirmed break below the lower trendline could accelerate bearish momentum, while a breakout above the top line would invalidate this bearish scenario and signal possible trend reversal.
Bias: Bearish within the symmetrical triangle until a clear breakout occurs.
Key Levels:
- Resistance: $112,300
- Support: $106,000 / $105,500
Trade active
Proud ThinkMarkets Ambassador -> Discover & Grow: bit.ly/Think-Markets
------
My recommended Exchange -> YEX: bit.ly/YEX-M
------
Telegram channel: t.me/melikatrader94
Forex channel: t.me/melikatrader94GoldForex
------
My recommended Exchange -> YEX: bit.ly/YEX-M
------
Telegram channel: t.me/melikatrader94
Forex channel: t.me/melikatrader94GoldForex
Related publications
Disclaimer
The information and publications are not meant to be, and do not constitute, financial, investment, trading, or other types of advice or recommendations supplied or endorsed by TradingView. Read more in the Terms of Use.